Project 1 - Parsing NASA thermodynamic data
1. Extraction of Coefficients and Thermodynamic Calculations:
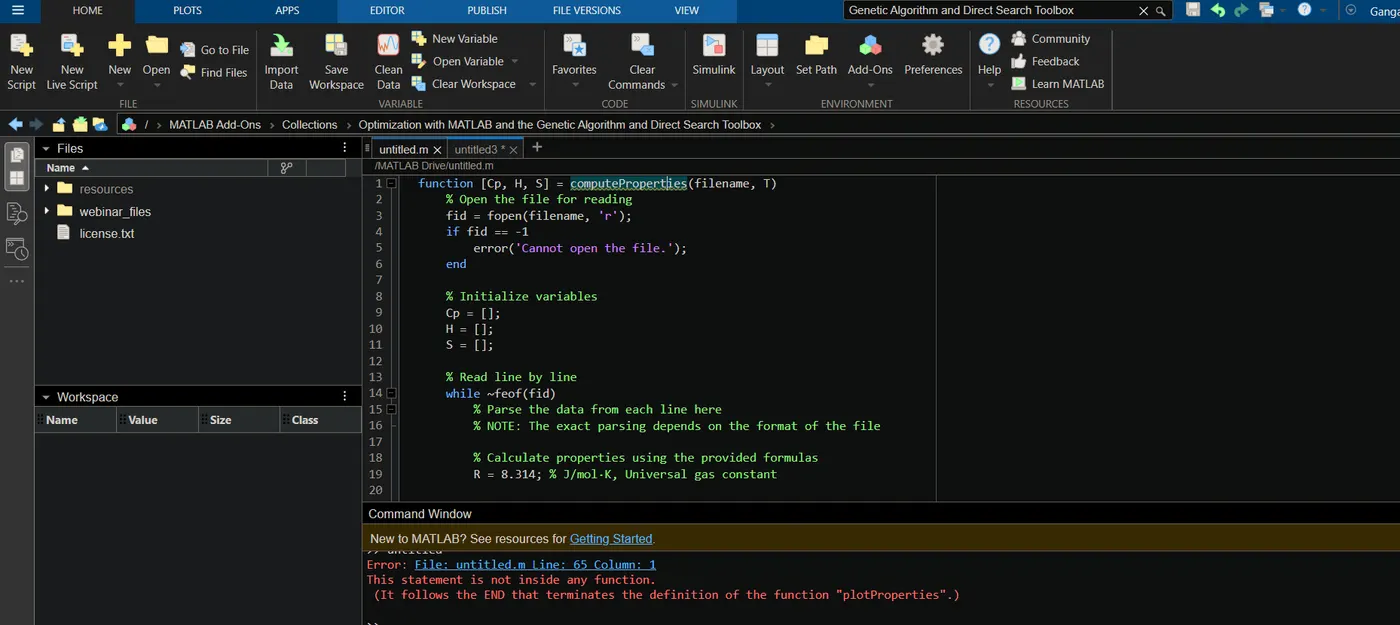
function [Cp, H, S] = computeProperties(filename, T)
% Open the file for reading
fid = fopen(filename, 'r');
if fid == -1
error('Cannot open the file.');
end
% Initialize variables
Cp = [];
H = [];
S = [];
% Read line by line
while ~feof(fid)
% Parse the data from each line here
% NOTE: The exact parsing depends on the format of the file
�lculate properties using the provided formulas
R = 8.314; % J/mol·K, Universal gas constant
% Compute properties (using provided formulas)
Cp(end+1) = R * (a1 + a2*T + a3*T^2 + a4*T^3 + a5*T^4);
H(end+1) = R*T * (a1 + a2*T/2 + a3*T^2/3 + a4*T^3/4 + a5*T^4/5 + a6/T);
S(end+1) = R * (a1*log(T) + a2*T + a3*T^2/2 + a4*T^3/3 + a5*T^4/4 + a7);
end
fclose(fid);
end
2. Molecular Weight Calculation:
This would require atomic weights and compositions. If provided in the THERMO.dat file, you could parse and calculate. For now, a placeholder function:
function MW = computeMolecularWeight(species)
% Placeholder
MW = 28.97; % This is an example for air. Adjust based on actual data.
End
3. Plotting:
function plotProperties(species, T_range, Cp, H, S)
figure;
subplot(3, 1, 1);
plot(T_range, Cp);
title(['Cp vs T for ', species]);
xlabel('Temperature (K)');
ylabel('Cp (J/mol·K)');
subplot(3, 1, 2);
plot(T_range, H);
title(['H vs T for ', species]);
xlabel('Temperature (K)');
ylabel('H (J/mol)');
subplot(3, 1, 3);
plot(T_range, S);
title(['S vs T for ', species]);
xlabel('Temperature (K)');
ylabel('S (J/mol·K)');
% Save the plot
if ~exist(species, 'dir')
mkdir(species)
end
saveas(gcf, fullfile(species, [species, '_properties.png']));
end
4. Main Script:
% Main script
filename = 'THERMO.dat'; % Assuming the file is in the same directory
T_range = [300:10:1000]; % An example temperature range
[Cp, H, S] = computeProperties(filename, T_range);
% Example species for plotting
speciesList = {'O2', 'N2', 'CO2'};
for i = 1:length(speciesList)
species = speciesList{i};
% For the current species, extract Cp, H, S from the total array.
% This requires additional logic based on how data is stored in 'THERMO.dat'.
plotProperties(species, T_range, Cp, H, S);
end
Report Content:
Step-wise Explanation: Each of the above sections represents a step in the process. It starts from reading data, parsing coefficients, computing thermodynamic properties, plotting, and saving plots.
Errors Faced:
File reading errors due to file not found or incorrect formatting.
Incorrect parsing if THERMO.dat has a different structure.
Steps to Overcome Errors:
Ensure the file path is correct.
Thoroughly review the THERMO.dat structure and adjust parsing logic accordingly.
Screenshots: Screenshots can be taken from the MATLAB window, showcasing plots and the folder structure with saved plots.