Project 1 - Parsing NASA thermodynamic data
REPORT
Aim : To write a code in Matlab to parse the NASA thermodynamic data file and then calculate the thermodynamic properties of various gas species.
Objectives :
- To develop a function that extracts the 14 coefficients and calculates the enthalpy, entropy, and specific heats for all the species in a given data file.
- Develop a code to calculate the molecular weight of each species and display it in the command window.
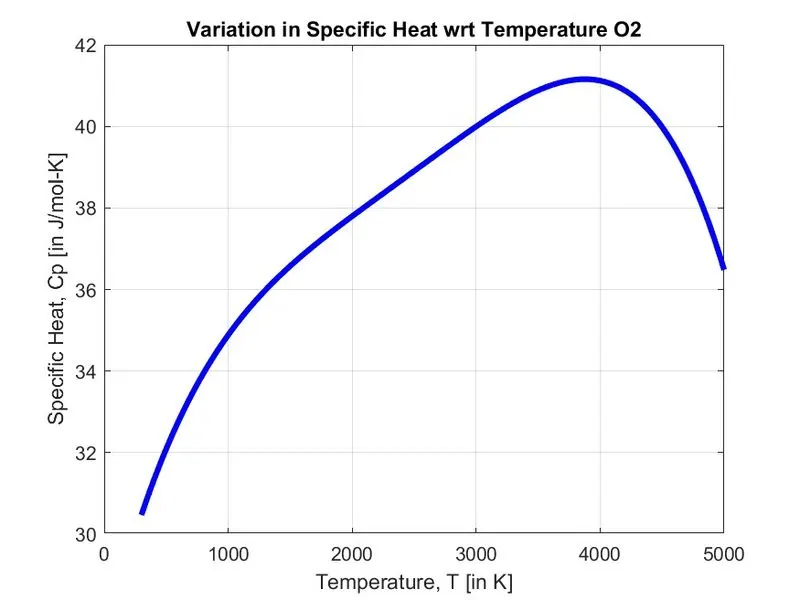
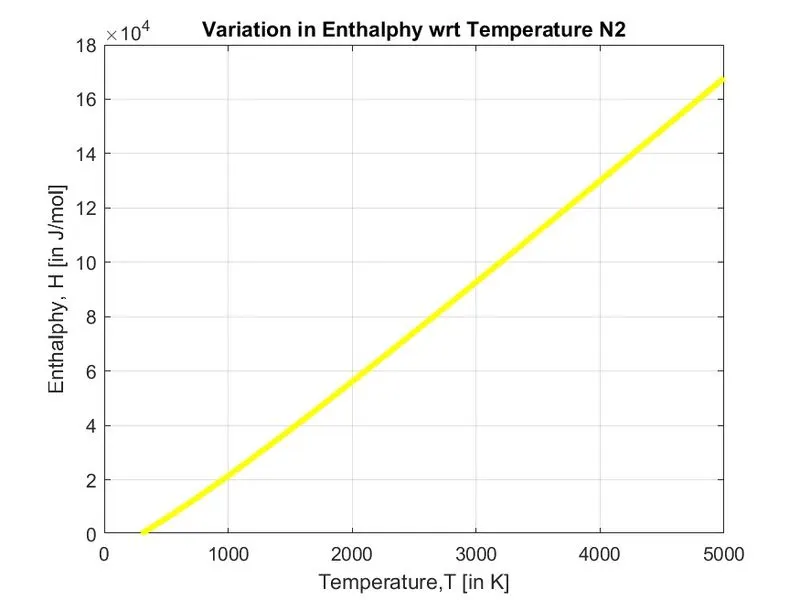
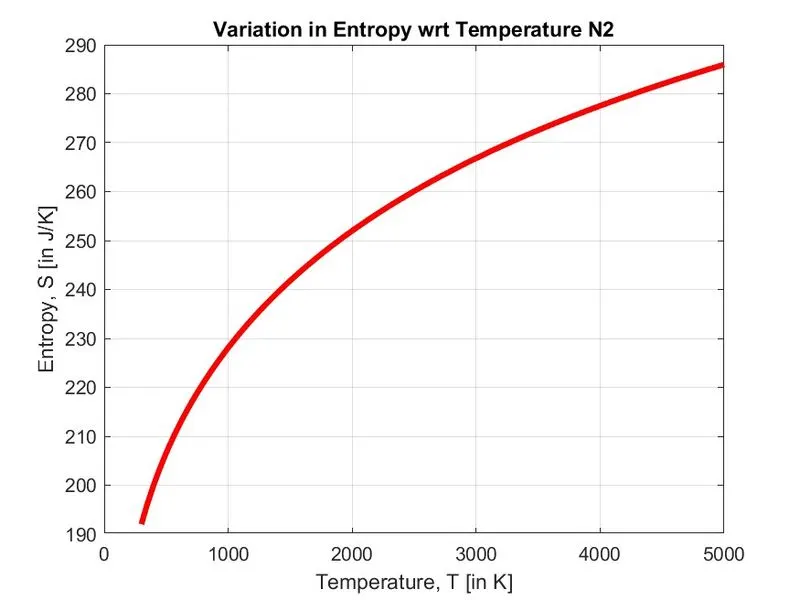
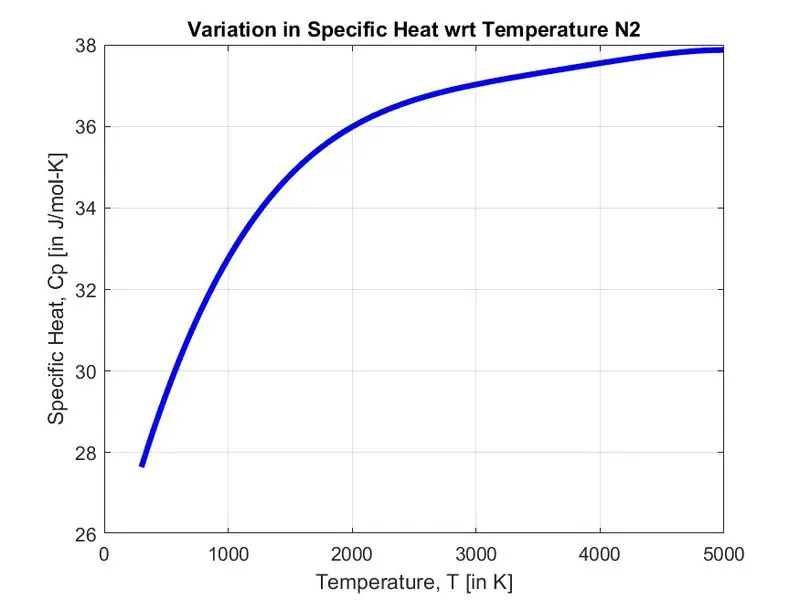
- To plot the Cp, Enthalpy, and Entropy for the local temperature range (low temperature: high temperature) specific for each species and save the plots as images with appropriate names in separate folders for each species. All of these should be generated automatically.
Theory :
Steps for choosing the logic of code and file parsing -
Step 1: - Open the file using fopen command. and parse the file ,
Step 2: - Use fgetl command to navigate throughout the file and read the file line by line to get the desired result.
Step 3: - Reading the text from the header file and read the file line by line
Step 4: - Use strsplit() command to generate then cell array. A cell array is a special data structure to store data of the different type and perform the desired task
Step 5: - Create and call the functions for calculating Cp, H and S by taking the values from the Data file.
Step 6: - Molecular weight function is used to calculate and print the molecular weight of all the elements in the file.
Step 7: - The plots for Cp, H, S are created for each species and saved in a folder in jpg format.
Step 8: - Create a text file to store the molecular weights of all elements.
NASA came up with polynomials that can be used to evaluate thermodynamic properties such as Cp, H, and S. They have also documented the coefficients that are required to evaluate these polynomials for 1000+ species.
- In the given file there are 14 coefficient values, the first 7 are the high-temperature values and the other 7 are the low-temperature values. The first 7 values are used when the temperature of the elements is above the global middle-temperature, and the last 7 values are used when the temperature is below that of the global mid-temp value.

Here,
R = Universal Gas Constant.
a1, a2, a3, a4, a5, a6, a7 = temperature coefficients that is accessed from the data file.
T = temperature of the element.
Cp = Specific Heat of the element.
It is the amount of energy that must be added, in the form of heat, to one unit of mass of the substance in order to cause an increase of one unit in its temperature.
H = Enthalpy of the element.
Enthalpy is a property of an enclosed thermodynamic system which is equal to the system's internal energy plus the product of its pressure and volume. There is no mass transfer and the processes are at constant pressure in the system. The heat absorbed or released equals the change in enthalpy.
S = Entropy of the element.
Entropy, the measure of a system’s thermal energy per unit temperature that is unavailable for doing useful work. It’s as well as a measurable physical property that is most commonly associated with a state of disorder, randomness, or uncertainty.
Molecular weight/ mass is the mass of a given molecule: it is measured in daltons (u). Different molecules of the same compound may have different molecular masses because they contain different isotopes of an element.
Syntax Used during Coding -
fopen : Open a file or obtain information about open files.
‘r’ : Open the file for reading.
‘a+’ : read and write on the file.
Fgetl : Read the data line-by-line from files
strsplit : Split string or character vector at specified delimiter
str2num : Convert character array or string to numeric array
strfind - Find one string within another, is case sensitive.
findstr : is case insensitive
linspace : Generate linearly spaced vectors
fprintf : Write formatted data to file
pwd : Identify current directory
mkdir : Make new directory
cd : Change working directory
Code:
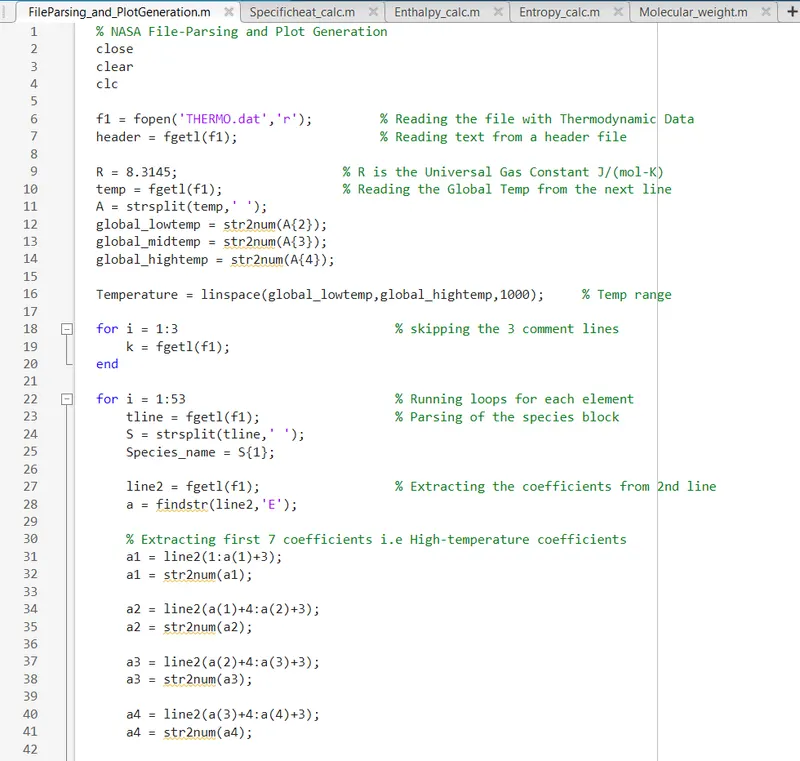
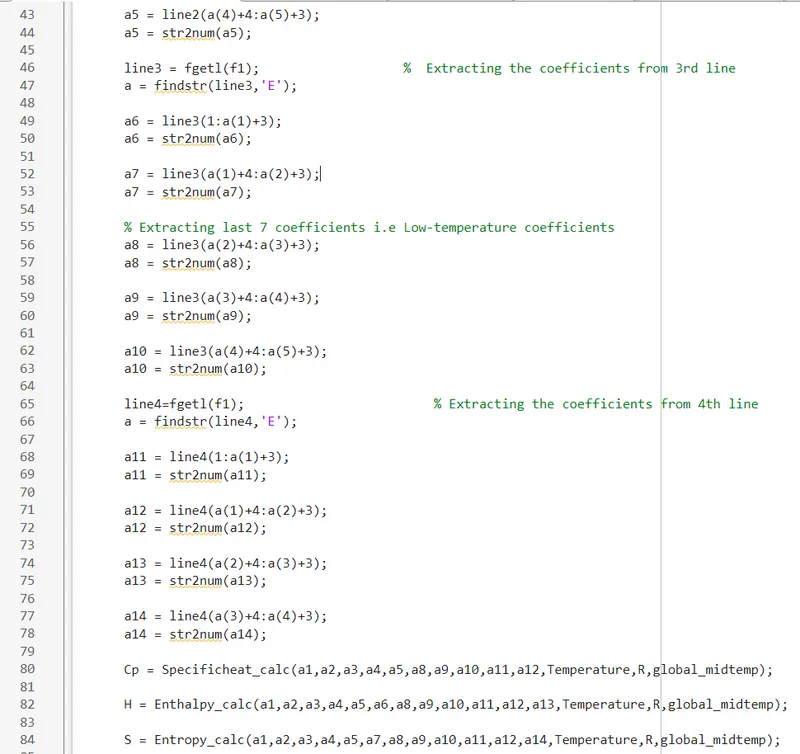
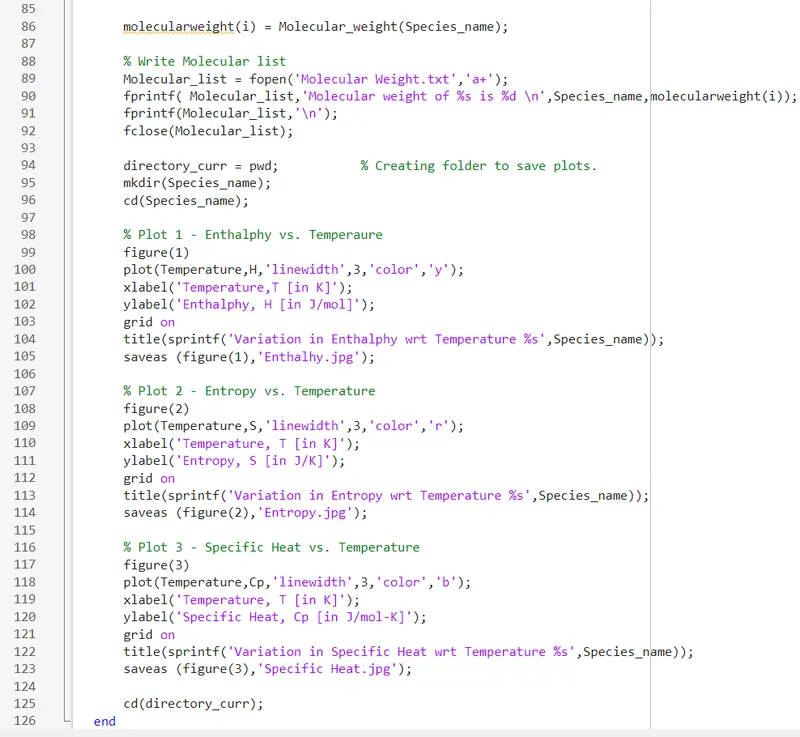
File Parsing, plotting and saving -
Function to calculate Specific Heat Cp -

Function to calculate Enthalpy H -

Function to calculate Entropy S -

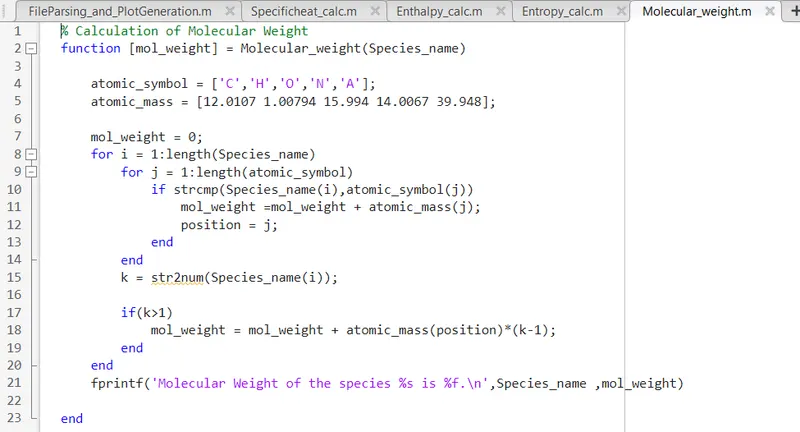
Function to calculate and print Molecular Weight of each species -
Errors :
No complicated errors occurred while running the MATLAB program.
Outputs/ Plotted graphs :
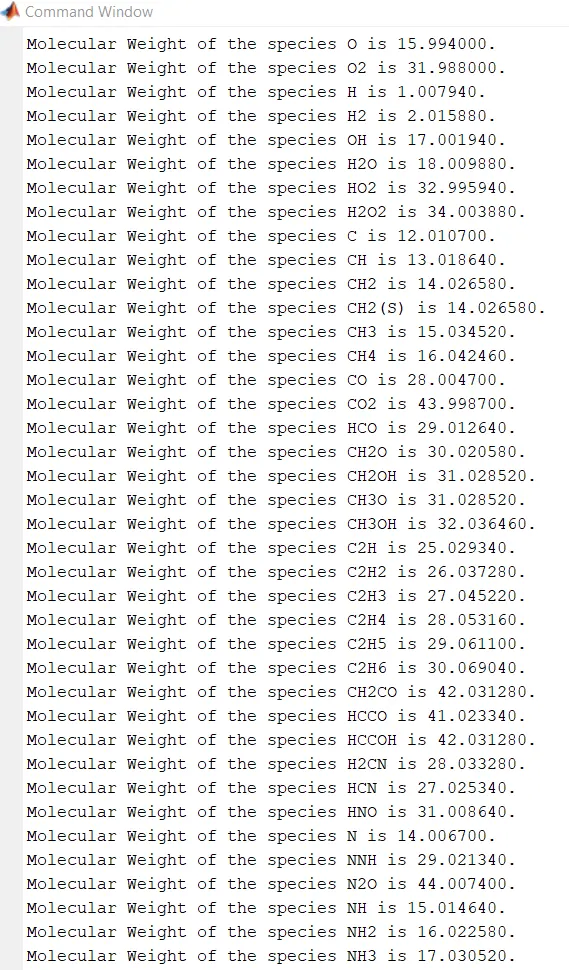
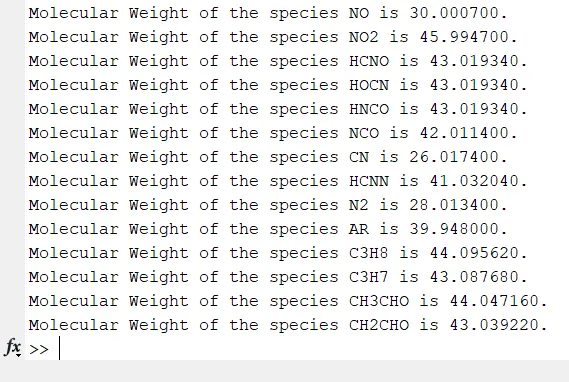
Function output - Molecular_weight()
Plotted and saved graphs for -
- O2
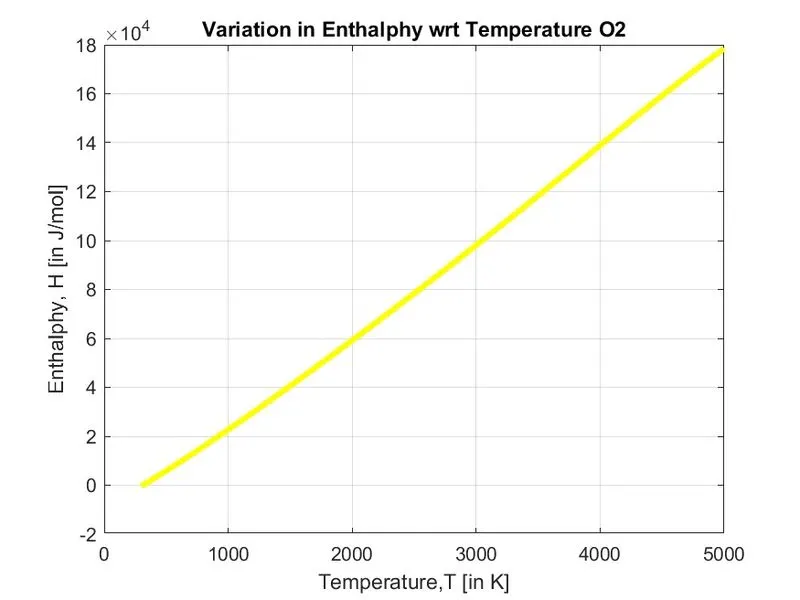
Enthalpy vs Temperature
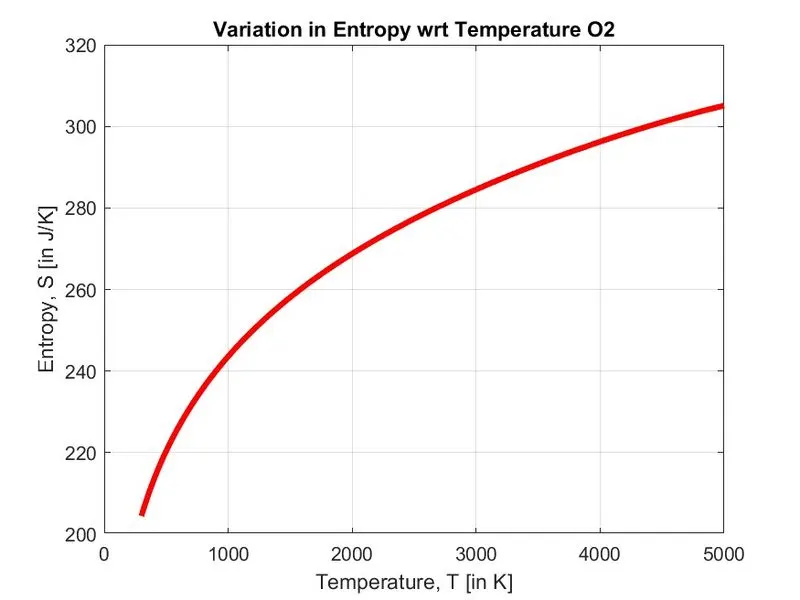
Entropy vs Temperature
Specific Heat vs Temperature
- N2
Enthalpy vs Temperature
Entropy vs Temperature
Specific Heat vs Temperature
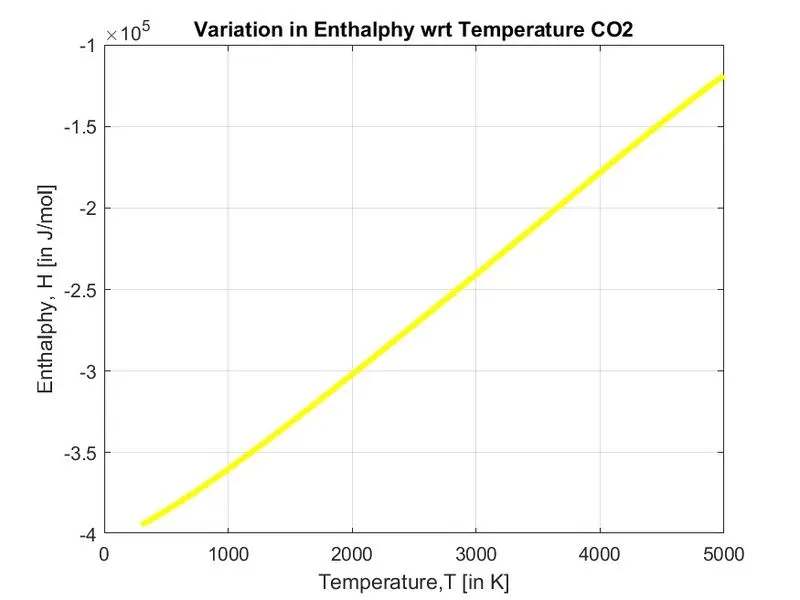
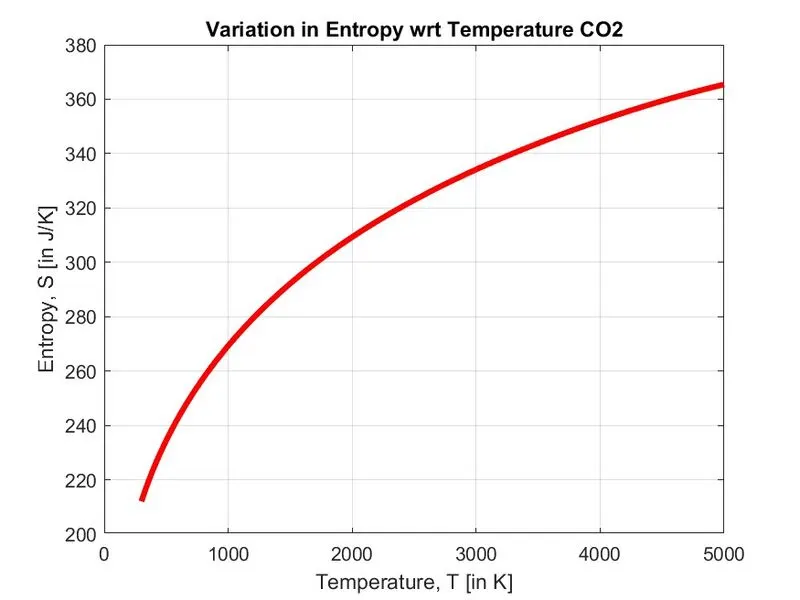
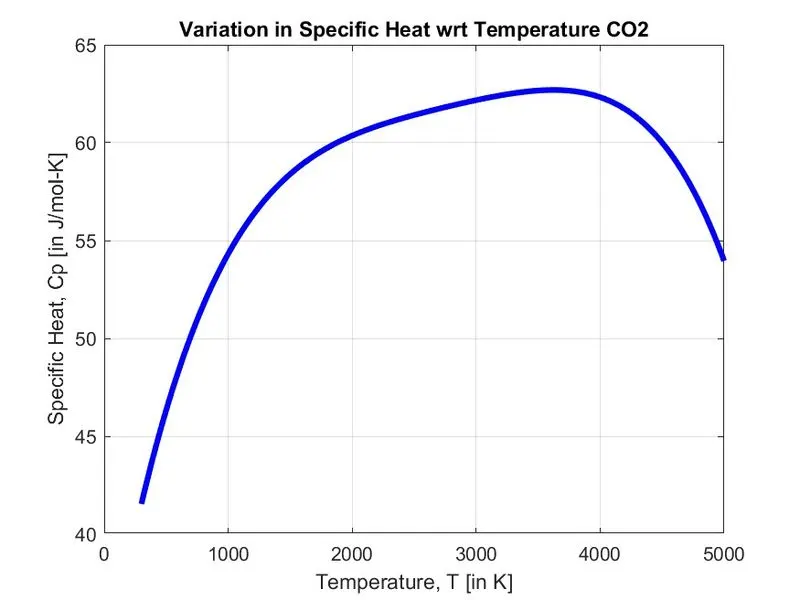
 CO2
CO2
Enthalpy vs Temperature
Entropy vs Temperature
Specific Heat vs Temperature
Saved plotted graphs in the folder -

Conclusion :
- Parsing of the file was done.
- To plots for 53 molecules were generated
- All three plots(Cp, H, S vs temp) were saved in a folder for each molecule
- Molecular weight is generated for the 53 molecules in the command window and is saved in a .txt file.
References :
- https://skill-lync.com/premium/coursevideos/254549/en/34
- https://skill-lync.com/premium/coursevideos/254549/en/1362
- https://skill-lync.com/premium/coursevideos/254549/en/1281
- https://en.wikipedia.org/wiki/Molecular_mass
- https://www.angelo.edu/faculty/kboudrea/periodic/structure_mass.htm
- https://in.mathworks.com/help/matlab/ref/mkdir.html
- https://in.mathworks.com/help/matlab/ref/saveas.html
- https://ntrs.nasa.gov/archive/nasa/casi.ntrs.nasa.gov/19940013151.pdf
% NASA File-Parsing and Plot Generation
close
clear
clc

f1 = fopen('THERMO.dat','r');         % Reading the file with Thermodynamic Data
header = fgetl(f1);                   % Reading text from a header file

R = 8.3145;                      % R is the Universal Gas Constant J/(mol-K)
temp = fgetl(f1);                % Reading the Global Temp from the next line
A = strsplit(temp,' ');
global_lowtemp = str2num(A{2});
global_midtemp = str2num(A{3});
global_hightemp = str2num(A{4});

Temperature = linspace(global_lowtemp,global_hightemp,1000);     % Temp range

for i = 1:3                             % skipping the 3 comment lines
    k = fgetl(f1);
end

for i = 1:53                            % Running loops for each element
    tline = fgetl(f1);                  % Parsing of the species block
    S = strsplit(tline,' ');
    Species_name = S{1};

    line2 = fgetl(f1);                  % Extracting the coefficients from 2nd line
    a = findstr(line2,'E');

    % Extracting first 7 coefficients i.e High-temperature coefficients
    a1 = line2(1:a(1)+3);
    a1 = str2num(a1);

    a2 = line2(a(1)+4:a(2)+3);
    a2 = str2num(a2);

    a3 = line2(a(2)+4:a(3)+3);
    a3 = str2num(a3);

    a4 = line2(a(3)+4:a(4)+3);
    a4 = str2num(a4);

    a5 = line2(a(4)+4:a(5)+3);
    a5 = str2num(a5);

    line3 = fgetl(f1);                   %  Extracting the coefficients from 3rd line
    a = findstr(line3,'E');

    a6 = line3(1:a(1)+3);
    a6 = str2num(a6);

    a7 = line3(a(1)+4:a(2)+3);
    a7 = str2num(a7);

    % Extracting last 7 coefficients i.e Low-temperature coefficients
    a8 = line3(a(2)+4:a(3)+3);
    a8 = str2num(a8);

    a9 = line3(a(3)+4:a(4)+3);
    a9 = str2num(a9);

    a10 = line3(a(4)+4:a(5)+3);
    a10 = str2num(a10);

    line4=fgetl(f1);                         % Extracting the coefficients from 4th line
    a = findstr(line4,'E');

    a11 = line4(1:a(1)+3);
    a11 = str2num(a11);

    a12 = line4(a(1)+4:a(2)+3);
    a12 = str2num(a12);

    a13 = line4(a(2)+4:a(3)+3);
    a13 = str2num(a13);

    a14 = line4(a(3)+4:a(4)+3);
    a14 = str2num(a14);

    Cp = Specificheat_calc(a1,a2,a3,a4,a5,a8,a9,a10,a11,a12,Temperature,R,global_midtemp);

    H = Enthalpy_calc(a1,a2,a3,a4,a5,a6,a8,a9,a10,a11,a12,a13,Temperature,R,global_midtemp);

    S = Entropy_calc(a1,a2,a3,a4,a5,a7,a8,a9,a10,a11,a12,a14,Temperature,R,global_midtemp);

    molecularweight(i) = Molecular_weight(Species_name);

    % Write Molecular list
    Molecular_list = fopen('Molecular Weight.txt','a+');
    fprintf( Molecular_list,'Molecular weight of %s is %d \n',Species_name,molecularweight(i));
    fprintf(Molecular_list,'\n');
    fclose(Molecular_list);

    directory_curr = pwd;           % Creating folder to save plots.
    mkdir(Species_name);
    cd(Species_name);

    % Plot 1 - Enthalphy vs. Temperaure
    figure(1)
    plot(Temperature,H,'linewidth',3,'color','y');
    xlabel('Temperature,T [in K]');
    ylabel('Enthalpy, H [in J/mol]');
    grid on
    title(sprintf('Variation in Enthalphy wrt Temperature %s',Species_name));
    saveas (figure(1),'Enthalpy.jpg');

    % Plot 2 - Entropy vs. Temperature
    figure(2)
    plot(Temperature,S,'linewidth',3,'color','r');
    xlabel('Temperature, T [in K]');
    ylabel('Entropy, S [in J/K]');
    grid on
    title(sprintf('Variation in Entropy wrt Temperature %s',Species_name));
    saveas (figure(2),'Entropy.jpg');

    % Plot 3 - Specific Heat vs. Temperature
    figure(3)
    plot(Temperature,Cp,'linewidth',3,'color','b');
    xlabel('Temperature, T [in K]');
    ylabel('Specific Heat, Cp [in J/mol-K]');
    grid on
    title(sprintf('Variation in Specific Heat wrt Temperature %s',Species_name));
    saveas (figure(3),'Specific Heat.jpg');

    cd(directory_curr);
end


% Calculate Specific Heat
function [Cp] = Specificheat_calc(a1,a2,a3,a4,a5,a8,a9,a10,a11,a12,Temperature,R,global_midtemp)

    if(Temperature <= global_midtemp)
        Cp = R.*(a8 +(a9.*Temperature) +(a10*(Temperature).^2) + (a11*(Temperature).^3) + (a12*(Temperature).^4));
    else
        Cp = R.*(a1 +(a2.*Temperature) +(a3*(Temperature).^2) + (a4*(Temperature).^3) + (a5*(Temperature).^4));
    end
end


% Calculate Enthalpy
function [H] = Enthalpy_calc(a1,a2,a3,a4,a5,a6,a8,a9,a10,a11,a12,a13,Temperature,R,global_midtemp)

    if(Temperature <= global_midtemp)
        H = R*Temperature.*(a8 + (a9*Temperature./2) + ((a10*(Temperature).^2)/3) + ((a11*(Temperature).^3)/4) + ((a12*(Temperature).^4)/5) + ((a13./Temperature)));
    else
        H = R*Temperature.*(a1 + (a2*Temperature./2) + ((a3*(Temperature).^2)/3) + ((a4*(Temperature).^3)/4) + ((a5*(Temperature).^4)/5) + ((a6./Temperature)));
    end
end


% Entropy Calculation
function [S] = Entropy_calc(a1,a2,a3,a4,a5,a7,a8,a9,a10,a11,a12,a14,Temperature,R,global_midtemp)

    if(Temperature<=global_midtemp)
        S = R.*(a8.*log(Temperature) +(a9.*Temperature) +(a10*((Temperature).^2)/2) + (a11*((Temperature).^3)/3) + (a12*((Temperature).^4)/4) + (a14));
    else
        S = R.*(a1.*log(Temperature) +(a2.*Temperature) +(a3*((Temperature).^2)/2) + (a4*((Temperature).^3)/3) + (a5*((Temperature).^4)/4) + (a7));
    end
end


% Calculation of Molecular Weight
function [mol_weight] = Molecular_weight(Species_name)

    atomic_symbol = ['C','H','O','N','A'];
    atomic_mass = [12.0107 1.00794 15.994 14.0067 39.948];

    mol_weight = 0;
    for i = 1:length(Species_name)
        for j = 1:length(atomic_symbol)
            if strcmp(Species_name(i),atomic_symbol(j))
                mol_weight =mol_weight + atomic_mass(j);
                position = j;
            end
        end
        k = str2num(Species_name(i));

        if(k>1)
            mol_weight = mol_weight + atomic_mass(position)*(k-1);
        end
    end
    fprintf('Molecular Weight of the species %s is %f.\n',Species_name ,mol_weight)

end