Project 1 - Parsing NASA thermodynamic data
PARSING NASA THERMODYNAMIC DATA
AIM: Parsing the NASA Thermodynamic data in MATLAB and find the molecular weight of each species.
OBJECTIVES:
NASA came up with a thermodynamic data which is used to evaluate the properties such as specific heat(cp), Enthalpy(H), Entropy(S).
To write a function extracting the 14 coefficients from the data file and calculating the specific heat, enthalpy and entropy of all species. In this The First 7 Coefficients are High Temperature Coefficients and the Second 7 Coefficients are Low Temperature Coefficients.
INTRODUCTION:
- Specific Heat:
Specific Heat is a ratio of the quantity of heat required to raise the temperature of a body one degree to that required to raise the temperature of an equal mass of water one degree. The SI unit of specific heat is J/KG-K.
- Enthalpy:
The Enthalpy of a Thermodynamic system is defined as the sum of its internal energy and the work required to achieve its pressure and volume. The SI unit of specific Enthalpy is kJ/kg.
- Entropy:
Entropy is a measure of degree of disorder Ness of the system. The SI unit of entropy is j/k.
Governing equations for specific heat, Enthalpy and Entropy:

Where
Cp --- Specific heat
H --- Enthalpy
S --- Entropy
R --- Universal Gas Constant (8.314J/mol K)
T --- Temperature
Function code for Specific Heat:
%Specific Heat Function Cp/R
function [c_p] = specific_heat(a1,a2,a3,a4,a5,a8,a9,a10,a11,a12,mid_temp,R,t)

% Comparing local temperature
% Minimum coefficient taken
if t<=mid_temp
    c_p = (a8+a9.*t+a10.*t.^2+a11.*t.^3+a12.*t.^4).*R;
else
    % Maximum coefficient taken
    c_p = (a1+a2.*t+a3.*t.^2+a4.*t.^3+a5.*t.^4).*R;
end
From the formula of cp and the above code it is observed that, Specific heat is a function of coefficients, universal gas constant and temperature. If loop is used because there is a condition that first 7 coefficients are high temperature coefficient and second 7 coefficients are low temperature coefficient.
Function code for Enthalpy:
%Enthalpy Function H
function [H] = enthalpy(a1,a2,a3,a4,a5,a6,a8,a9,a10,a11,a12,a13,R,t,mid_temp)

% Comparing local temperature
% Minimum coefficient taken
if t<=mid_temp
    H = (a8+(a9.*t./2)+(a10.*t.^2/3)+(a11.*t.^3/4)+(a12.*t.^4/5)+(a13./t)).*R.*t;
else
      % Maximum coefficient taken
    H =(a1+(a2.*t/2)+(a3.*t.^2/3)+(a4.*t.^3/4)+(a5.*t.^4/5)+(a6./t)).*R.*t;
end
From the formula of cp and the above code it is observed that, Enthaply is a function of coefficients, universal gas constant and temperature. If loop is used because there is a condition that first 7 coefficients are high temperature coefficient and second 7 coefficients are low temperature coefficient.
Function code for Entropy:
%Entropy Function S
function [S] = entropy(a1,a2,a3,a4,a5,a7,a8,a9,a10,a11,a12,a14,R,t,mid_temp)

% Comparing local temperature
% Minimum coefficient taken
if t<=mid_temp
    S = (a8*log(t)+a9.*t+(a10.*t.^2/2)+(a11.*t.^3/3)+(a12.*t.^4/4)+a14).*R;
else
    % Maximum coefficient taken
    S = (a1*log(t)+a2.*t+(a3.*t.^2/2)+(a4.*t.^3/3)+(a5.*t.^4/4)+a7).*R;
end
From the formula of cp and the above code it is observed that, Entropy is a function of coefficients, universal gas constant and temperature. If loop is used because there is a condition that first 7 coefficients are high temperature coefficient and second 7 coefficients are low temperature coefficient.
MAIN CODE:
clear all
close all
clc
f1 = fopen('THERMO.dat','r'); % Reading the Given source file using fopen and 'r' command

% Get heading of the file

heading = fgetl(f1); % Heading of file in page getting using fgetl  command

%Global temperature values

global_temp = fgetl(f1); %  Getting Global Temperature of species

x = strsplit(global_temp); % Splitting the global temperatures using stringsplit

global_low_temp = str2double(x{2}); % Assuming global-low temperature
global_mid_temp = str2double(x{3}); % Assuming global-mid temperature
global_high_temp = str2double(x{4}); % Assuming global-high temperature

% Skip the Three unwanted/Unusaul lines for coding
fgetl(f1)
fgetl(f1)
fgetl(f1)

% There are 53 species
% Using the for loop to perform code on all the species
for i = 1:53
    line1 = fgetl(f1);
    species_name = line1(1:6);

    % Local temperature with line of L

    local_temp1 =line1(49:55); % local temperature strings
    low_temp = str2double(local_temp1);  % local low-temperature converted to precised nums

    local_temp2 = line1(58:65); % local temperature strings
    high_temp = str2double(local_temp2); % local high-temperature converted to precised nums

    local_temp3 = line1(68:75); % local temperature strings
    mid_temp = str2double(local_temp3); % local mid-temperature converted to precised nums

    % Extracting the coefficient
    line2 = fgetl(f1); % Extracted line of L+1
    line3 = fgetl(f1); % Extracted line of L+2
    line4 = fgetl(f1); % Extracted line of L+3

    a = strfind(line2,'E');
    b = strfind(line3,'E');
    c = strfind(line4,'E');

    % Extracting coefficient of high temperature
    a1 = str2double(line2(1:a(1)+3));
    a2 = str2double(line2(a(1)+4:a(2)+3));
    a3 = str2double(line2(a(2)+4:a(3)+3));
    a4 = str2double(line2(a(3)+4:a(4)+3));
    a5 = str2double(line2(a(4)+4:a(5)+3));
    a6 = str2double(line3(1:b(1)+3));
    a7 = str2double(line3(b(1)+4:b(2)+3));

    % Extracting coefficient of low temp
    a8 = str2double(line3(b(2)+4:b(3)+3));
    a9 = str2double(line3(b(3)+4:b(4)+3));
    a10 = str2double(line3(b(4)+4:b(5)+3));
    a11 = str2double(line4(1:c(1)+3));
    a12 = str2double(line4(c(1)+4:c(2)+3));
    a13 = str2double(line4(c(2)+4:c(3)+3));
    a14 = str2double(line4(c(3)+4:c(4)+3));

    % Universal gas constant

    R = 8.314;
    t=linspace(low_temp,high_temp,500);


    % Calculating the specific heat

    c_p =  specific_heat(a1,a2,a3,a4,a5,a8,a9,a10,a11,a12,mid_temp,R,t);

    % Calculating the enthalpy

     H = enthalpy(a1,a2,a3,a4,a5,a6,a8,a9,a10,a11,a12,a13,R,t,mid_temp);

     % Calculating the entropy

     S = entropy(a1,a2,a3,a4,a5,a7,a8,a9,a10,a11,a12,a14,R,t,mid_temp);


% creating folder for species
data = strcat('properties of .....',species_name);
mkdir(data);
file = pwd;


% Plotting
figure(1)  % For Specific heat of species
plot(t,c_p,'LineWidth',2)
data1 = strcat(species_name,'temperature vs specific heat');
xlabel('Temperature')
ylabel('specific_heat')
title(species_name)
f = fullfile(data);
cd(f)
saveas(gcf,[pwd '/specific heat vs temperature .jpg'])
cd(file)

figure(2) % Enthalpy of Species
plot(t,H,'LineWidth',2)
data2 = strcat(species_name,'temperature vs enthalpy');
xlabel('Temperature')
ylabel('Enthalpy')
title(species_name)
cd(f);
saveas(gcf,[pwd '/enthalpy vs temperature .jpg'])
cd(file)

figure(3) % Entropy of Species
plot(t,S,'LineWidth',2)
data3 = strcat(species_name,'temperature vs entropy');
xlabel('Temperature')
ylabel('Entropy')
title(species_name);
cd(f);
saveas(gcf,[pwd '/entropy vs temperature .jpg'])
cd(file)

% Calculation of Molecular weight of species
molecular_weight_calc = molecular_weight(species_name);

k =sprintf('%s mol_wt = %f',species_name,molecular_weight_calc);
disp(k)
end

fclose(f1)
Stepes for buinding the program:
Initially we need to locate the THERMO.dat file to the actual location of creation of code. To open the file in MATLAB we use the “fopen” command and to read the file we use the sentence as fopen(THERMO.dat, ‘r’) here r represents the reading the file.
Then we use the “fgetl” command to skip the line without allowing them to into the actual code required. Here we skip the first five line of the file which are not needed for calculation.
Now using FOR loop we can calculate the each species in the file and before that we have to consider the temperature as local temperatures which are shown in main code.
As per main code we need to we need to convert the strings to number/numeric by using “str2num/str2double”, here str2double will provide double precision value of string. And we used the “strfind” command to locate the E or string between the values, with that we can convert the values of species.
Then using those commands extract the species in separate manner and calculate them with universal Gas constant (R).
Create a function for specific heat cp, Enthalpy H and Entropy S. which are presents the formula for calculating the cp, H, S for each species.
Then create a folder to store them and to ease the finding the plot of species.
Plot the Temperature vs Cp, Temperature vs H and Temperature vs S.
Create the function for Molecular weight of each species with some of commands like strcmp and allow it into main code and close the program with help of fclose(file) command.
Function for Molecular Weight:
%Molecular weight Function MW

function [MW] = molecular_weight(species_name)
elements = ['H', 'C', 'N', 'O', 'A'];

atomic_weight = [1 12 14 16 40];

MW = 0;

for i = 1:length(species_name)
    for j = 1:length(elements)

        if strcmp(species_name(i),elements(j))==1
           MW = atomic_weight(j) + MW;
           atomicweight = atomic_weight(j);
        end

    end

    n = str2num(species_name(i));

    if n>1
       MW = atomicweight*(n-1) + MW;
    end

end
end
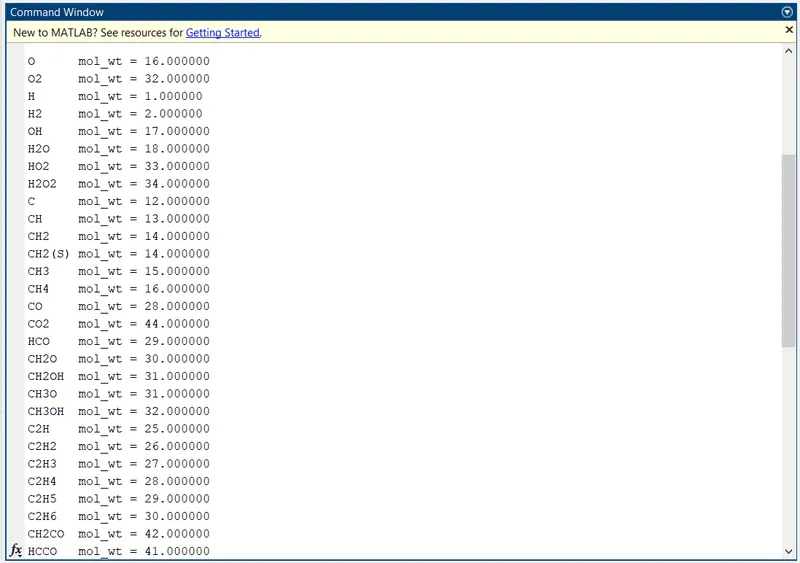
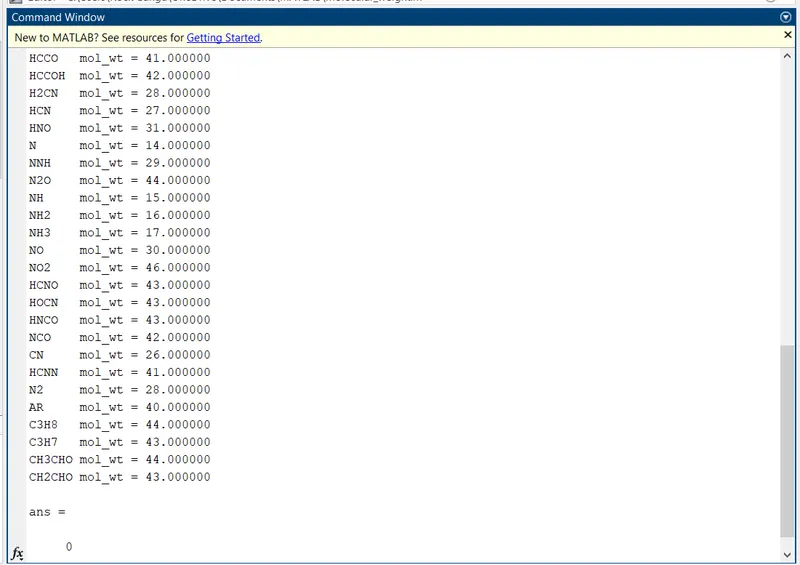
We used the mainly 5 species such as oxygen, Hydrogen, Carbon, Nitrogen, Argon and symbols of these species is stored in array called elements and its corresponding atomic mass is stored in atomic mass array.
FOR loop is initiated because the process is repeated for every species. strcmp command is used to compare the string character of species name and corresponding elements and molecular weight is calculated using the formula mol wt = mol wt + atomic mass. If there is a repetition of species then if loop is initiated and molecular weight is calculated as per program.
The molecular weight fifferent species:
The property file generated for each species:

Plot for species:
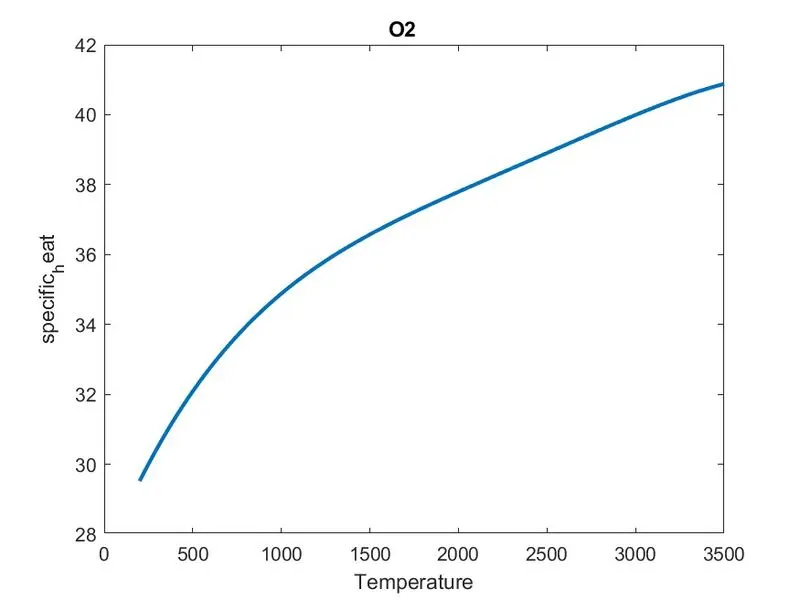
Specific heat vs Temperature plot for O2:
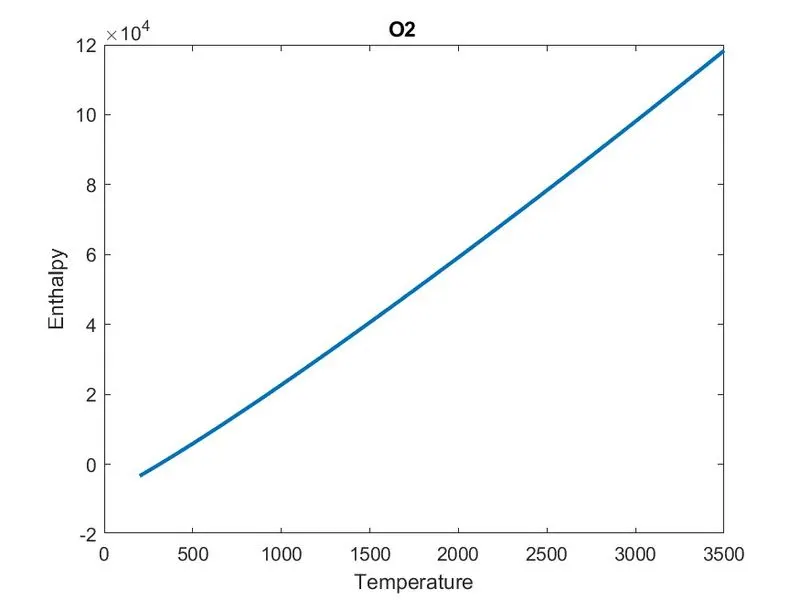
Enthalpy vs Temperature plot for O2:
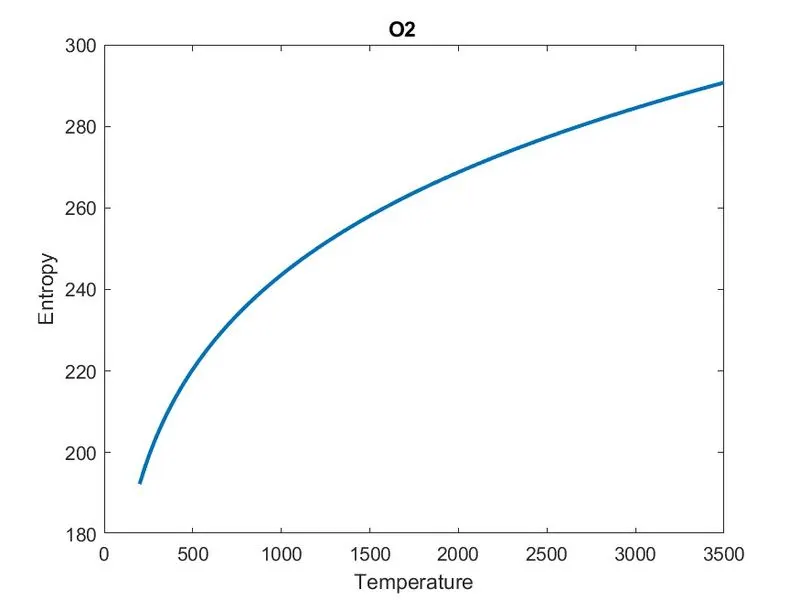
Entropy vs Temperature:
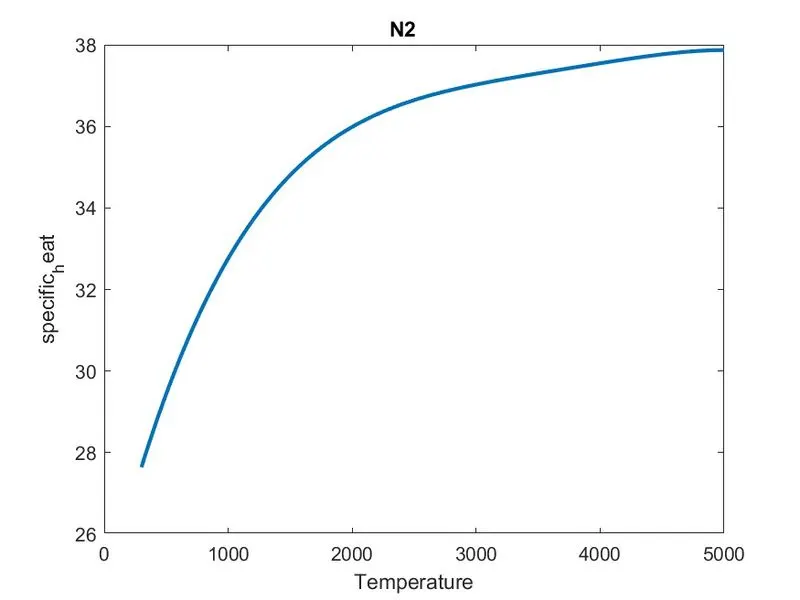
Specific heat vs Temperature plot for N2:
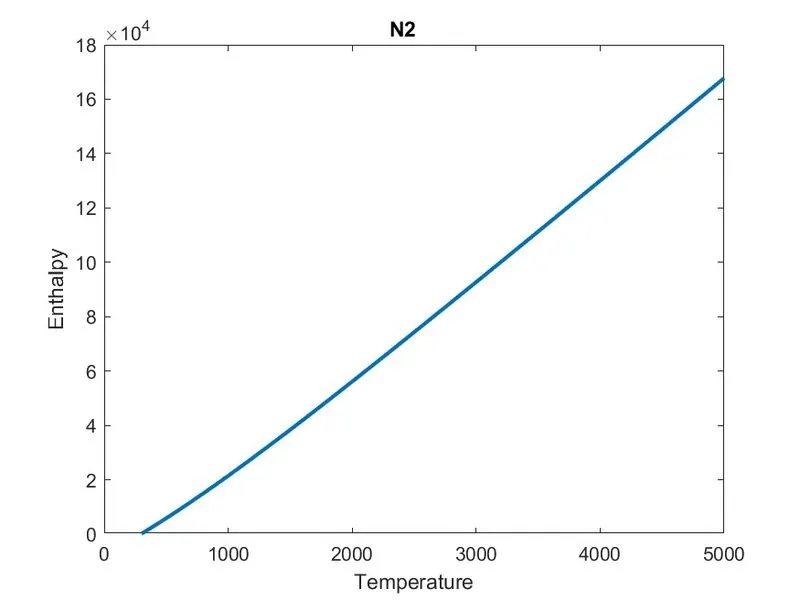
Enthalpy vs Temperature plot for N2:
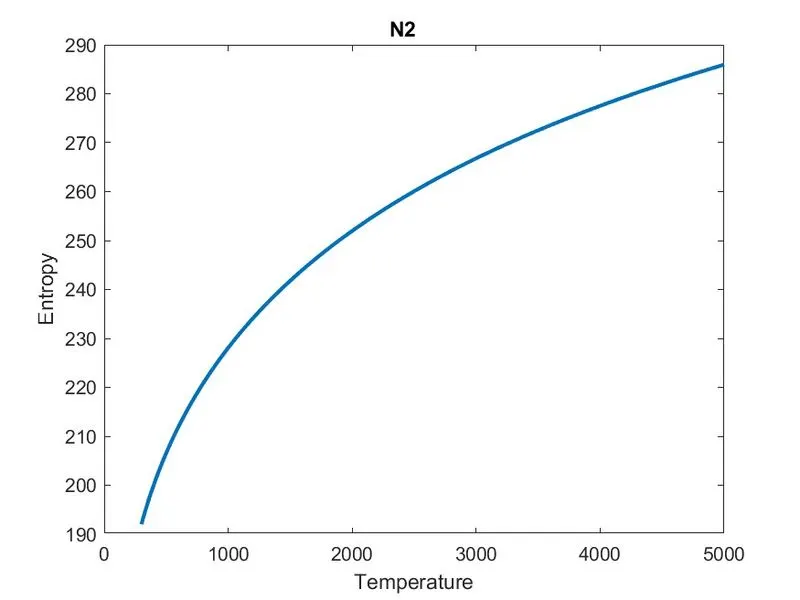
Entropy vs Temperature plot for N2:
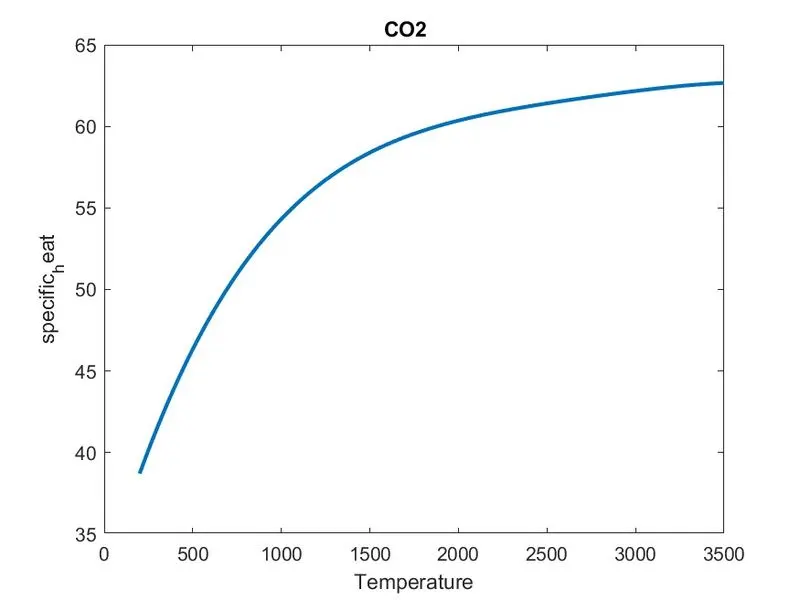
Specific heat vs Temperature plot for CO2:
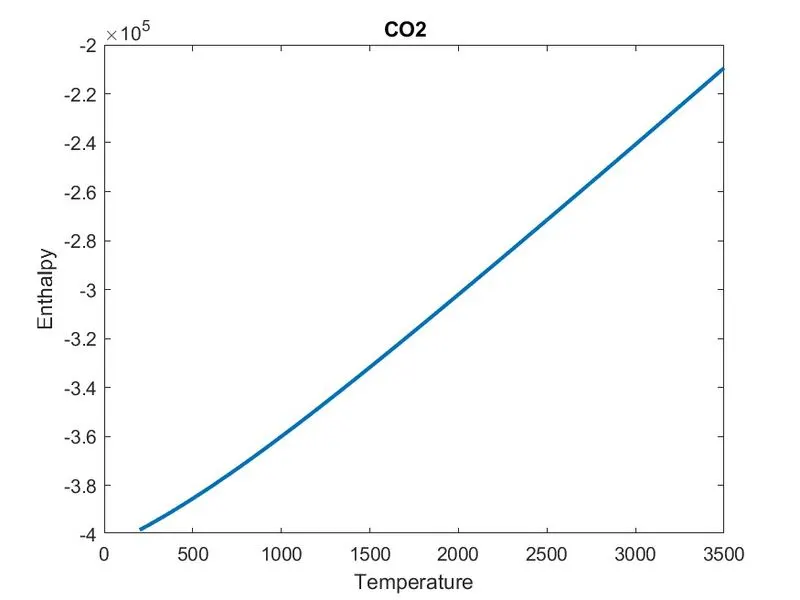
Enthalpy vs Temperature plot for CO2:
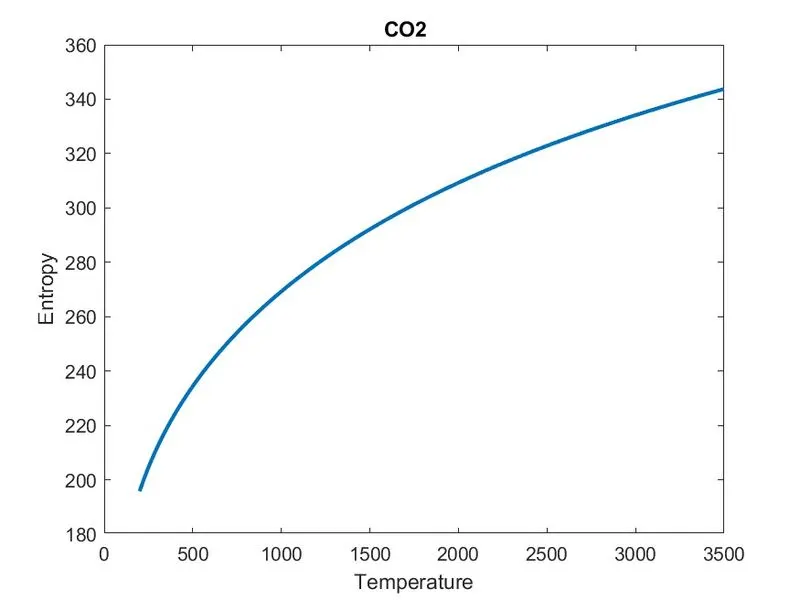
Entropy vs Temperature plot for CO2:
CONCLUSION:
The data has been extracted and thermodynamic property such as specific heat, Enthalpy, Entropy is calculated and graphs were generated in separate folder of each species.