Project 1 - Parsing NASA thermodynamic data
AIM
To write a function that extracts the 14 co-efficients and to calculate the enthalpy, entropy and specific heats for all the species in the given NASA data file. And to calculate the molecular weight of each species and display it in the command window. And to plot the Cp, Enthalpy and Entropy for the local temperature range specific for each species given in the data file
OBJECTIVE
Main objective of this project is to read the given NASA data file and to get the 14 coefficients for each species and to calculate the Specific heat, Enthalpy, Entropy with referring to the below formula. And to plot graphs of Cp,h,s vs temperature for each specimens and to save it in their alloted files.
Formula
Function program for calculating Entropy
function [S] = entropy_S(x1,x2,x3,x4,x5,x7,x8,x9,x10,x11,x12,x14,tmid,temp,R);

% first 7 coefficent is high temperature and  next 7 are low temperature
% coefficent

if (temp<=tmid)

    S = (x8*log(temp)+(x9*(temp)+(x10*(temp.^2)/2)+(x11*(temp.^3)/3)+(x12*(temp.^4)/4)+(x14)))*R
else
    S = (x1*log(temp)+(x2*(temp)+(x3*(temp.^2)/2)+(x4*(temp.^3)/3)+(x5*(temp.^5)/5)+(x7)))*R
end
end
Function program for calculating Specific heat,
function [cp] = specific_heat(x1,x2,x3,x4,x5,x8,x9,x10,x11,x12,tmid,temp,R)

% first 7 coefficent are high temperature and second 7 coefficent are low
% temperature

if (temp<=tmid)
    cp=R*(x8+(x9*(temp))+(x10*(temp.^2))+(x11*(temp.^3))+(x12*(temp.^4)));
else
    cp=R*(x1+(x2*(temp))+(x3*(temp.^2))+(x4*(temp.^3))+(x5*(temp.^4)));
end
end
Function program for calculating Molecular weight
% function to calculate molicular mass
function mw = mol_wt(sp_name)

%storing value

compound_name =(sp_name);

%creating an array of element

elm_at=['C','H','O','N','A'];

%storing automatic mass value of array
value_at = [12.0107 1.00794 15.994 14.0067 39.948]

%assuming molicular mass is 0
mw = 0

%creating loop
for i=1:length(compound_name);
    for j=1:length(elm_at);

        %comparing srtring value
        if strcmp(compound_name(i),elm_at(j))

            %if above comparision is ture, value of molicular mass is
            %calculated
            mw = mw+value_at(j)

            %storing the position of further use
            pos = j
        end
    end

    % cunverting string to number

    k = str2num(compound_name(i));

    %comparing the value of k is greater than executed , further statement

    if (k>1)

        % molicular mass calculation
        mw = mw+value_at(pos)*(k-1);
    end
end


% command to print the molcular mass at molecule

fprintf('molicular weight of species %s is %f',compound_name,mw)
end
NEW COMMANDS LEARNED IN THIS PROGRAM
- fopen : This command is used to open the file and here 'r' is used to read the data file.
- fgetl : This command is used to get the lines from the data file.
- strsplit : This command is used to split the group of words into seperate words.
- str2num : Thsi command is used to convert the string into numbers for further operations.
- strfind : This command is used to find a letter in the line.
- mkdir : This command is used to make a new folder.
- saveas : This command here is used to save the plots as images
main program
clear all
close all
clc

f1 = fopen('THERMO (1).dat','r');
% skipping next 5 line
for i= 1:5
    fgetl(f1);
end

%storting starts

for i = 1:53

    %creating an array species
    tline = fgetl(f1)
    A = strsplit(tline,' ');

    %species
   species = A{1}

    %local temperature
    tlow = str2num(A{end-3});
    thigh = str2num(A{end-2});
    tmid = str2num(A{end-1});

    T = linspace(tlow,thigh,500)
    %finding coefficent
    %line 1
    tline1 =fgetl(f1)
    pos1 = findstr(tline1,'E');

    %high coefficent
    a1 = str2num(tline1(1:pos1(1)+3));
    a2 = str2num(tline1(pos1(1)+4:pos1(2)+3));
    a3 = str2num(tline1(pos1(2)+4:pos1(3)+3));
    a4 = str2num(tline1(pos1(3)+4:pos1(4)+3));
    a5 = str2num(tline1(pos1(4)+4:pos1(5)+3));

    %line2
    tline2 = fgetl(f1)
    pos2 = findstr(tline2,'E');
    a6 = str2num(tline2(1:pos2(1)+3));
    a7 = str2num(tline2(pos2(1)+4:pos2(2)+3));

    %lower coefficent
    a8 = str2num(tline2(pos2(2)+4:pos2(3)+3));
    a9 = str2num(tline2(pos2(3)+4:pos2(4)+3));
    a10 = str2num(tline2(pos2(4)+4:pos2(5)+3));

    % line3
    tline3 = fgetl(f1)
    pos3 = findstr(tline3,'E');
    a11 = str2num(tline3(1:pos3(1)+3));
    a12 = str2num(tline3(pos3(1)+4:pos3(2)+3));
    a13 = str2num(tline3(pos3(2)+4:pos3(3)+3));
    a14 = str2num(tline3(pos3(3)+4:pos3(4)+3));
  R = 8.314
    % specific heat
       cp = specific_heat(a1,a2,a3,a4,a5,a8,a9,a10,a11,a12,tmid,T,R);
    % entopy
       S = entropy_S(a1,a2,a3,a4,a5,a7,a8,a9,a10,a11,a12,a14,tmid,T,R);
    % enthalpy
       H = enthalpy_H(a1,a2,a3,a4,a5,a6,a8,a9,a10,a11,a12,a13,tmid,T,R);

   mkdir(species)
   cd(species)

       figure(1)
       plot(T,cp)
       xlabel('temperature')
       ylabel('specific_heat')
       title('specific_heat vs temperature of',sprintf('%s',species));
       saveas(figure(1),'cp vs T.jpg')

        figure(2)
       plot(T,S)
       xlabel('temperature')
       ylabel('entropy')
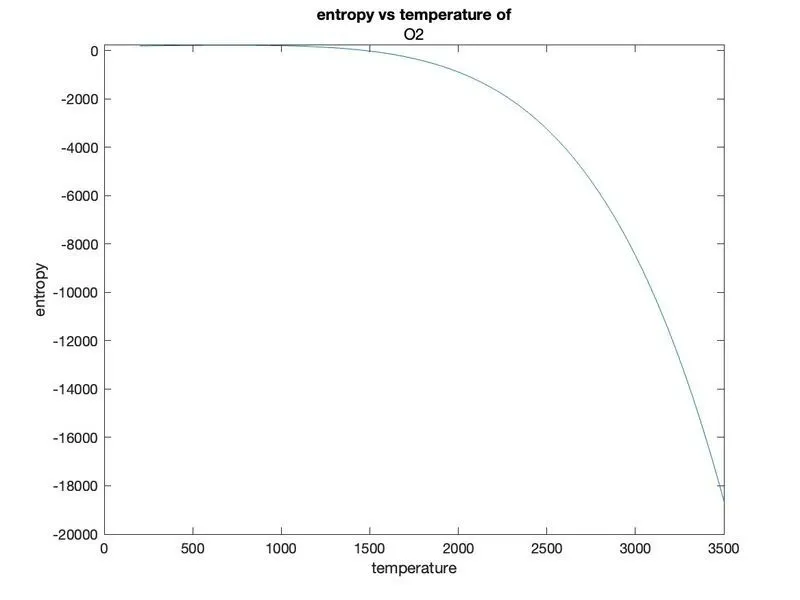
       title('entropy vs temperature of',sprintf('%s',species));
       saveas(figure(2),'S vs T.jpg')

         figure(3)
       plot(T,H)
       xlabel('temperature')
       ylabel('enthalpy')
       title('enthalpy vs temperature of',sprintf('%s',species));
       saveas(figure(3),'H vs T.jpg')
      % comming back to program directory

       cd ..

       % calculat molicular weight of species
       M = molecular_weight(species);
end
Procedure for main function:
- Create a function that accepts species name as input and that gives molecular weight as output.
- Create an outer loop with 'i' as index of the species variable
- Initialize variables to store molecular weight 'mw' with 0
- Create an inner loop with 'j' as index for the species name string with values up to the length of the name.
- Open the 'THERMO' file in read mode.
- Skip the first line and store the next line in the str variable using fgetl().
- Use while loop to jump to the lines of data file sequentially until end-of-file is encountered.
- Split the array line into different blocks of cell array using strsplit function.
- Use if condition with contains() to find if the compound name is same as that of first cell array element. If it is true, then the species block is reached and break the loop. If it is false, then move to the next line.
- The second, third and fourth line of the species block store the values of the coefficients. Hence create for loop for 3 iterations. The iterating element 'j' also serves for the indexing of coefficient variable 'a'.
Governing the equation :-
% specific heat
cp = specific_heat(a1,a2,a3,a4,a5,a8,a9,a10,a11,a12,tmid,T,R);
% entopy
S = entropy_S(a1,a2,a3,a4,a5,a7,a8,a9,a10,a11,a12,a14,tmid,T,R);
% enthalpy
H = enthalpy_H(a1,a2,a3,a4,a5,a6,a8,a9,a10,a11,a12,a13,tmid,T,R);
We creat the function of enthalpy and entropy and specific heat of co efficent
And combain the equation on main program it was used to make a plot
Objective of the project :-
The main objective of the project is to creat the temperature to given species
It was use to sea the individual temperature of entropy enthalpy and the specific heat vs temperature in each species
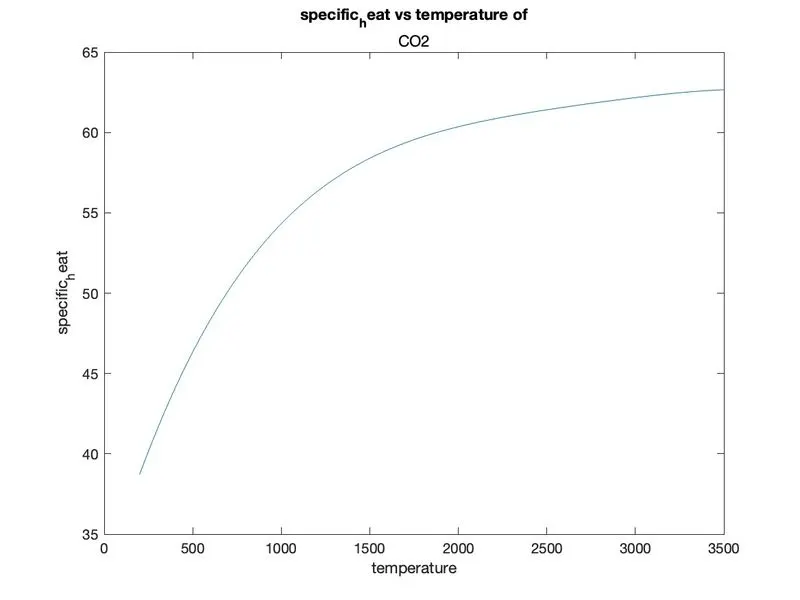
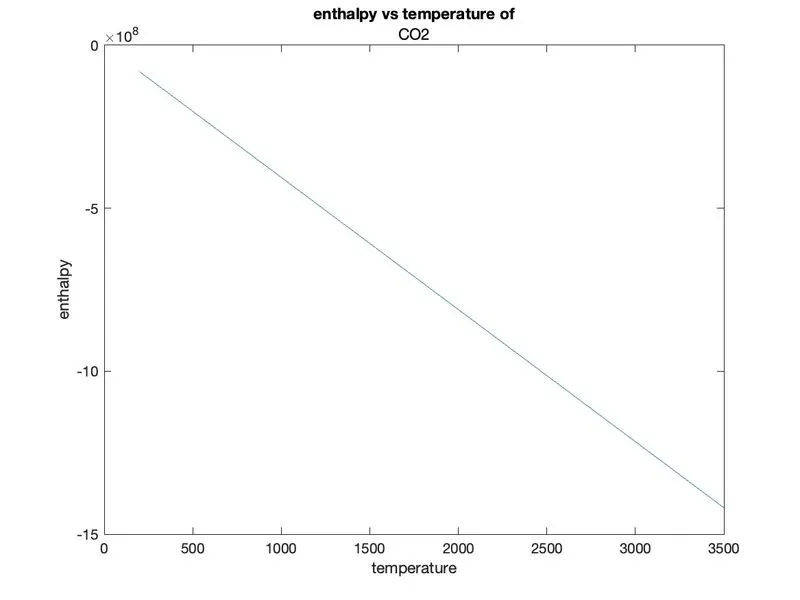
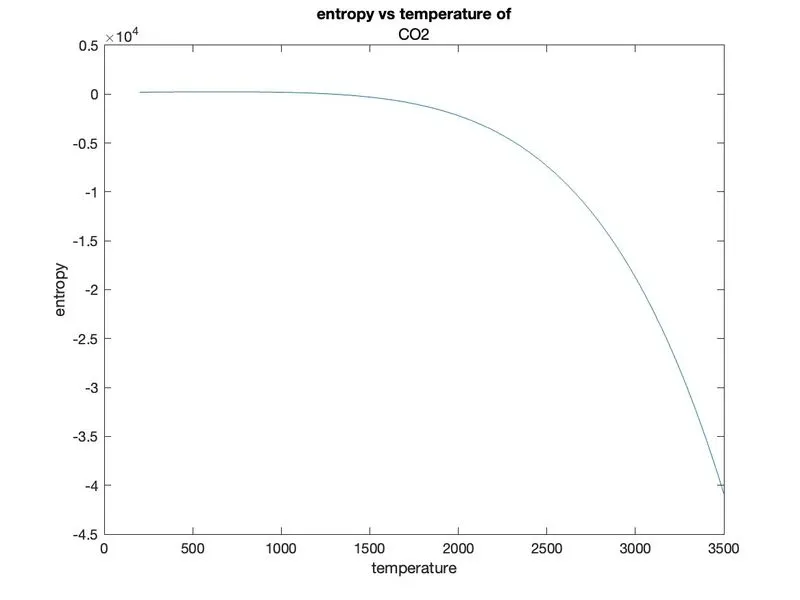
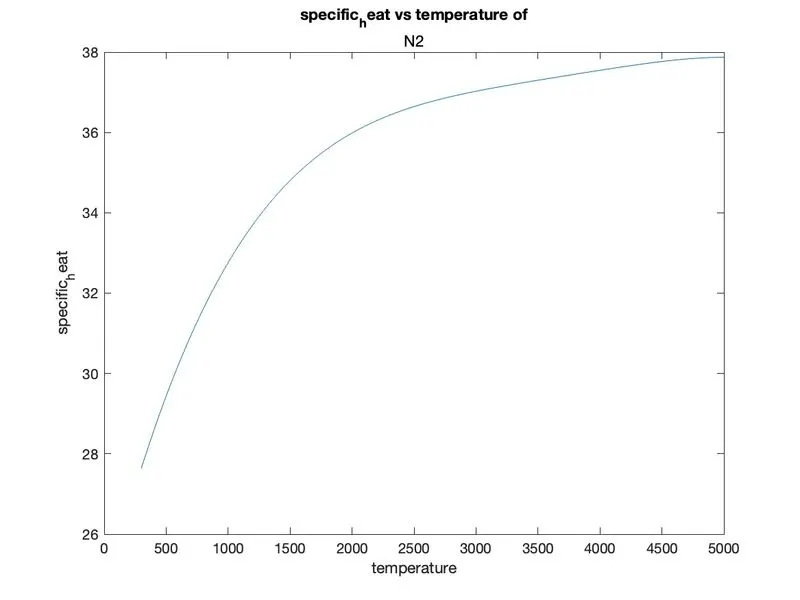
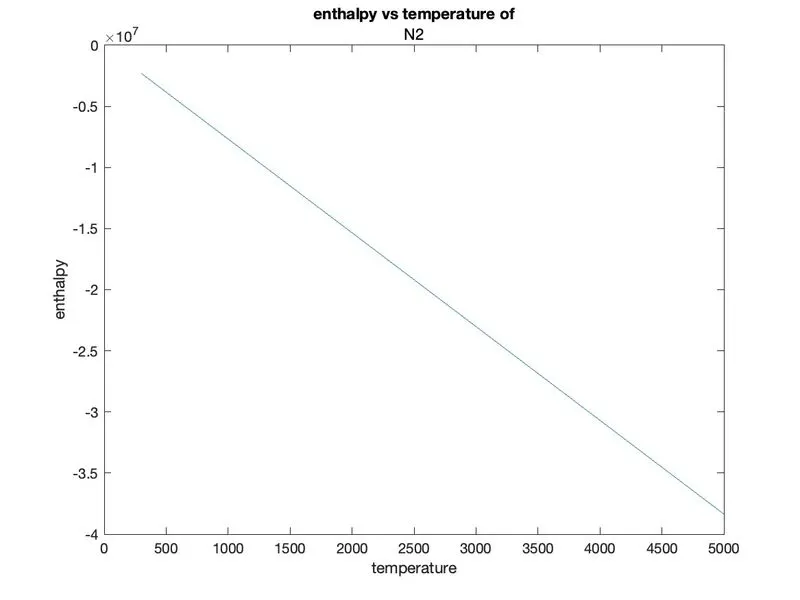
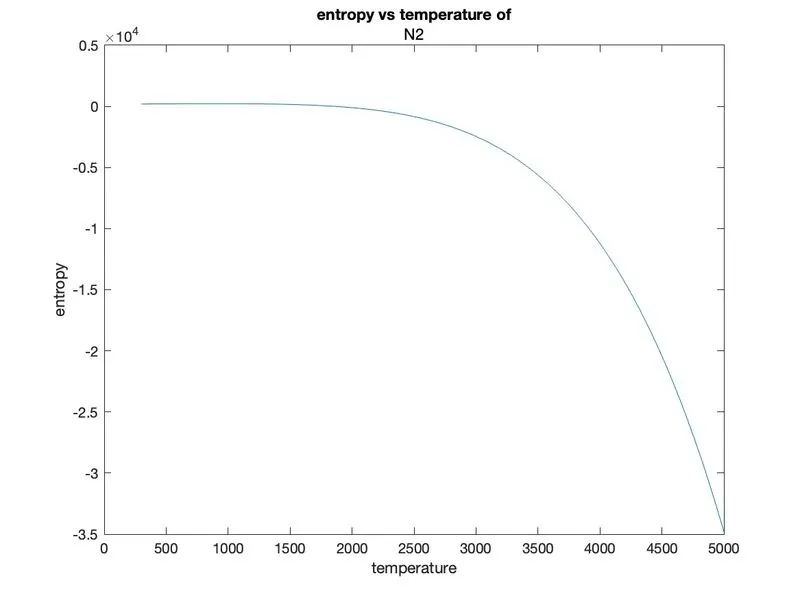
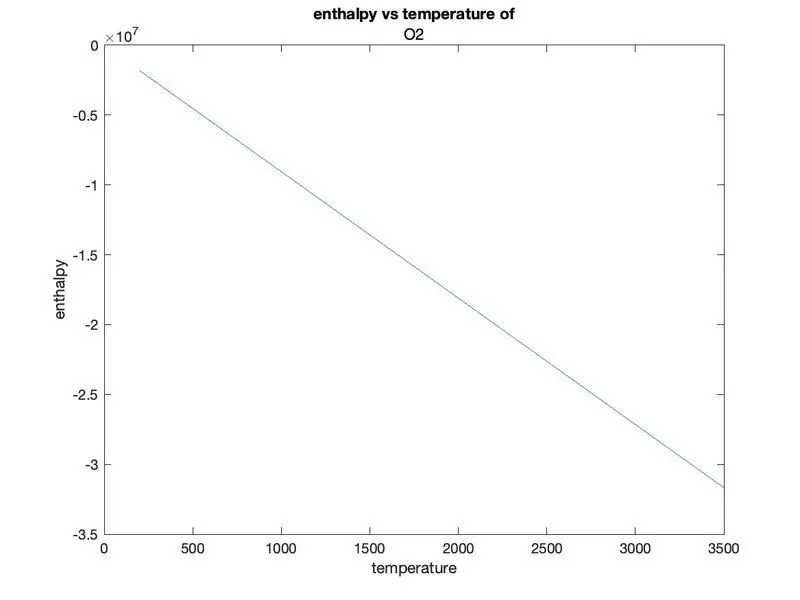
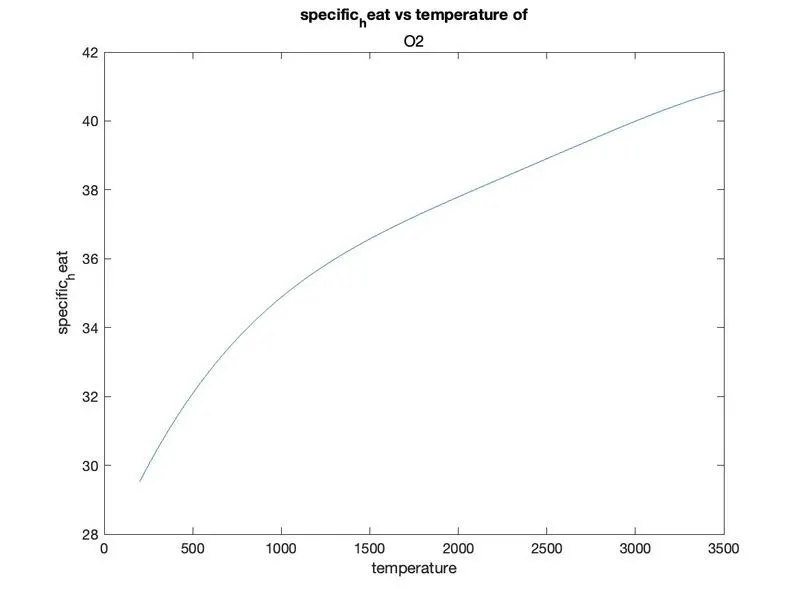
For example we can take co2 o2 and n2 species and show the plot
Body of contant :-
* In case of programming project :-
It was use matlab programming languvage
First we read the file and let we assume tha f1
We are ommite the first 5 line on termodynamic data table
And it creating array species for using for loop command
We found local temp ,tlow = str2num(A{end-3}); thigh = str2num(A{end-2}); tmid = str2num(A{end-1});
Let we assume tha temp(T) at linspace(tlow,thigh, 500)
Now we finding coefficent of temperature at line1
* In case of simulation project :-
Now we found local temp on thermodynamic data at a1 to a14
a1 = str2num(tline1(1:pos1(1)+3)); a2 = str2num(tline1(pos1(1)+4:pos1(2)+3)); a3 = str2num(tline1(pos1(2)+4:pos1(3)+3)); a4 = str2num(tline1(pos1(3)+4:pos1(4)+3));
a5 = str2num(tline1(pos1(4)+4:pos1(5)+3));
At the same time a6 to a14 of same prosidure
R = 8.314
% specific heat
cp = specific_heat(a1,a2,a3,a4,a5,a8,a9,a10,a11,a12,tmid,T,R);
% entopy
S = entropy_S(a1,a2,a3,a4,a5,a7,a8,a9,a10,a11,a12,a14,tmid,T,R);
% enthalpy
H = enthalpy_H(a1,a2,a3,a4,a5,a6,a8,a9,a10,a11,a12,a13,tmid,T,R);
It will be consider the function of entropy and enthalpy and specific heat and fainlly we calculate the molicular weight
The molicular weight assume to create the specice
* In caseof design project :-
We create the Mkdir and cd species of the temp
Let we found figure1 and figure2 and figure3
It will be plotting over all 3 species like cp. and H and S
First plot(Cp,T) second plot (H,T) third plot(S,T) finally we creat xlabel and ylabel and title
Finally can create saveas(figure(1),'cp vs T.jpg') and saveas(figure(2),'H vs T.jpg') and saveas(figure(3),'S vs T.jpg'
And attach the function of molicular weight of temp its M = molecular_weight(species);
Conclution :-
At the end of tha project to find the cp H and S species of the temp can be plotted on matlab sucessful.
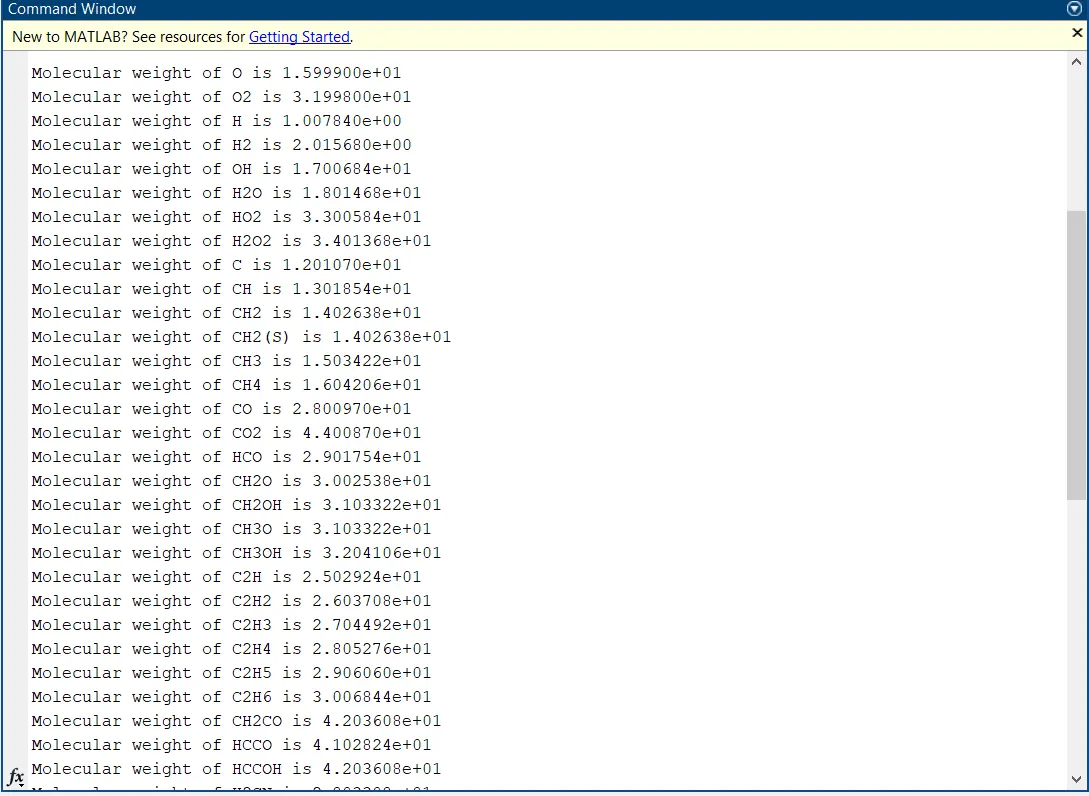
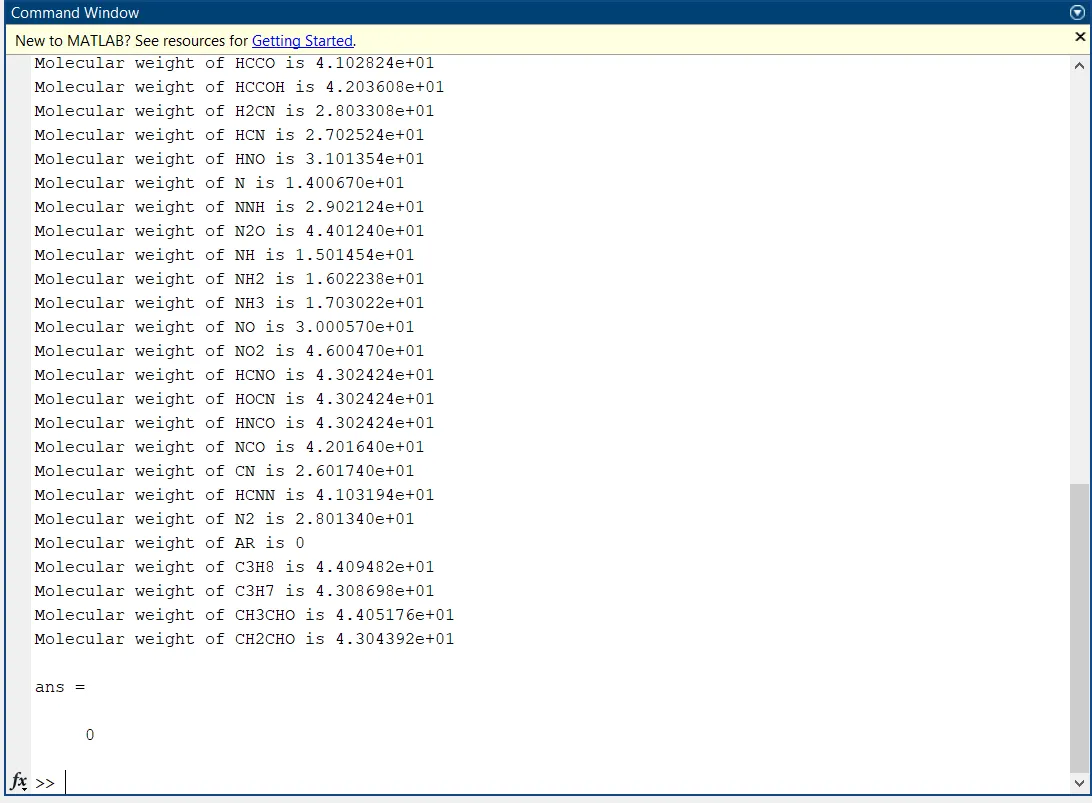
Snapshot of command window displaying the molecular weight of the all 53 species
Snapshot of command window displaying the molecular weight of the all 53 species
RESULTS AND CONCLUSION
A function that extracts the 14 co-efficients is written and the enthalpy, entropy and specific heats for all the species in the given NASA data file are calculated. And the molecular weight of each species are calculated and displayed it in the command window. The Cp, Enthalpy and Entropy for the local temperature range specific for each species given in the data file were plotted. These graphs for specific species are saved as images.