Project 1 - Parsing NASA thermodynamic data
Screenrecording of the matlab window is uploded.
clear
close
clc

f=fopen('THERMO.dat','r');

for i=1:5
    fgetl(f);
end
for j=1:53
    %extraction of local temperature
    a=fgetl(f);

    b=strsplit(a,' ');
    z=length(b);
    species_name=b{1};
    local_low=str2num(b{z-3});
    local_high=str2num(b{z-2});
    local_mid=str2num(b{z-1});

    %extraction of co efficients

    coeff_line1 =fgetl(f);

    pos_e = strfind(coeff_line1,'E');

    a1 = str2num(coeff_line1(1:pos_e(1)+3));
    a2 = str2num(coeff_line1(pos_e(1)+4:pos_e(2)+3));
    a3 = str2num(coeff_line1(pos_e(2)+4:pos_e(3)+3));
    a4 = str2num(coeff_line1(pos_e(3)+4:pos_e(4)+3));
    a5 = str2num(coeff_line1(pos_e(4)+4:pos_e(5)+3));

    coeff_line2 =fgetl(f);

    pos_e1 = strfind(coeff_line2,'E');

    a6 = str2num(coeff_line2(1:pos_e1(1)+3));
    a7 = str2num(coeff_line2(pos_e1(1)+4:pos_e(2)+3));
    a8 = str2num(coeff_line2(pos_e1(2)+4:pos_e(3)+3));
    a9 = str2num(coeff_line2(pos_e1(3)+4:pos_e(4)+3));
    a10 = str2num(coeff_line2(pos_e1(4)+4:pos_e(5)+3));

    coeff_line3 =fgetl(f);

    pos_e2 = strfind(coeff_line3,'E');

    a11 = str2num(coeff_line3(1:pos_e2(1)+3));
    a12= str2num(coeff_line3(pos_e2(1)+4:pos_e(2)+3));
    a13= str2num(coeff_line3(pos_e2(2)+4:pos_e(3)+3));
    a14= str2num(coeff_line3(pos_e2(3)+4:pos_e(4)+3));

    %calculation of cp, h, s

    T = linspace(local_low,local_high,10);

    for i=1:length(T)

        if (T(i)<=local_mid)
            ltr(i)=T(i);

        elseif (T(i)>local_mid)
            htr(i)=T(i);

        end
    end

    LTR=ltr;
    d=length(LTR);
    HTR=htr(d+1:length(T));


    %calculation of cp,h,s

    R = 8.3144598; %universal gas constant

    %High temperature coefficients
    cp1=R*(a1+(a2*HTR)+(a3*(HTR).^2)+(a4*(HTR).^3)+(a5*(HTR).^4));
    H1=R*((a1*HTR)+((a2*(HTR).^2)/2)+((a3*(HTR).^3)/3)+((a4*(HTR).^4)/4)+((a5*(HTR).^5)/5)+a6);
    S1=R*(a1.*log(HTR)+(a2*HTR)+((a3*(HTR).^2)/2)+((a4*(HTR).^3)/3)+((a5*(HTR).^4)/5)+a7);

    %Low temperature coefficients
    cp2=R*(a8+(a9*LTR)+(a10*(LTR).^2)+(a11*(LTR).^3)+(a12*(LTR).^4));
    H2=R*((a8*LTR)+((a9*(LTR).^2)/2)+((a10*(LTR).^3)/3)+((a11*(LTR).^4)/4)+((a12*(LTR).^5)/5)+a13);
    S2=R*(a8.*log(LTR)+(a9*LTR)+((a10*(LTR).^2)/2)+((a11*(LTR).^3)/3)+((a12*(LTR).^4)/4));

    Cp = [cp1,cp2];
    H = [H1,H2];
    S = [S1,S2];

    %claculating molecular weight
     mwt=0;
    Elements=['H' 'C' 'O' 'N' 'A'];
    Atomic_weight =[1 12 16 14 40];
    for  i=1:length(species_name)
        for   j=1:length(Elements)
            if strcmpi(species_name(i),Elements(j))
                mwt = mwt +Atomic_weight(j);
                pos = j;

            end
        end
        num = str2num(species_name(i));
        if(num)
            mwt = mwt + (num-1)*Atomic_weight(pos)
        end
    end

        mkdir(species_name)
        cd(species_name)

        %plotting T vs cp
        figure(1)
        plot(T,Cp,'linewidth',5,'color','r')
        xlabel('Temperature(T)')
        ylabel('Specific heat(cp)')
        grid on
        title('Temperature vs Specific heat')
        saveas(figure(1),'Specific heat.jpg')

        %Plotting T vs H
        figure(2)
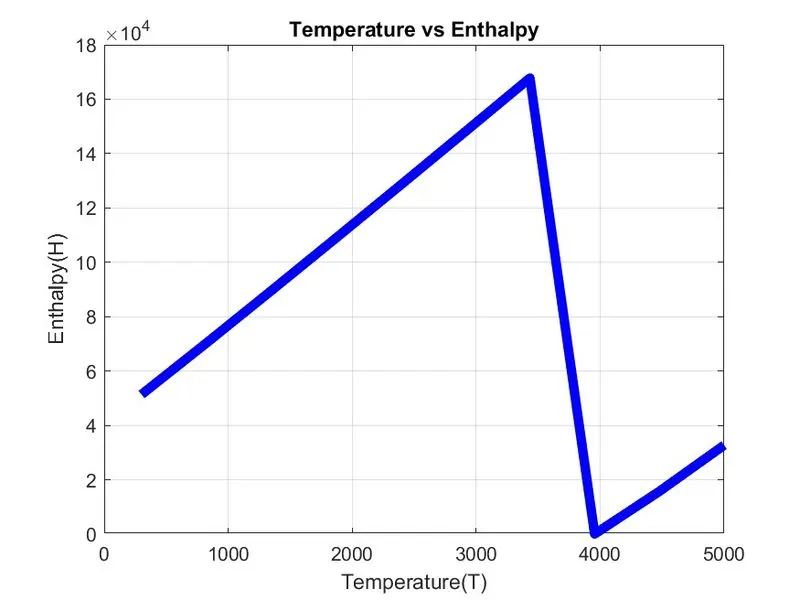
        plot(T,H,'linewidth',5,'color','b')
        xlabel('Temperature(T)')
        ylabel('Enthalpy(H)')
        grid on
        title('Temperature vs Enthalpy')
        saveas(figure(2),'Enthalpy.jpg')

        %Plotting T vs S
        figure(3)
        plot(T,S,'linewidth',5,'color','y')
        xlabel('Temperature(T)')
        ylabel('Entropy(S)')
        grid on
        title('Temperature vs Entropy')
        saveas(figure(3),'Entropy.jpg')
        cd ..

end
MOLECULAR WEIGHT(mwt)=
mwt =
32
mwt =
2
mwt =
2
mwt =
33
mwt =
2
mwt =
34
mwt =
14
mwt =
14
mwt =
15
mwt =
16
mwt =
44
mwt =
14
mwt =
14
mwt =
15
mwt =
15
mwt =
24
mwt =
24
mwt =
26
mwt =
24
mwt =
27
mwt =
24
mwt =
28
mwt =
24
mwt =
29
mwt =
24
mwt =
30
mwt =
14
mwt =
2
mwt =
28
mwt =
16
mwt =
17
mwt =
46
mwt =
28
mwt =
36
mwt =
44
mwt =
36
mwt =
43
mwt =
15
mwt =
14
STEPWISE EXPLANATION
The fist step in the code clears all the previously stored data on the command window.
The ‘fopen’ command opens the ‘THERMO.dat’ file and ‘r’ here indicated the ‘read only’ command.
We use ‘fgetl’ command to read the data file line by line.
Different temperature values are assigned to read the 53 gases mentioned in the data file we use for loop then we further read the lines in the file using fgetl command.
When all the global and local temperatures are read we call functions which are written to calculate molecular weight, specific heat(Cp),enthalpy(H),Entropy(s).
Calculating the value of Cp,H & S for local temperature range. Initial values of Cp, H & S are defined as zero, Plotting the graphs & saving them in the folder. It is standard procedure to store in file in specific location, by using many commands (pwd, mkdir, cd, saveas) written in this program.
We are using formulae to calculate Cp, H & S. We are using for loop to calculate each value at local temperature range. We are also using if & else command to use low & high temperature coefficient as per average temperature. If Temperature is less than average temperature then use low temperature co-efficient & If Temperature is more than average temperature then use hign temperature co-efficient
Molecular weight is calculated.
EROORS
No errors occured
O2
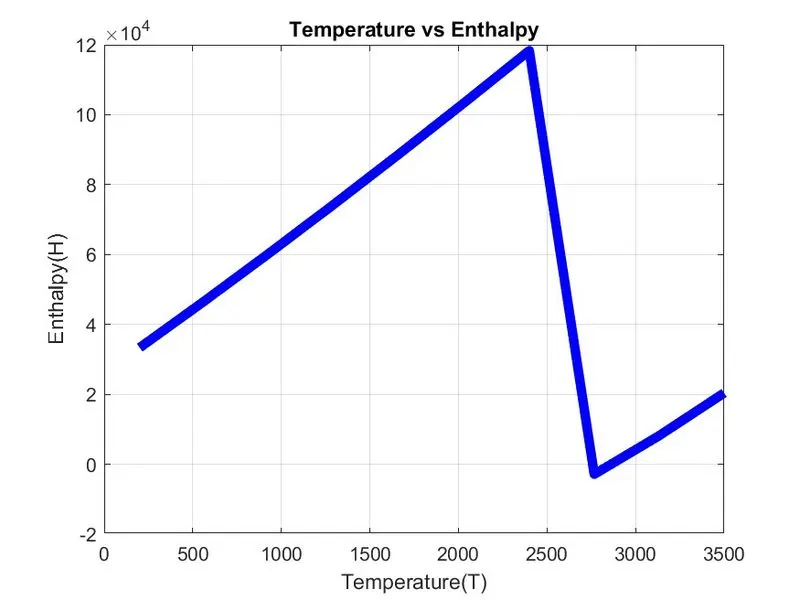
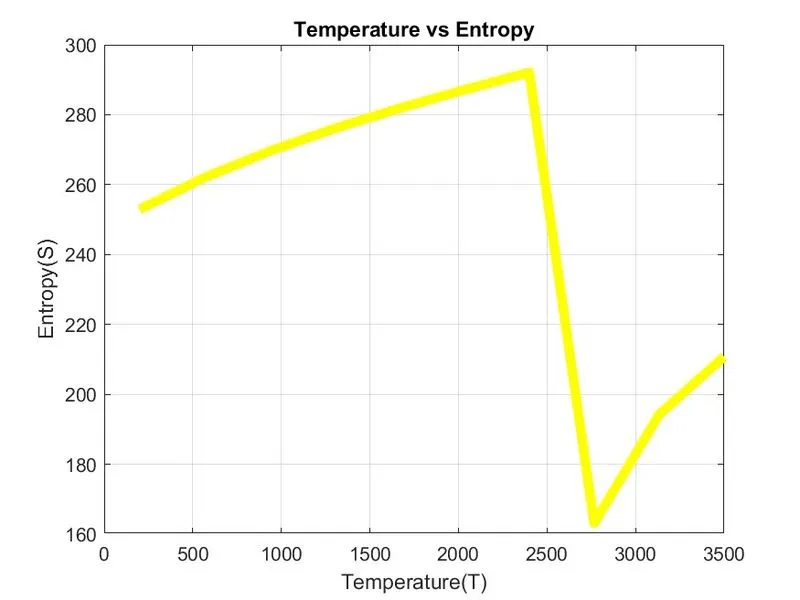
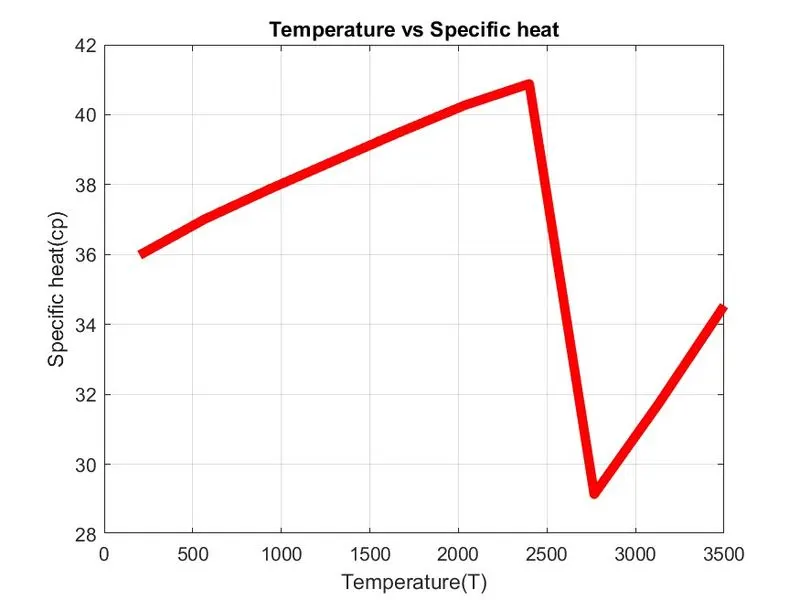
N2
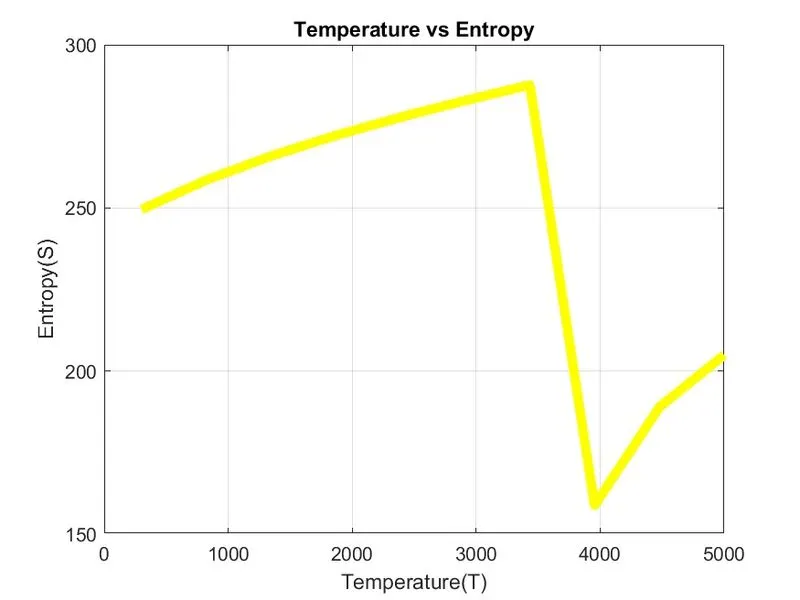
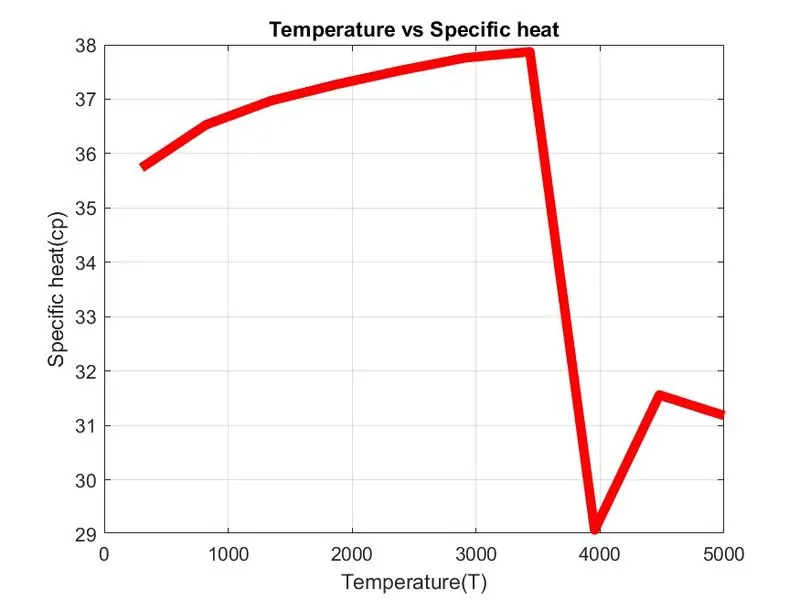
CO2
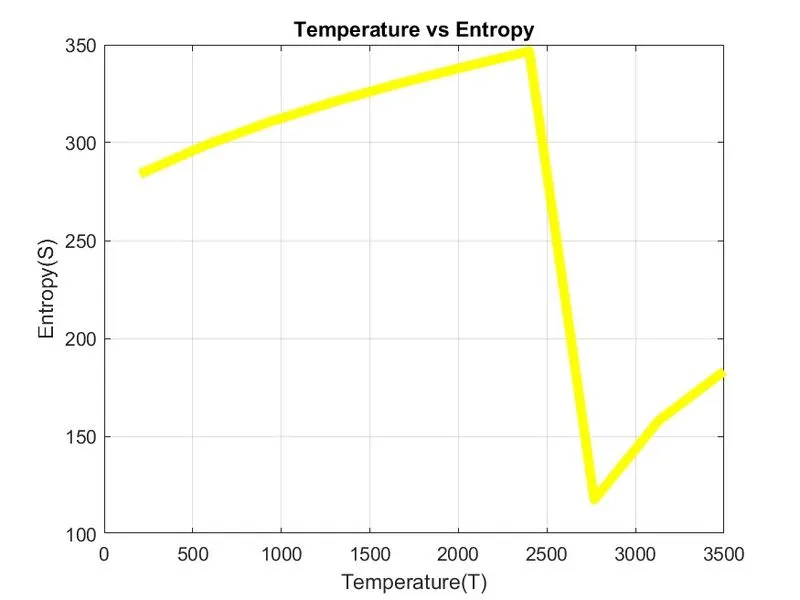
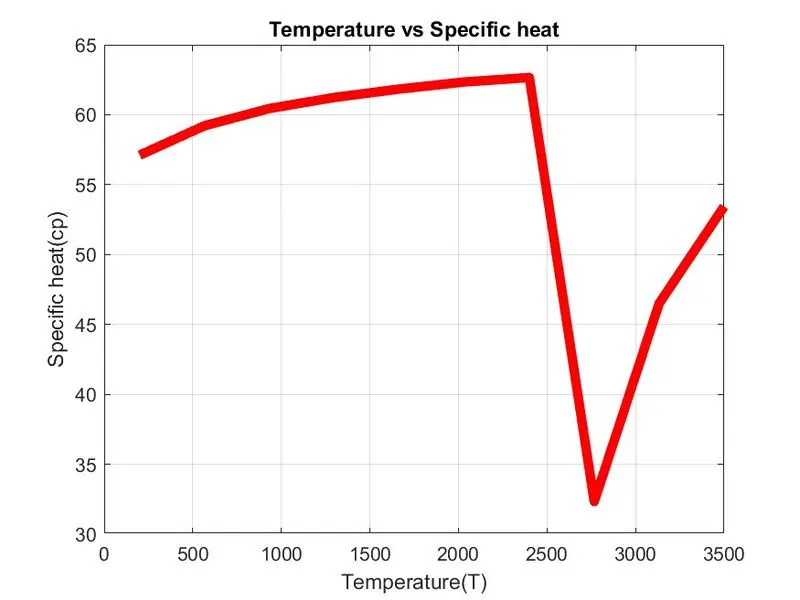
FOLDERS