Project 1 - Parsing NASA thermodynamic data
Aim - To write a code in MATLAB to parse nasa thermodynamic data file and then calculate thermodynamic properties of various gas species.
Objective -
- Write a function that extracts the 14 coefficients and calculates the enthalpy,entropy and specific heats for all the species in the data file.
- Calculating molecular weight of each species and disply in comment box.
- Plotting the specific heat,enthalpy and entropy for the local temperature range.
- Saving the plots as images with appropriate names and dumping them in seperate folders for each species.
Theory -
File parsing -
Parse essentially means to ''resolve (a sentence) into its component parts and describe their syntactic roles''. In computing, parsing is 'an act of parsing a string or a text'. [Google Dictionary]File parsing in computer language means to give a meaning to the characters of a text file as per the formal grammar. ''Within computational linguistics the term is used to refer to the formal analysis by a computer of a sentence or other string of words into its constituents, resulting in a parse tree showing their syntactic relation to each other, which may also contain semantic and other information.'' (Wikipedia). A parser is a program that parses the text files.
MATHEMATICAL EQUATION:
For Specific Heat

For Enthalpy

For Entropy

Main code -
clear all
close all
clc
%for getting data
f1=fopen('THERMO.dat','r');
fgetl(f1);
header_global_temp=fgetl(f1);
A=strsplit(header_global_temp,' '); %To split the string
%To obtain global max,mid and min temp
global_min=str2num(A{2});
global_mid=str2num(A{3});
global_max=str2num(A{4});
-----------------------------------------------------------------------------------------------------------------------
Explanation -
'fopen' - Used to open the file.
'strsplit' - Used to split the string using a delimiter (any recongnisable charater like 'space' or 'E')
'str2num' - Used to convert string into num so we can perform mathematical operations.
'fgetl' - Used to read a line from file.
First step is to open the file and take a header information.In header global max,mid and min temperatures are given,To get this we used strsplit to split the string and after conversion in will saved in cell array.After that converted into the num so we can perform mathematical operations on that.
-----------------------------------------------------------------------------------------------------------------------
Code -
%ignoring the comments in the file
for i=1:3
fgetl(f1);
end
% reading all line data
for i=1:53
header=fgetl(f1);
species_header=strsplit(header,' ');
species_name=species_header{1};
%finding the string
loc_temp=strsplit(header,' ');
speciess_name=(loc_temp(1));
loc_min_temp=str2double(loc_temp(end-3));
loc_mid_temp=str2double(loc_temp(end-2));
loc_max_temp=str2double(loc_temp(end-1));
-----------------------------------------------------------------------------------------------------------------------
Explanation -
After that 3 lines of comments are their so we ignored that 3 lines using for loop and 'fget' command.We have total 53 species so loop start from 1 to 53.Next line header is their and having information about species and its local min and max temperature.To get this used 'strsplit' and 'str2double' commads.
-----------------------------------------------------------------------------------------------------------------------
Code -
%finding the coefficients a1 to a14
tline1=fgetl(f1);
tline2=fgetl(f1);
tline3=fgetl(f1);
a=strfind(tline1,'E');
a1=tline1(1:a(1)+3);
a1=str2double(a1);
a2=tline1(a(1)+4:a(2)+3);
a2=str2double(a2);
a3=tline1(a(2)+4:a(3)+3);
a3=str2double(a3);
a4=tline1(a(3)+4:a(4)+3);
a4=str2double(a4);
a5=tline1(a(4)+4:a(5)+3);
a5=str2double(a5);
%for line 3
a=strfind(tline2,'E');
a6=tline2(1:a(1)+3);
a6=str2double(a6);
a7=tline2(a(1)+4:a(2)+3);
a7=str2double(a7);
a8=tline2(a(2)+4:a(3)+3);
a8=str2double(a8);
a9=tline2(a(3)+4:a(4)+3);
a9=str2double(a9);
a10=tline2(a(4)+4:a(5)+3);
a10=str2double(a10);
%for line 4
a=strfind(tline3,'E');
a11=tline3(1:a(1)+3);
a11=str2double(a11);
a12=tline3(a(1)+4:a(2)+3);
a12=str2double(a12);
a13=tline3(a(2)+4:a(3)+3);
a13=str2double(a13);
a14=tline3(a(3)+4:a(4)+3);
a14=str2double(a14);
--------------------------------------------------------------------------------------------------------------------
Explanation -
The total 14 coefficients are given,the first 7 coefficients are high-temperature coefficients and the second 7 coefficients are low-temperature coefficients.The coefficients are given in 3 lines for so first taken that 3 lines with 'fgetl' and for separation of coefficients used 'E' so we can get all 14 coefficients.
-----------------------------------------------------------------------------------------------------------------------
Code -
%universal gas constant
R=8.314;
t=linspace(loc_min_temp,loc_max_temp,1000);
%to calculate
%specific heat by creating function
c_p=specific_heat(a1,a2,a3,a4,a5,a6,a7,a8,a9,a10,a11,a12,a13,a14,loc_min_temp,loc_mid_temp,loc_max_temp,t,R);
%enthalpy by creating function
H=enthalpy(a1,a2,a3,a4,a5,a6,a7,a8,a9,a10,a11,a12,a13,a14,loc_min_temp,loc_mid_temp,loc_max_temp,t,R);
%entropy by creating function
S=entropy(a1,a2,a3,a4,a5,a6,a7,a8,a9,a10,a11,a12,a13,a14,loc_min_temp,loc_mid_temp,loc_max_temp,t,R);
mkdir(species_name);
cd(species_name);
%plotting for
%temperature vs specific heat
figure(1)
plot(t,c_p)
xlabel('temperature')
ylabel('specific heat')
title('temperature vs specific heat')
image=getframe(gcf);
imwrite(image.cdata,'t vs cp.png')
saveas(1,'specific heat','jpg')
%temperature vs enthalpy
figure(2)
plot(t,H)
xlabel('temperature')
ylabel('enthalpy')
title('temperature vs enthalpy')
image=getframe(gcf);
imwrite(image.cdata,'t vs H.png')
saveas(2,'enthalpy','jpg')
%temperature vs entropy
figure(3)
plot(t,S)
xlabel('temperature')
ylabel('entropy')
title('temperature vs entropy')
image=getframe(gcf);
imwrite(image.cdata,'t vs S.png')
saveas(3,'entropy','jpg')
cd ..
%calculating molecular mass
[M]=molecular_wt(species_name);
N=sprintf('%s mol_wt=%f',species_name,M);
disp(N)
end
fclose(f1);
-----------------------------------------------------------------------------------------------------------------------
Explanation -
For calculating entropy,enthalpy,specific heat and molecular weight made separate function and calling of that function inside the main function.For plotting taken 1000 points inbetween local min and local max temperature so plot will look smooth. Plotting of 1.temperature vs specific heat 2.temperature vs enthalpy 3.temperatyre vs entropy with proper title and lables.
-----------------------------------------------------------------------------------------------------------------------
Code for Specific Heat -
function [c_p]=specific_heat(a1,a2,a3,a4,a5,a6,a7,a8,a9,a10,a11,a12,a13,a14,loc_min_temp,loc_mid_temp,loc_max_temp,t,R)
if (t>loc_mid_temp)
c_p=R*(a1+(a2.*t)+(a3.*(t.^2))+(a4.*(t.^3))+(a5.*(t.^4)));
else
c_p=R*(a8+(a9.*t)+(a10.*(t.^2))+(a11.*(t.^3))+(a12.*(t.^4)));
end
-----------------------------------------------------------------------------------------------------------------------
Code for Entropy -
function [S]=entropy(a1,a2,a3,a4,a5,a6,a7,a8,a9,a10,a11,a12,a13,a14,loc_min_temp,loc_mid_temp,loc_max_temp,t,R)
if (t>loc_mid_temp)
S=((a1.*logt)+(a2.*t)+((a3.*(t.^2))/2)+((a4.*(t.^3))/3)+(a5.*(t.^4))+a7);
else
S=((a8.*log(t))+(a9.*t)+((a10.*(t.^2))/2)+((a11.*(t.^3))/3)+(a12.*(t.^4))+a14)*R;
end
-----------------------------------------------------------------------------------------------------------------------
Code for Enthalpy -
function [H]=enthalpy(a1,a2,a3,a4,a5,a6,a7,a8,a9,a10,a11,a12,a13,a14,loc_min_temp,loc_mid_temp,loc_max_temp,t,R)
if (t>loc_mid_temp)
H=(a1+((a2.*t)/2)+((a3.*(t.^2))/3)+((a4.*(t.^3))/4)+((a5.*(t.^4))/5)+(a6./t)).*t*R;
else
H=(a8+((a9.*t)/2)+((a10.*(t.^2))/3)+((a11.*(t.^3))/4)+((a12.*(t.^4))/5)+(a13./t)).*t*R;
end
-----------------------------------------------------------------------------------------------------------------------
Code for Molecular weight -
function [M]=molecular_wt(species_name)
atomic_mass=[15.999,1.008,12.011,14.007,39.948];
elements=['O','H','C','N','A'];
mol_wt=0;
for i=1:length(species_name)
for j=1:length(elements)
if strcmpi(species_name(i),elements(j))
mol_wt=mol_wt+atomic_mass(j);
z=j;
end
end
t=str2double(species_name(i));
if (t>1)
mol_wt=mol_wt+(atomic_mass(z)*(t-1));
end
end
M=mol_wt;
end
Results -
1.Screenshot of the window where all the folders are saved.

2.O2
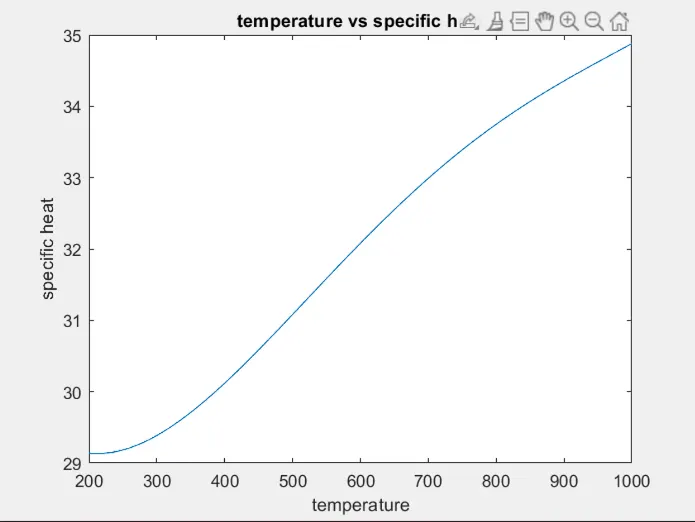
Temp vs specific heat
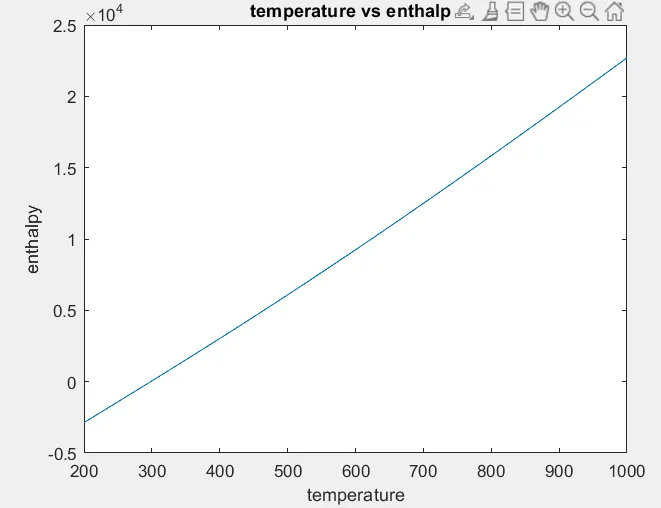
Temp vs Enthapy
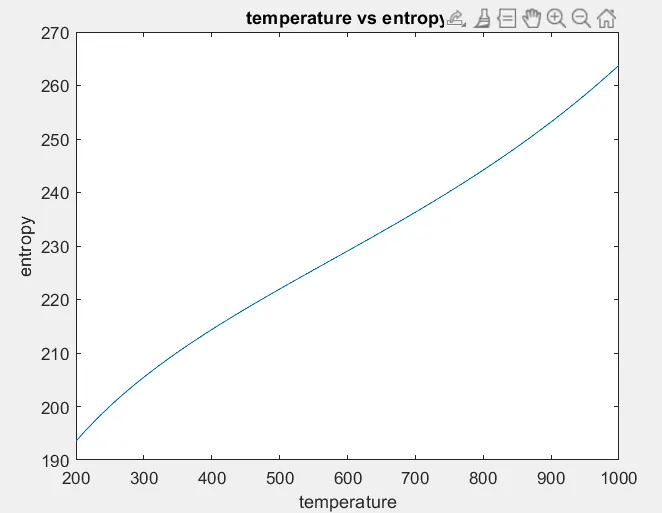
Temp vs Entropy
3.N2
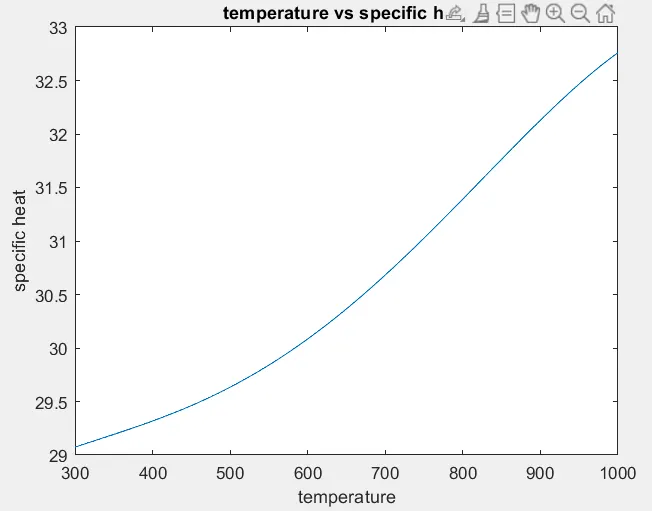
Temp vs Specific heat
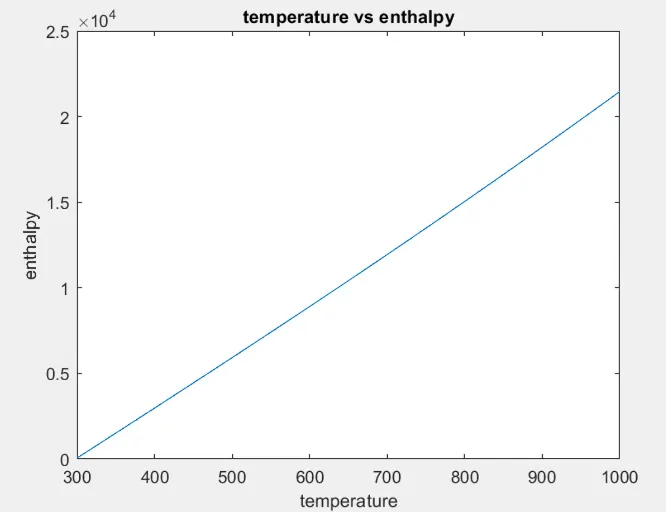
Temp vs Enthalpy
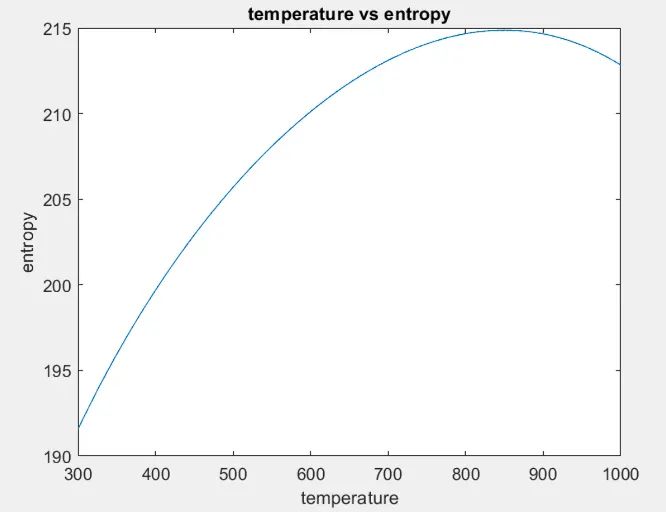
Temp vs Entropy
4.CO2
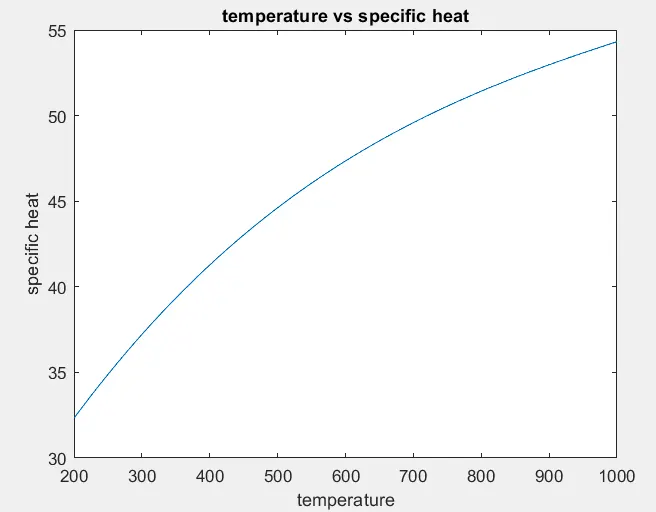
Temp vs Specific Heat
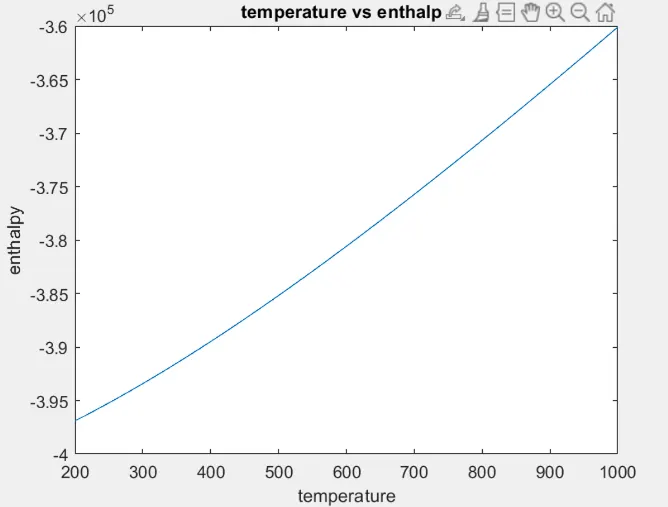
Temp vs Enthapy
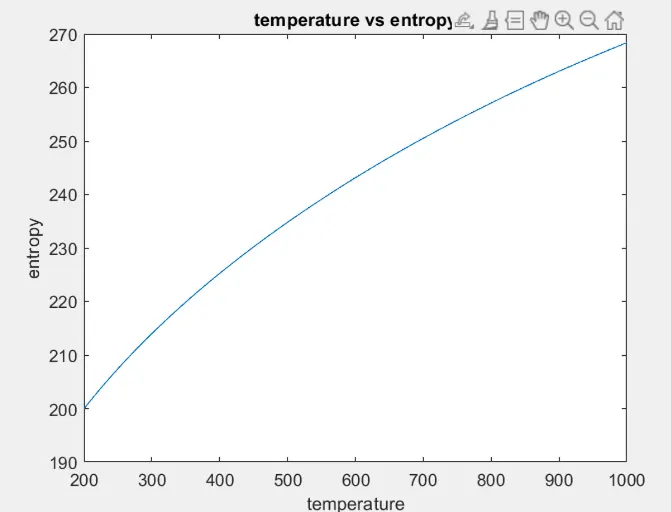
Temp vs Entropy
Conclusion -
- Wrote a function that extracts the 14 coefficients and calculates the enthalpy,entropy and specific heats for all the species in the data file.
- Calculated molecular weight of each species and disply in comment box.
- Plotted the specific heat,enthalpy and entropy for the local temperature range.
- Saved the plots as images with appropriate names and dumping them in seperate folders for each species.