Project 1 - Parsing NASA thermodynamic data
AIM:
To write a code in MATLAB to parse the NASA thermodynamic data file and then calculate thermodynamic properties of various gas species.
Objective:
- Write a function to extract 14 coefficients and calculate Enthalpy, Entropy, Specific heat & molecular weight for all the species in the data file.
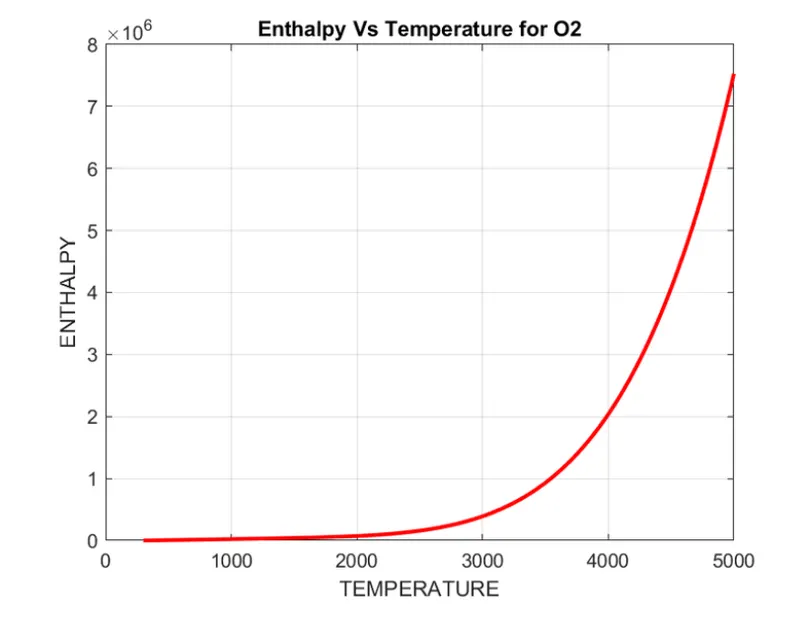
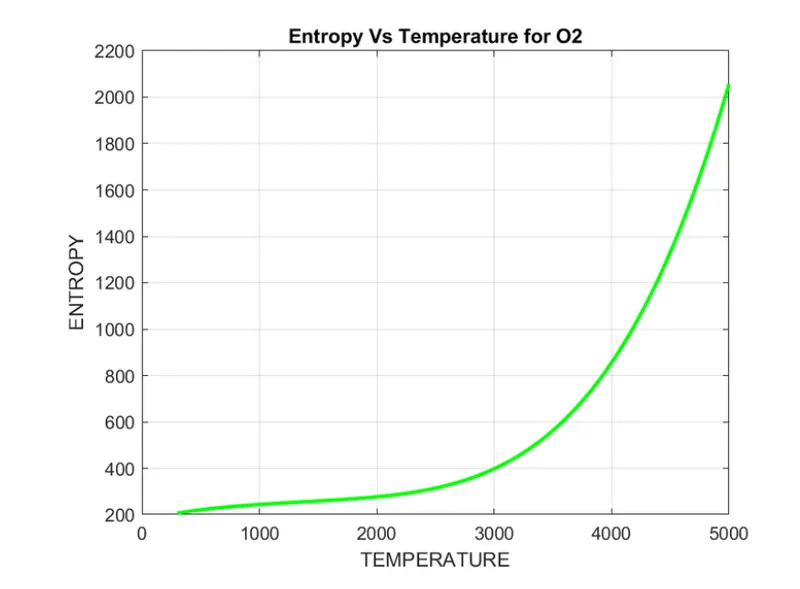
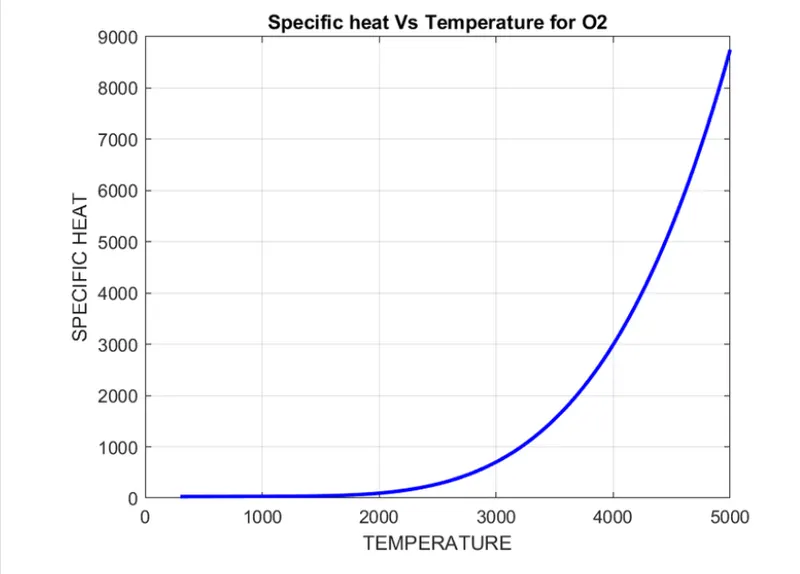
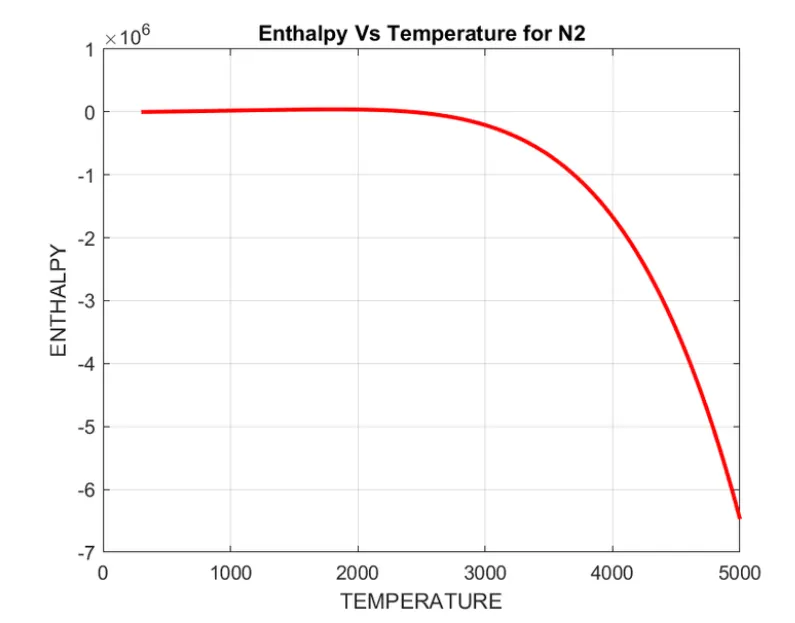
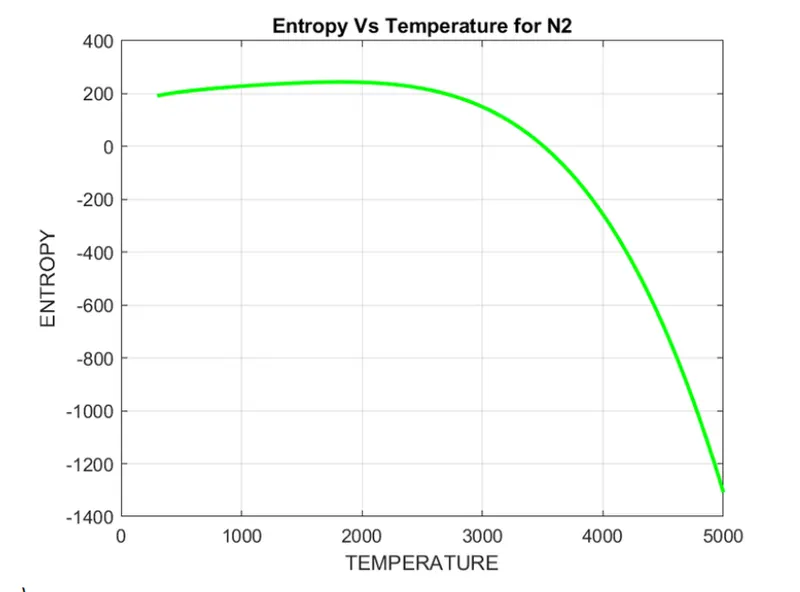
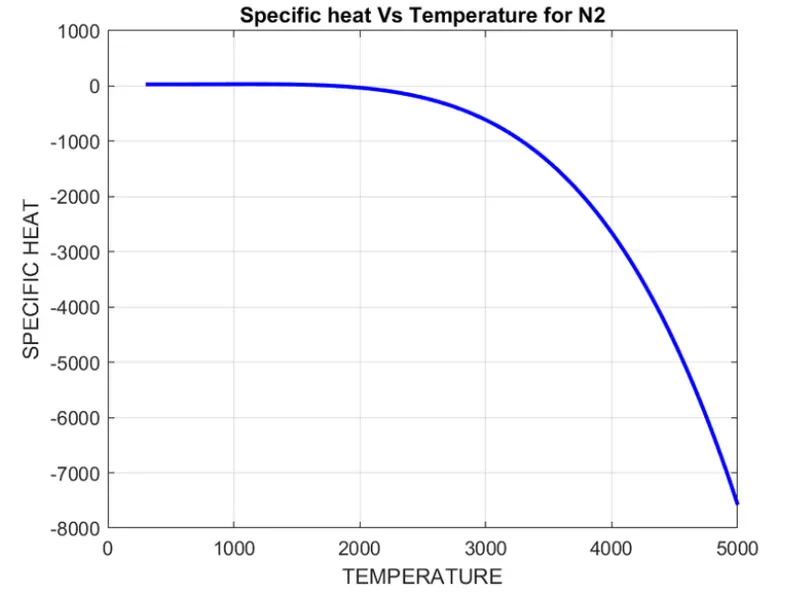
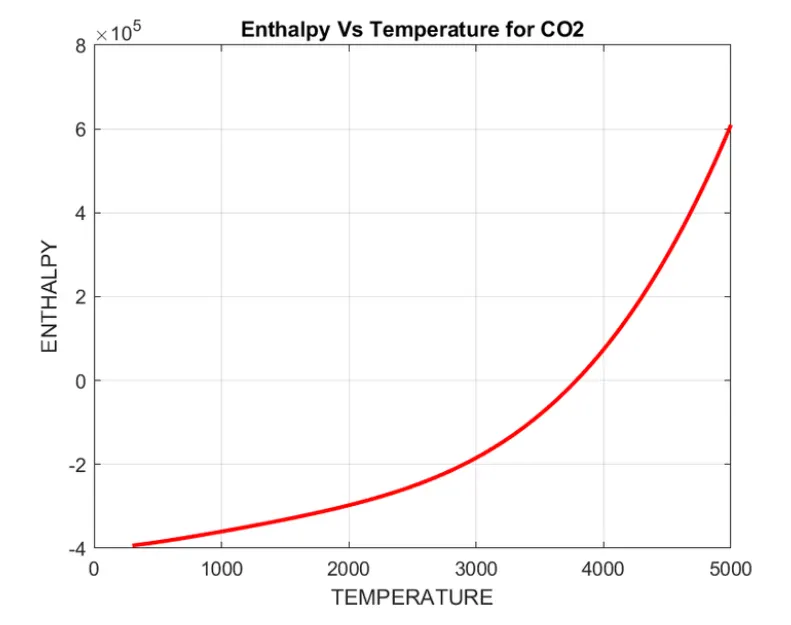
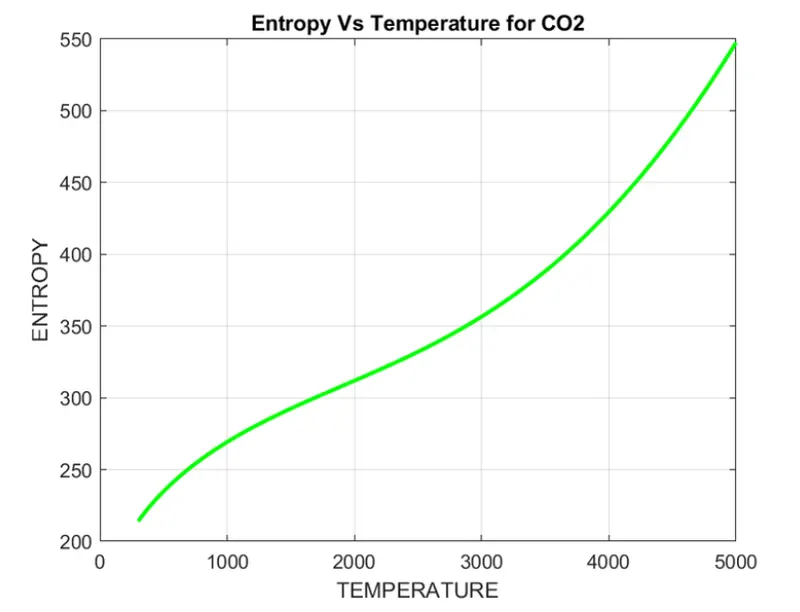
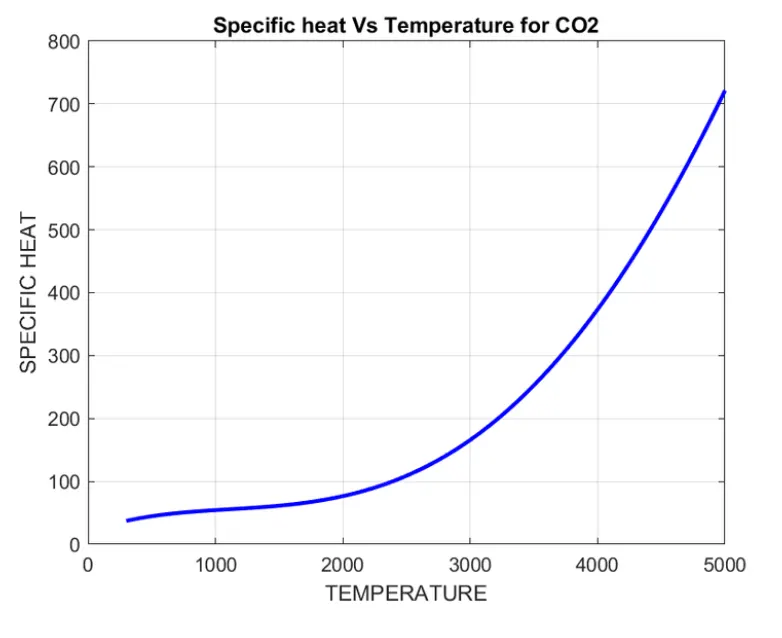
- Plot Cp, Enthalpy, and Entropy for temperature range.
- Save the plots as images with appropriate names and dump them in separate folders for each species with suitable names. All these should be generated automatically.
THEORY:
File Parsing
Parsing a file means reading the data stream of some sort and building an in-memory model of semantic content of the data. This aims at facilitating & performing a transformation on the data.
In general, ‘Parsing’ refers to MATLAB reading an ‘m-file’ and then translating the data of ‘m-file’ into internal code in MATLAB, which it stores in memory. When you execute the code, the file which is parsed in memory will run.
Specific Heat :
It is the ratio of the quantity of heat required to raise the temperature of a body by 1 degree to that required to raise the temperature of an equal mass of water by one degree.

Where CP = Specific heat,
R = Universal gas constant.
Entropy :
It is the measure of a system’s thermal energy per unit temperature that is unavailable for doing useful work. Because work is obtained from ordered molecular motion, the amount of entropy is also a measure of the molecular disorder, (or) randomness, of a system.

Where, S = Entropy
R = Universal gas constant.
Enthalpy :
Simply, Enthalpy is the sum of internal energy and product of pressure and volume. When a process occurs at constant pressure.

Where H = Enthalpy
R = Universal gas constant.
MATLAB CODE EXPLANATION :
- I have used ‘fopen’ command to open Nasa’s experimental data.
- If you open the experimental data and analyze what’s happening, we can easily code it according to our requirements.
- 1st line consists of text (THERMO). I gave ‘fgetl’ command to read the 1st
- Second-line consists of 3 temperature values. Like 1st line use ‘fgetl’ to read the 2nd line and store it in variable global_temp.
- After reading the 2nd line, I have used ‘strsplit’ command using ‘blank space’ as a delimiter. ‘strsplit’ splits the data using the given delimiter. Therefore, temp_range consists of all 3 temperature values in a vector.
- Now, obtain the global minimum, medium, and maximum temperatures from the split data, use ‘str2num’ as this converts character array to numeric array.
- Then create a vector of 400 evenly spaced temperature points using ‘linspace’ command and provide universal gas constant value.
- 3rd,4th & 5th lines in the data are comments. Use ‘fgetl’ again for reading those 3 lines.
- From line ‘6’ to line ‘218’, there are a set of 4 lines. 1st line consists of the name of species 2nd, 3rd, 4th lines consist of experimental data.
- Now, I will explain the code for these 4 lines of data.
- Line 1 – I have read line ‘6’ using ‘fgetl’ and stored it in line 1 variable.
- I have used ‘strtok’ command to get the selected parts of the string (i.e, species name ‘O’)
- Line 2 – I have read line ‘7’ using ‘fgetl’ and stored it in line 2 variable.
- Use ‘strfind’ command to find the places of ‘E’ in line 7, ‘strfind’ is used to find strings within other strings. Now store them in an array named ‘A’
- Similarly, follow these steps for the next 2 lines. Then, you will get A, B, C arrays respectively.
- Now, extract all the coefficients (a1, a2, a3, a4, a5, a6, a7, b1, b2, b3, b4, b5, b6, b7) using ‘str2num’ command.
- All this process should be done again for line 7 to line 212. Therefore, I have created a ‘for-loop’ for all the 53 species.
MATLAB CODE :
clear all
close all
clc


f1 = fopen('THERMO.dat','r');
first_line = fgetl(f1);  %reading the 1st line from data


% Obtaining global max, min, and medium temperatures

global_temp = fgetl(f1)  %reading 2nd line from data
temp_range = strsplit(global_temp,' ') %splitting 2nd line using blank space as delimiter

%obtaining temperature values from splitted data
global_min_temp = str2num(temp_range{2})
global_med_temp = str2num(temp_range{3})
global_max_temp = str2num(temp_range{4})

%Create a vector of 400 evenly spaced temperature points
T = linspace(global_min_temp,global_max_temp,400);
R = 8.314; % Universal gas constant

comments1 = fgetl(f1);  %reading 3rd line from data
comments2 = fgetl(f1);  %reading 4th line from data
comments3 = fgetl(f1);  %reading 5th line from data

for i = 1:53


line1 = fgetl(f1);
element_name = strtok(line1);

line2 = fgetl(f1);
A = strfind(line2,'E');

line3 = fgetl(f1);
B = strfind(line3,'E');

line4 = fgetl(f1);
C = strfind(line4,'E');

a1 = str2num(line2(1:A(1)+3));
a2 = str2num(line2(A(1)+4:A(2)+3));
a3 = str2num(line2(A(2)+4:A(3)+3));
a4 = str2num(line2(A(3)+4:A(4)+3));
a5 = str2num(line2(A(4)+4:A(5)+3));

a6 = str2num(line3(1:B(1)+3));
a7 = str2num(line3(B(1)+4:B(2)+3));

b1 = str2num(line3(B(2)+4:B(3)+3));
b2 = str2num(line3(B(3)+4:B(4)+3));
b3 = str2num(line3(B(4)+4:B(5)+3));
b4 = str2num(line4(1:C(1)+3));
b5 = str2num(line4(C(1)+4:C(2)+3));
b6 = str2num(line4(C(2)+4:C(3)+3));
b7 = str2num(line4(C(3)+4:C(4)+3));

%specific heat
cp = specific_heat(a1,a2,a3,a4,a5,b1,b2,b3,b4,b5,T,R,global_med_temp);


% Enthalpy
h = enthalpy(a1,a2,a3,a4,a5,a6,b1,b2,b3,b4,b5,b6,T,R,global_med_temp);

% Entropy
s = entropy_calc(a1,a2,a3,a4,a5,a7,b1,b2,b3,b4,b5,b7,T,R,global_med_temp);

% Calculating molecular weight of species
Molecular_wt(i) = molecular_weight(element_name);


%saving and plotting the data

cd('C:\Users\ADMIN\Documents\MATLAB\Examples\R2022a\graphics2\PeaksSurfaceExample')
dir_name = element_name;
mkdir(dir_name);


figure(1)
plot(T,cp,'linewidth',2,'color','b')
title(sprintf('Specific heat Vs Temperature for %s',element_name))
xlabel('TEMPERATURE')
ylabel('SPECIFIC HEAT')
grid on

figure(2)
plot(T,h,'linewidth',2,'color','r')
title(sprintf('Enthalpy Vs Temperature for %s',element_name))
xlabel('TEMPERATURE')
ylabel('ENTHALPY')
grid on

figure(3)
plot(T,s,'linewidth',2,'color','g')
title(sprintf('Entropy Vs Temperature for %s',element_name))
xlabel('TEMPERATURE')
ylabel('ENTROPY')
grid on

 %pause the loop so that you can see each species plot in real time
  pause(0.0001)

   cd(dir_name);
saveas(1,'Specific heat.png');
saveas(2,'Enthalpy.png');
saveas(3,'Entropy.png');


end

fclose(f1);- For molecular weight calculation, create a function which takes weight of Hydrogen, Carbon, Nitrogen, Oxygen, and Argon as inputs. As all the elements consists of all these atoms.
- Now, I have created a loop and used ‘strcmp’ command to compare elements with species. If they both match then the molecular weight will be calculated.
- Now, take the string of species name and position to calculate their weight. Here ‘n’ is number of molecules of elements present in the species.
function MW =molecular_weight(element_name)
atoms = ['H','C','N','O','A'];
     fprintf('Molecular Weight of ');
    fprintf(element_name);
    fprintf(' : ');
    atomic_weight = [1 12 14 15 39];
    MW = 0;
    for i = 1:length(element_name)
        for j = 1:length(atoms)
            if strcmp(element_name(i),atoms(j))
                MW = MW +atomic_weight(j);
                position = j;
            end
        end
        n = str2num(element_name(i));
        if n>1
            MW = MW + atomic_weight(position)*(n-1);
        end
    end
    fprintf('%d',MW);
    disp(' ');
end- Now, create functions for calculating specific heat, enthalpy, and entropy.
- For entropy function, if the temperature is less than or equal to global medium temperature it will take 1st six high-temperature values, otherwise, it will take the next six vales.
- Similarly, create functions for specific heat and Enthalpy use the respective formulae to create functions.
%program to specific heat
function cp = specific_heat(a1,a2,a3,a4,a5,b1,b2,b3,b4,b5,T,R,global_med_temp)
% Comparing with global temp

if T > global_med_temp
    cp = R.*(a1+a2.*T+a3.*T.^2+a4.*T.^3+a5.*T.^4);

else
    cp = R.*(b1+b2.*T+b3.*T.^2+b4.*T.^3+b5.*T.^4);
end
- Now, create functions for calculating specific heat, enthalpy, and entropy.
- For entropy function, if the temperature is less than or equal to global medium temperature it will take 1st six high-temperature values, otherwise, it will take the next six vales.
- Similarly, create functions for specific heat and Enthalpy use the respective formulae to create functions.
%program to specific heat
function cp = specific_heat(a1,a2,a3,a4,a5,b1,b2,b3,b4,b5,T,R,global_med_temp)
% Comparing with global temp

if T > global_med_temp
    cp = R.*(a1+a2.*T+a3.*T.^2+a4.*T.^3+a5.*T.^4);

else
    cp = R.*(b1+b2.*T+b3.*T.^2+b4.*T.^3+b5.*T.^4);
end


%program to calculate enthalpy
function h = enthalpy(a1,a2,a3,a4,a5,a6,b1,b2,b3,b4,b5,b6,T,R,global_med_temp)
if T > global_med_temp
    h = R.*(a1.*T+(a2.*T.^2)./2+(a3.*T.^3)./3+(a4.*T.^4)./4+(a5.*T.^5)./5+a6);
else
    h = R.*(b1.*T+(b2.*T.^2)./2+(b3.*T.^3)./3+(b4.*T.^4)./4+(b5.*T.^5)./5+b6);

end


%Program to calculate entropy
function s = entropy_calc(a1,a2,a3,a4,a5,a7,b1,b2,b3,b4,b5,b7,T,R,global_med_temp)
if T<=global_med_temp
    s =  R*(a1.*log(T)+a2.*T+a3.*(T.^2)./2+a4.*(T.^3)./3+a5.*(T.^4)./4+a7);
else
    s = R*(b1.*log(T)+b2.*T+b3.*(T.^2)./2+b4.*(T.^3)./3+b5.*(T.^4)./4+b7);
end- Use ‘cd’ to create new folders for every iteration of loop create a folder name with ‘species’ and paste its directory in cd.
- Now use ‘mkdir’ to provide name for the folder created in the earlier step.
- Now save using ‘saveas’ command into png format.

PLOT :
OUTPUT:
Molecular Weight of O: 15
Molecular Weight of O2: 30
Molecular Weight of H: 1
Molecular Weight of H2: 2
Molecular Weight of OH: 16
Molecular Weight of H2O: 17
Molecular Weight of HO2: 31
Molecular Weight of H2O2: 32
Molecular Weight of C: 12
Molecular Weight of CH: 13
Molecular Weight of CH2: 14
Molecular Weight of CH2(S): 14
Molecular Weight of CH3: 15
Molecular Weight of CH4: 16
Molecular Weight of CO: 27
Molecular Weight of CO2: 42
Molecular Weight of HCO: 28
Molecular Weight of CH2O: 29
Molecular Weight of CH2OH: 30
Molecular Weight of CH3O: 30
Molecular Weight of CH3OH: 31
Molecular Weight of C2H: 25
Molecular Weight of C2H2: 26
Molecular Weight of C2H3: 27
Molecular Weight of C2H4: 28
Molecular Weight of C2H5: 29
Molecular Weight of C2H6: 30
Molecular Weight of CH2CO: 41
Molecular Weight of HCCO: 40
Molecular Weight of HCCOH: 41
Molecular Weight of H2CN: 28
Molecular Weight of HCN: 27
Molecular Weight of HNO: 30
Molecular Weight of N: 14
Molecular Weight of NNH: 29
Molecular Weight of N2O: 43
Molecular Weight of NH: 15
Molecular Weight of NH2: 16
Molecular Weight of NH3: 17
Molecular Weight of NO: 29
Molecular Weight of NO2: 44
Molecular Weight of HCNO: 42
Molecular Weight of HOCN: 42
Molecular Weight of HNCO: 42
Molecular Weight of NCO: 41
Molecular Weight of CN: 26
Molecular Weight of HCNN: 41
Molecular Weight of N2: 28
Molecular Weight of AR: 39
Molecular Weight of C3H8: 44
Molecular Weight of C3H7: 43
Molecular Weight of CH3CHO: 43
Molecular Weight of CH2CHO : 42
CONCLUSION :-
Using Octave code, the necessary coefficients required to evalute various thermodynamic parameters for different species are extracted from NASA thermodynamic data file.The specific heat,entropy & enthalpy for all the species are calculated and ploted against the local temperature range.The molecular weight is calculated for all the species.
Reference :- https://en.wikipedia.org/wiki/Parsing
https://in.mathworks.com/help/matlab/ref/mkdir.htm
https://in.mathworks.com/help/matlab/ref/cd.html
Google Drive link :-
https://drive.google.com/file/d/1b7MtjtgxrLPGcB43MdCSfDbD4MSKJQWF/view?usp=sharing