Project 1 - Parsing NASA thermodynamic data
Parsing NASA thermodynamic data
Objective : -
- Develop a function that extracts the 14 coefficients, calculates the enthalpy, entropy, and specific heats for all species in the data file of THERMO.dat given by skill lync project 1 of MATLAB for Mechanical engineer.
- Develop code to calculate the molecular weight of each species and display it in the command window.
-
Plot the Cp, Enthalpy, and Entropy for the local temperature range ,low temperature: high temperature, specific for each species.
-
Saving the plots as images with appropriate names and dump them in separate folders for each species with a suitable name andgenerated automatically.
Concept:-
NASA came up with polynomials that can be used to evaluate thermodynamic properties such as Cp, H, and S. They have also documented the coefficients that are required to evaluate these polynomials for 1000+ species.
Solution:-
R is the universal gas constant, T is the temperature
Use Specific Heat, Entropy, Enthalpy as function code in Matlab and used to calculate the above and plot the graph accordingly
file parsing is how a piece of file information can be used in a computer program. Read data from external files and databases and include that data in program calculation, writing data in a particular file as file writing.
File parsing logic steps-
1] Open the file and parse the file ,fopen is used to open a file.
2] Navigate throughout the file and using (fgetl) command to get the line of the file and read the file line by line to get to the desired result.
3] Reading the text from the header file and read the file line by line.
4] String split command then cell array is generated. A cell array is a special data structure to store data of the different type and perform the desired task.
5] Function for Cp, H, S is created to calculate them by taking the values from the file data.
6] Molecular weight is calculated using the molecular weight function and is printed on the command window.
7] Plots for Cp, H, S are created for each species and saved in a folder in jpg format to access the species with different images.
8] Create folders for different molecules and save the plots for specific heat, enthalpy, and entropy in that folder and display the molecular weight of different species in the command window.
Functions used in the main program using MATLAB:-
MATLAB CODE for the Entropy function: -
%Funtion for the entropy
function [S] = entropy_S(x1,x2,x3,x4,x5,x7,x8,x9,x10,x11,x12,x14,temp,gb_m,r)
%Checking for the temperaure

%The FIRST 7 coefficients are HIGH-temperature coefficients and the SECOND 7 coefficients are LOW-temperature coefficients
if(temp<=gb_m)
    S = r.*(x8.*log(temp) +(x9.*temp) +(x10*((temp).^2)/2) + (x11*((temp).^3)/3) + (x12*((temp).^4)/4) + (x14));

else
    S = r.*(x1.*log(temp) +(x2.*temp) +(x3*((temp).^2)/2) + (x4*((temp).^3)/3) + (x5*((temp).^4)/4) + (x7));

end
Explanation of Entropy function code: -
- Funtion for the entropy - comments to make a program user friendly
- function [S] = entropy_S(x1,x2,x3,x4,x5,x7,x8,x9,x10,x11,x12,x14,temp,gb_m,r) - function is used to make the code easy to implement ,it is a group of statements that together perform a task.
- Checking for the temperature -comments
- The FIRST 7 coefficients are HIGH-temperature coefficients and the SECOND 7 coefficients are LOW-temperature coefficients - comments
- if(temp<=gb_m) - comparing matrix values of the temperature generated from the linspace command with the global medium temperature
- S = r.*(x8.*log(temp) +(x9.*temp) +(x10*((temp).^2)/2) + (x11*((temp).^3)/3) + (x12*((temp).^4)/4) + (x14)); - calculation of the entropy wrt to the equations
- else - else statement to perform the task if the if statements fail
- S = r.*(x1.*log(temp) +(x2.*temp) +(x3*((temp).^2)/2) + (x4*((temp).^3)/3) + (x5*((temp).^4)/4) + (x7)); - calculation of the entropy wrt to the equations
- end - to end or terminate the function
MATLAB CODE for the Enthalpy function: -
%Funtion for the enthalpy
function [H] = enthalpy_H(x1,x2,x3,x4,x5,x6,x8,x9,x10,x11,x12,x13,temp,gb_m,r)
%Checking for the temperaure

%The FIRST 7 coefficients are HIGH-temperature coefficients and the SECOND 7 coefficients are LOW-temperature coefficients
if(temp<=gb_m)
    H = r*temp.*(x8 + ((x9*temp)/2) + ((x10*(temp).^2)/3) + ((x11*(temp).^3)/4) + ((x12*(temp).^4)/5) + ((x13./temp)));
else

    H = r*temp.*(x1 + ((x2*temp)/2) + ((x3*(temp).^2)/3) + ((x4*(temp).^3)/4) + ((x5*(temp).^4)/5) + ((x6./temp)));
end
Explanation of Enthalpy function code: -
-
function [H] = enthalpy_H(x1,x2,x3,x4,x5,x6,x8,x9,x10,x11,x12,x13,temp,gb_m,r) - function is used to make the code easy to implement ,it is a group of statements that together perform a task.
-
The FIRST 7 coefficients are HIGH-temperature coefficients and the SECOND 7 coefficients are LOW-temperature coefficients - comments.
-
if(temp<=gb_m) - comparing matrix values of the temperature generated from the linspace command with the global medium temperature.
-
H = r*temp.*(x8 + ((x9*temp)/2) + ((x10*(temp).^2)/3) + ((x11*(temp).^3)/4) + ((x12*(temp).^4)/5) + ((x13./temp))); - calculation of the enthalpy wrt to the equations.
-
else - else statement to perform the task if the if statements fail.
-
H = r*temp.*(x1 + ((x2*temp)/2) + ((x3*(temp).^2)/3) + ((x4*(temp).^3)/4) + ((x5*(temp).^4)/5) + ((x6./temp))); - calculation of the enthalpy wrt to the equations.
-
end - to terminate the function.
MATLAB CODE for Specific heat function: -
%Funtion for the Specific Heat
function [Cp] = Specific_heat(x1,x2,x3,x4,x5,x8,x9,x10,x11,x12,temp,gb_m,r)
%Checking for the temperaure
%The FIRST 7 coefficients are HIGH-temperature coefficients and the SECOND 7 coefficients are LOW-temperature coefficients
if(temp<=gb_m)
   Cp = r.*(x8 +(x9.*temp) +(x10*(temp).^2) + (x11*(temp).^3) + (x12*(temp).^4));

else
     Cp = r.*(x1 +(x2.*temp) +(x3*(temp).^2) + (x4*(temp).^3) + (x5*(temp).^4));


end
Explanation of specific heat function code: -
- function [Cp] = Specific_heat(x1,x2,x3,x4,x5,x8,x9,x10,x11,x12,temp,gb_m,r) - function is used to make the code easy to implement ,it is a group of statements that together perform a task.
- The FIRST 7 coefficients are HIGH-temperature coefficients and the SECOND 7 coefficients are LOW-temperature coefficients.
- if(temp<=gb_m) - comparing matrix values of the temperature generated from the linspace command with the global medium temperature.
- Cp = r.*(x8 +(x9.*temp) +(x10*(temp).^2) + (x11*(temp).^3) + (x12*(temp).^4)); - calculation of the Specific heat wrt to the equations.
- else - else statement to perform the task if the if statements fail.
- Cp = r.*(x1 +(x2.*temp) +(x3*(temp).^2) + (x4*(temp).^3) + (x5*(temp).^4)); - calculation of the Specific heat wrt to the equations.
- end.
MATLAB CODE for Molecular weight function: -
%function calculate molecular mass
function mw = mol_wt(sp_name)
%storing value
compound_name = (sp_name);
% creating an array of elements
key_at = ['C','H','O','N','A'];
%storing the atomic mss value in the array
value_at = [12.0107 1.00794 15.994 14.0067 39.948];

%asssigning molecular mass as 0
mw =0 ;
%creating for loop to perform the task
for i = 1:length(compound_name)
    for j = 1:length(key_at)
        %comparing the string value
        if strcmp(compound_name(i),key_at(j))
            %if above comparision is true value of molecular mass is
            %calculated
            mw =mw + value_at(j);
            %storing the position for further use
            pos = j;

        end
    end
    %converting the srting to number
    k = str2double(compound_name(i));
    %comparing if the value of k is greater than executed the further statements
    if(k>1)
        %molecular mass calculation
        mw = mw + value_at(pos)*(k-1);
    end
end
%command to print the molecular masss of the molecule
fprintf('Molecular Weight of the species %s is %f',compound_name ,mw)
end
Explanation of Molecular weight function code: -
- function mw = mol_wt(sp_name)
- Storing value - comments to make a program user friendly.
- compound_name = (sp_name)
- key_at = ['C','H','O','N','A']; - creating an array of elements.
- Storing the atomic mss value in the array - comments to make a program user friendly.
- value_at = [12.0107 1.00794 15.994 14.0067 39.948]; - storing the atomic mass value in the array
- mw =0 ; -asssigning molecular mass as 0
- Creating for loop to perform the task - comments to make a program user friendly.
- for i = 1:length(compound_name) - creating for loop to execute till the elements lenght
- for j = 1:length(key_at) - creating for loop to execute till the key_at array length
- Comparing the string value - comments to make a program user friendly.
- if strcmp(compound_name(i),key_at(j)) - comparing the string value of the species name and the elemts in the array key_at
- If above comparision is true value of molecular mass is - comments.
- Calculated comments.
- mw =mw + value_at(j); - molecular mass calculation.
- Storing the position for further use comments.
- pos = j; - storing the position.
- end - to terminate the if statement.
- end - to terminate the inner for j loop.
- k = str2num(compound_name(i)); - converting the srting to number.
- Comparing if the value of k is greater than executed the further statements comments.
- if(k>1)
- Molecular mass calculation mw = mw + value_at(pos)*(k-1);- comments.
- end - to terminate the if statement.
- end- to terminate the outer for i loop.
- Command to print the molecular masss of the molecule- comments.
- fprintf('Molecular Weight of the species %s is %f',compound_name ,mw) - to print the species name and value.
- end terminates the function.
Main Program of Parsing NASA Thermodynamics Data in MATLAB:-
clear
close
clc

f1 = fopen('THERMO.dat','r');
first_line = fgetl(f1);

R = 8.314;
temp = fgetl(f1);

%Reading text from a header file.
%Reading the global temperature from the next line.

A = strsplit(temp,' ');

%Cell Array is generated [1x4] cell array
glob_lowtemp = str2double(A{2});
glob_midtemp = str2double(A{3});
glob_hightemp =str2double(A{4});

%Temperature Range.
Temperature = linspace(glob_lowtemp,glob_hightemp,1000);
%Skipping the Three Comment Lines.
for j =1:3
    k =fgetl(f1);
end
%for loop for 53 times as there are 53 SPECIES.
for i = 1:53

    %Parsing of the SPECIES Block.
        tline = fgetl(f1);
        S =strsplit(tline,' ');
        Species_name =S{1};

        %Extracting the Coefficients from FIRST line.
        line2 =fgetl(f1);
        x =strfind(line2,'E');

        %Finding the 5 coefficient.
        x1 = line2(1:x(1)+3);
        x1 = str2double(x1);

        x2 = line2(x(1)+4:x(2)+3);
        x2 = str2double(x2);

        x3 = line2(x(2)+4:x(3)+3);
        x3 = str2double(x3);

        x4 = line2(x(3)+4:x(4)+3);
        x4 = str2double(x4);

        x5 = line2(x(4)+4:x(5)+3);
        x5 = str2double(x5);

        %line3 5 Coefficients.
        line3 = fgetl(f1);
        x = strfind(line3,'E');

        x6 = line3(1:x(1)+3);
        x6 = str2double(x6);

        x7 = line3(x(1)+4:x(2)+3);
        x7 = str2double(x7);

        x8 = line3(x(2)+4:x(3)+3);
        x8 = str2double(x8);

        x9 = line3(x(3)+4:x(4)+3);
        x9 = str2double(x9);

        x10 = line3(x(4)+4:x(5)+3);
        x10 = str2double(x10);

        %Line4  4 Coefficients.

        line4=fgetl(f1);
        x = strfind(line4,'E');

        x11 = line4(1:x(1)+3);
        x11 = str2double(x11);

        x12 = line4(x(1)+4:x(2)+3);
        x12 = str2double(x12);

        x13 = line4(x(2)+4:x(3)+3);
        x13 = str2double(x13);

        x14 = line4(x(3)+4:x(4)+3);
        x14 = str2double(x14);


        % ENTROPY Calculation.

        S = entropy_S(x1,x2,x3,x4,x5,x7,x8,x9,x10,x11,x12,x14,Temperature,glob_midtemp,R);

        %Cp Calculation means SPECIFIC HEAT calculation


        Cp = Specific_heat(x1,x2,x3,x4,x5,x8,x9,x10,x11,x12,Temperature,glob_midtemp,R);

        %H as ENTHALPY Calculation.

        H = enthalpy_H(x1,x2,x3,x4,x5,x6,x8,x9,x10,x11,x12,x13,Temperature,glob_midtemp,R);

        % MOLECULAR WEIGHT Calculation for Different Elements.

        mw(i) = mol_wt(Species_name);

        % Reading and Writing of the Molecular weight in the list of
        % molecular weight.
        Moll_wt = fopen('Molecular Weight.txt','w');
        fprintf(Moll_wt,'Molecular Weight of the species %s is  %f ',Species_name,mw);
        fprintf(Moll_wt,'/n');
        fclose(Moll_wt);

        % Plotting on the graph for SPECIES fo the Temperature and Specific
        % heat.

        %Creating a SPECIES FOLDER for saving the species with its
        %properties.

        directory_curr = pwd;
        mkdir(Species_name);
        cd(Species_name);

        %Plotting Graph in Different Plotting Window.
        %plot 1 for the temperature and ENTROPY.
        %plot 2 for the temperature and ENTHALPY.
        %plot 3 for the temperature and SPECIFIC HEAT.


        %plot 1 Enthalphy and Temperaure.
        figure(1)
        plot(Temperature,H,'linewidth',3,'color','b');
        xlabel('Temperature in [K]');
        ylabel('Enthalphy [KJ/mol]');
        grid on
        title(sprintf('Variation in Enthalphy wrt Temperature %s',Species_name));

        saveas (figure(1),'Enthalhy.jpg');

         %plot 2 Entropy and Temperature.

        figure(2)
        plot(Temperature,S,'linewidth',3,'color','r');
        xlabel('Temperature in [K]');
        ylabel('Entropy [KJ/mol-k]');
        grid on
        title(sprintf('Variation in Entropy wrt Temperature %s',Species_name));

        saveas (figure(2),'Entropy.jpg');

         %plot 3 Specific Heat and Temperature.

        figure(3)
        plot(Temperature,Cp,'linewidth',3,'color','g');
        xlabel('Temperature in [K]');
        ylabel('Specific Heat [KJ]');
        grid on
        title(sprintf('Variation in Specific Heat wrt Temperature %s',Species_name));

        saveas (figure(3),'Specific Heat.jpg');

        cd(directory_curr);

end
Explanation of NASA Thermodynamics Data Parsing in Main Program:
- f1 = fopen('THERMO.dat','r') - command to open a file in read mode
-
first_line = fgetl(f1) - to read file line by line
-
R is the universal gas constant J/(mol-K)
-
R = 8.314 - constant
-
temp = fgetl(f1) - to save the line in the temp variable
Reading text from headerfile - comments to make a program user friendly,Reading the global temperature from the next line
-
A = strsplit(temp,' ') - to split the line saved in temp variable when space(' ') is found Cell array is generated 1x4 cell array
-
glob_lowtemp = str2num(A{2}) - assigning the global lower temperature
-
glob_midtemp = str2num(A{3})- assigning the global middle temperature
-
glob_hightemp =str2num(A{4})- assigning the global high temperature
Temperature range
-
Temperature = linspace(glob_lowtemp,glob_hightemp,1000) - command to generate the 1000 values between the range of temperature,skipping the three comment lines
-
for j =1:3- for skipping the comments line by running loop
-
k =fgetl(f1) - to read the comments line
-
end - end of the for loop
Running for loop fopr 53 times as there are 53 species -
for i = 1:53 - for loop to parse the file and create plot for 53 molecules in the file
Parsing of the species block -comments to make a program user friendly
-
tline = fgetl(f1) - reading the first line for a molecule
-
S =strsplit(tline,' ')- splitting the string when the space is found by the command
-
Species_name =S{1} - extracting the name of the molecule
Extracting the coefficients from first line:
-
line2 =fgetl(f1) - reading the first line of the coefficients
-
x =findstr(line2,'E') - finding the string using the command
Finding the 5 coefficient
-
x1 = line2(1:x(1)+3) - Extracting the 1st coefficients from the line
-
x1 = str2num(x1) - converting the string coefficients extracted above to number
-
x2 = line2(x(1)+4:x(2)+3) - Extracting the 2nd coefficients from the line
-
x2 = str2num(x2) - converting the string coefficients extracted above to number
-
x3 = line2(x(2)+4:x(3)+3) - Extracting the 3rd coefficients from the line
-
x3 = str2num(x3) - converting the string coefficients extracted above to number
-
x4 = line2(x(3)+4:x(4)+3) - Extracting the 4th coefficients from the line
-
x4 = str2num(x4) - converting the string coefficients extracted above to number
-
x5 = line2(x(4)+4:x(5)+3) - Extracting the 5th coefficients from the line
-
x5 = str2num(x5) - converting the string coefficients extracted above to number
-
line3 5coefficients:
-
line3 = fgetl(f1) - reading the line of the coefficients
-
x = findstr(line3,'E')- finding the string using the command
-
x6 = line3(1:x(1)+3) -Extracting the 6th coefficients from the line
-
x6 = str2num(x6) - converting the string coefficients extracted above to number
-
x7 = line3(x(1)+4:x(2)+3)-Extracting the 7th coefficients from the line
-
x7 = str2num(x7) - converting the string coefficients extracted above to number
-
x8 = line3(x(2)+4:x(3)+3)-Extracting the 8th coefficients from the line
-
x8 = str2num(x8) - converting the string coefficients extracted above to number
-
x9 = line3(x(3)+4:x(4)+3)-Extracting the 9th coefficients from the line
-
x9 = str2num(x9) - converting the string coefficients extracted above to number
-
x10 = line3(x(4)+4:x(5)+3)-Extracting the 10th coefficients from the line
-
x10 = str2num(x10) - converting the string coefficients extracted above to number
Line4 4coefficients
-
line4=fgetl(f1) - reading the line of the coefficients
-
x = findstr(line4,'E')- finding the string using the command
-
x11 = line4(1:x(1)+3)-Extracting the 11th coefficients from the line
-
x11 = str2num(x11) - converting the string coefficients extracted above to number
-
x12 = line4(x(1)+4:x(2)+3)-Extracting the 12th coefficients from the line
-
x12 = str2num(x12) - converting the string coefficients extracted above to number
-
x13 = line4(x(2)+4:x(3)+3)-Extracting the 13th coefficients from the line
-
x13 = str2num(x13) - converting the string coefficients extracted above to number
-
x14 = line4(x(3)+4:x(4)+3)-Extracting the 14th coefficients from the line
-
x14 = str2num(x14) - converting the string coefficients extracted above to number
Entropy Calculation
-
S = entropy_S(x1,x2,x3,x4,x5,x7,x8,x9,x10,x11,x12,x14,Temperature,glob_midtemp,R)
Cp calculation means Specific Heat calculation
-
Cp = Specific_heat(x1,x2,x3,x4,x5,x8,x9,x10,x11,x12,Temperature,glob_midtemp,R)
Enthlpy Calculaion is H
-
H = enthalpy_H(x1,x2,x3,x4,x5,x6,x8,x9,x10,x11,x12,x13,Temperature,glob_midtemp,R)
Molecular Weight calculation of different elements
-
mw(i) = mol_wt(Species_name)
Reading and writing of the molecular wieght in the list of molecular wieght
Plotting on the graph for species fo the temperature and specific heat and Creating a folder for saving the species with its properties
-
directory_curr = pwd; - pwd identify the current directory
-
mkdir(Species_name); - command used for making a new directory
-
cd(Species_name); - cd is for changing the directory
Plotting the graph in different plotting window, plot 1 for the temperature and entrophy, plot 2 for the temperature and enthalphy, plot 3 for the temperature and specific heat ,plot 1 Enthalphy and Temperaure
-
figure(1) - to open the first figure window
-
plot(Temperature,H,'linewidth',3,'color','b') -plot between temperature and enthalpy
-
xlabel('Temperature in [K]') - for labelling the x axis
-
ylabel('Enthalphy [KJ/mol]') - for labelling the y axis
-
grid on - to make the grid on
-
title(sprintf('Variation in Enthalphy wrt Temperature %s',Species_name)) - to give the title to the plot
-
saveas (figure(1),'Enthalhy.jpg') - to save the plot as jpg file in the folder made
plot 2 Entropy and Temperaure
-
figure(2) - to open the second figure window
-
plot(Temperature,S,'linewidth',3,'color','r') -plot between temperature and entropy
-
xlabel('Temperature in [K]') - labeling of the xaxis
-
ylabel('Entropy [KJ/mol-k]') - labelling the y axis
-
grid on - to make the grid on
-
title(sprintf('Variation in Entropy wrt Temperature %s',Species_name))- to give the title to the plot
-
saveas (figure(2),'Entropy.jpg') - to save the plot as jpg file in the folder made
plot 3 Specific Heat and Temperaure
-
figure(3) - - to open the third figure window
-
plot(Temperature,Cp,'linewidth',3,'color','g')plot between temperature and specific heat
-
xlabel('Temperature in [K]') - labeling of the xaxis
-
ylabel('Specific Heat [KJ]')- labelling the y axis
-
grid on- to make the grid on
-
title(sprintf('Variation in Specific Heat wrt Temperature %s',Species_name))- to give the title to the plot
-
saveas (figure(3),'Specific Heat.jpg') - to save the plot as jpg file in the folder made
-
cd(directory_curr) - to change the directory
-
end =to end the for loop
RESULT :-
Species Folder:
Screenshot of the window where all the folders are saved

Plots for o2 species:
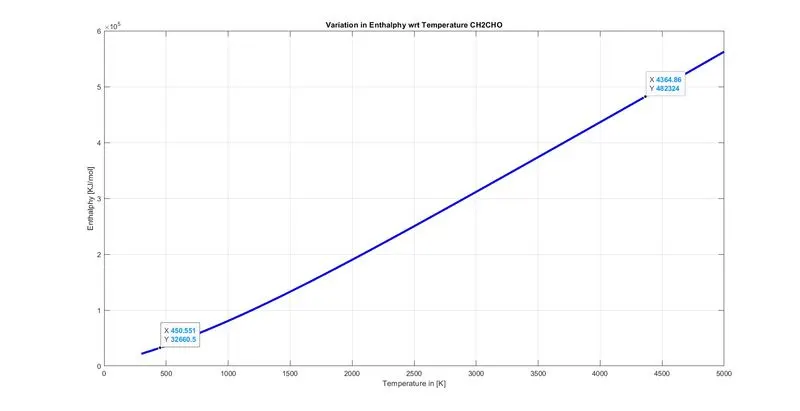
Plots for N2 species:
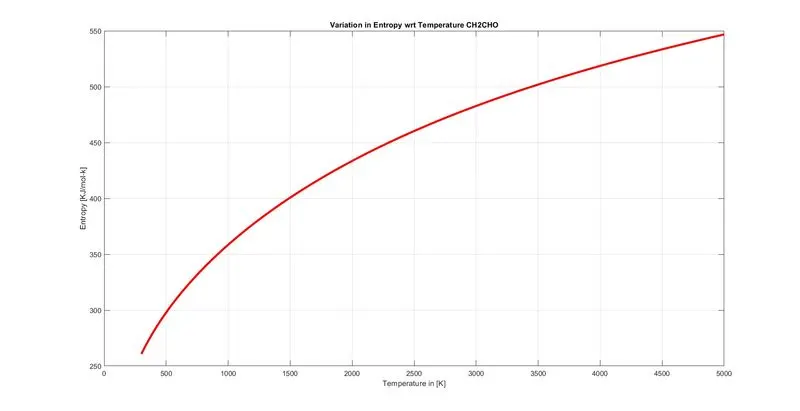
Plots for Co2 species:
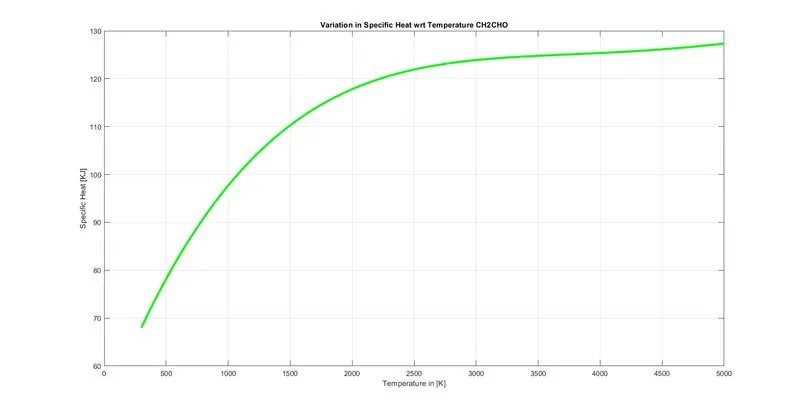
Result for Molecular Weight of Molecules:
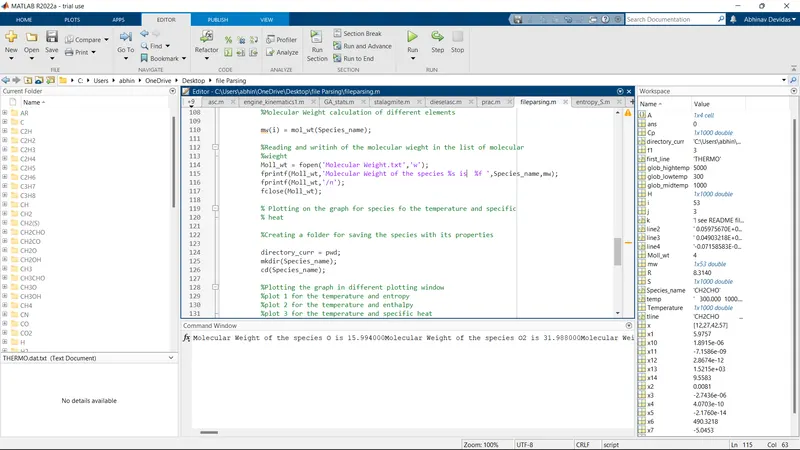
Conclusion for NASA parsing Thermo Data: -
- The plot generation was done by Parsing of the file.
- 53 molecules plots were generated
- Three plots(Cp, H, S) were saved in a folder for a molecule
- Molecular weight was generated for the 53 molecules in the command window and rest PDF is given.
References: -
https://www.mathworks.com/matlabcentral/answers/196582-best-way-to-parse-text-file