Project 1 - Parsing NASA thermodynamic data
Project Title : Parsing NASA thermodynamic data
Aim of the project : To develop a code to parse the NASA thermodynamic data file to calculate thermodynamic properties of various gas species and obtain thermodynamic property (Specific heat,Entropy, Enthalpy,Temperature) plots along with molecular mass of the desired species.
Given data file :
NASA Thermodynamics data
https://drive.google.com/file/d/1tu4uNdsQ0EZ1CPD1q62e0bRb0YRu99kq/view?usp=drivesdk
In this file , there are 53 species like 0,N,H,CO2, OH ,etc and coefficient, local temperature required to evalute thermodynamics properties such as Specific heat(Cp),Enthalpy(h),Entropy(S).
Equation used for calculating the properties:
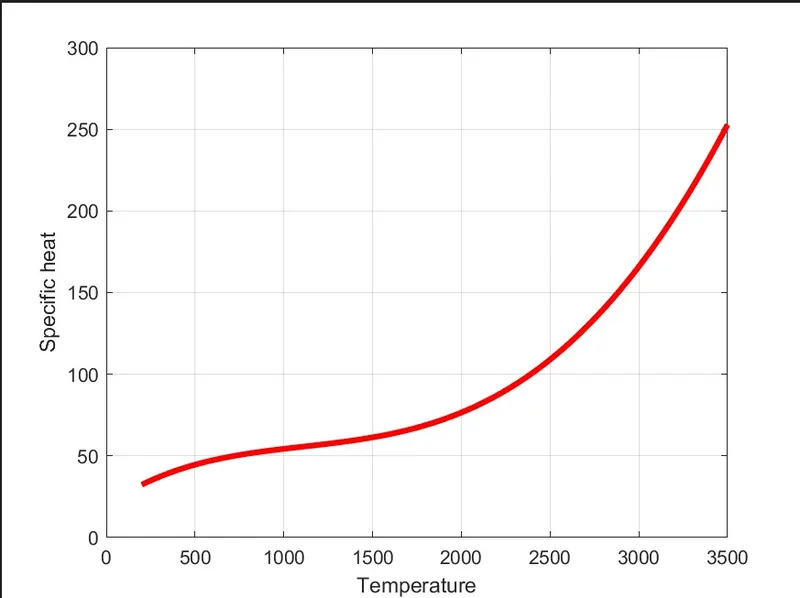
`Cp = R(a1+a2T+a3T^2+a4T^3+a5T^4)`
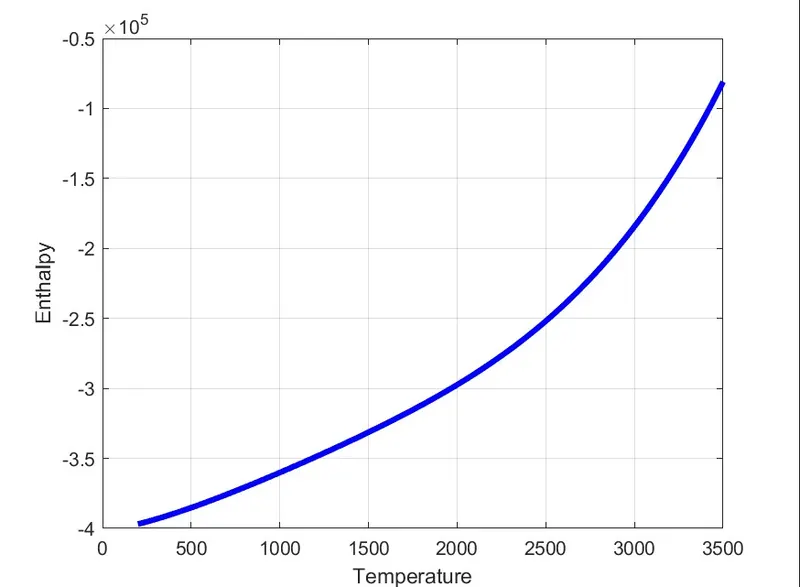
`H /(RT) = a1 +(a2*T)/2+(a3*T^2)/3+(a4*T^3)/4+(a5*T^4)/5)+(a6/T)`
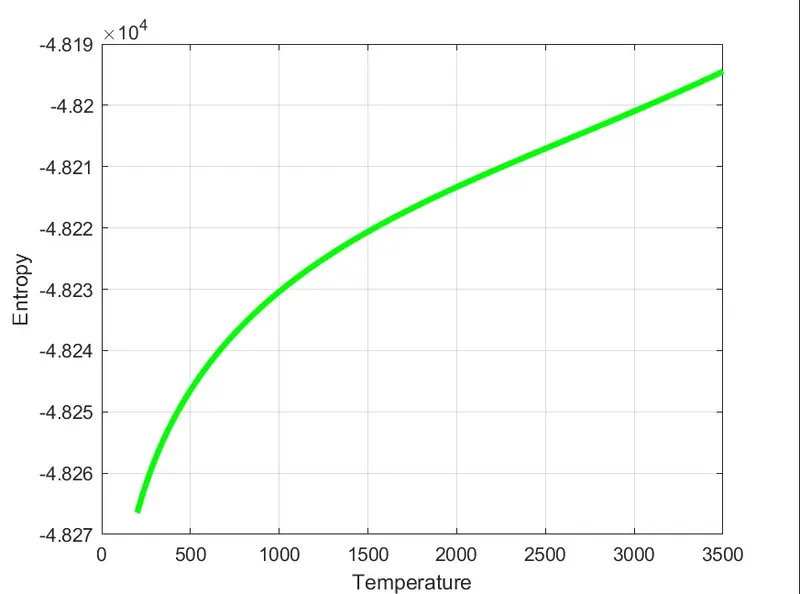
`S/R = a1 ln(T)+a2(T)+(a3*T^2)/2+(a4*T^3)/3+(a5*^4)/4+a7`
Main Code
% Main code for file parsing through MATLAB
clear all
close all
clc

% For reading the saved file in matlab
f = fopen('THERMO.dat','r');
% Skipping the 5 lines
for k = 1:5
    fgetl(f);
end

for k = 1:53
a = fgetl(f); % For getting the required line from the file
b = strsplit(a,' '); % Splitting the line
species_name = b{1};

% Extraction the local temperature
low_temp = str2double(b{end-3});
mid_temp = str2double(b{end-1});
high_temp = str2double(b{end-2});

%% Extraction of coefficient

co_eff = fgetl(f);
pos = strfind(co_eff,'E');

% Coefficients of fitst line
a1 = str2double(co_eff(1:(pos(1)+3)));
a2 = str2double(co_eff((pos(1)+4):(pos(2)+3)));
a3 = str2double(co_eff((pos(2)+4):(pos(3)+3)));
a4 = str2double(co_eff((pos(3)+4):(pos(4)+3)));
a5 = str2double(co_eff((pos(4)+4):(pos(5)+3)));

co_eff = fgetl(f);
pos1 = strfind(co_eff,'E'); % For finding the position of E in the line

% Coefficient of second lines
a6 = str2double(co_eff(1:(pos1(1)+3)));
a7 = str2double(co_eff((pos1(1)+4):(pos1(2)+3)));
a8 = str2double(co_eff((pos1(2)+4):(pos1(3)+3)));
a9 = str2double(co_eff((pos1(3)+4):(pos1(4)+3)));
a10 = str2double(co_eff((pos1(4)+4):(pos1(5)+3)));

co_eff = fgetl(f);
pos2 = strfind(co_eff,'E');

% Coefficient of third lines
a11 = str2double(co_eff(1:(pos2(1)+3)));
a12= str2double(co_eff((pos2(1)+4):(pos2(2)+3)));
a13= str2double(co_eff((pos2(2)+4):(pos2(3)+3)));
a14= str2double(co_eff((pos2(3)+4):(pos2(4)+3)));


% Creation of temperature array
T = linspace(low_temp,high_temp,500);

%% Calculation of cp,H,S
% R is the universal gas constant (J/mol/K)
R = 8.3144598;

if T>mid_temp

cp = R*(a1+(a2*T)+(a3*T.^2)+(a4*T.^3)+(a5*T.^4));
 H = R*T.*(a1+((a2*T)/2)+((a3*T.^2)/3)+((a4*T.^3)/4)+((a5*T.^4)/5)+(a6./T));
 S = R*((a1*log(T))+(a2*T)+((a3*T.^2)/2)+((a4*T.^3)/3)+((a5*T.^4)/4)+a7);

else
 cp = R*(a8+(a9*T)+(a10*T.^2)+(a11*T.^3)+(a12*T.^4));
 H =  R*T.*(a8+((a9*T)/2)+((a10*T.^2)/3)+((a11*T.^3)/4)+((a12*T.^4)/5)+(a13./T));
 S = R*(a8*log(T))+(a9*T)+((a10*T.^2)/2)+((a11*T.^3)/3)+((a12*T.^4)/4)+a13;

 end


 %% Plotting the cp,Enthalpy,Entropy vs Temperature

 % Creating the folder
mkdir(['C:UsersASUSOneDriveDesktopspecies',species_name]);
cd(['C:UsersASUSOneDriveDesktopspecies',species_name]); % Changed the folder to species


figure(1)
 plot(T,cp,'LineWidth',3,'color','r')
 grid on
 xlabel('Temperature')
 ylabel('Specific heat')
 saveas(figure(1),'Specific Heat.jpg','jpg')

figure(2)
 plot(T,H,'linewidth',3,'color','b')
 grid on
 xlabel('Temperature')
 ylabel('Enthalpy')
 saveas(figure(2),'Enthalpy.jpg','jpg')

figure(3)
 plot(T,S,'LineWidth',3,'color','g')
 grid on
 xlabel('Temperature')
 ylabel('Entropy')
 saveas(figure(3),'Entropy.jpg','jpg')


cd ..

%% For calculating the molecular weight

species = species_name;
atoms = ['H','C','N','O','A'];
mass = [1 12 14 16 40];
weight = 0;

for k = 1:length(species)
    for j = 1:length(atoms)

       if strcmpi(species(k),atoms(j))
           weight = weight+mass(j);
           y = j;
       end

    end
    number = str2double(species(k));
        if (number>1)
          weight = weight+mass(y)*(number-1);
        end

 end

fprintf(' Molecular Weight of %s = %f Units',species_name,weight)
    disp(' ')


end
Error faced during the coding:
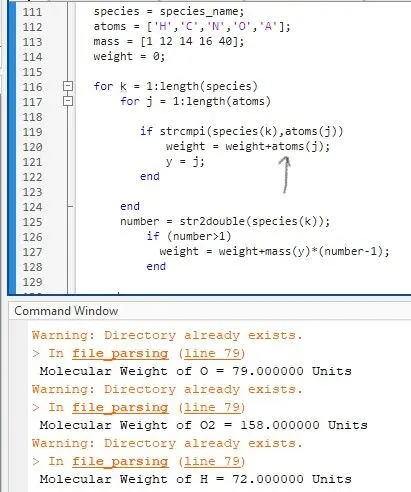
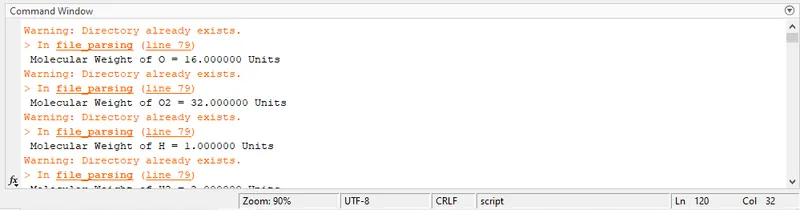
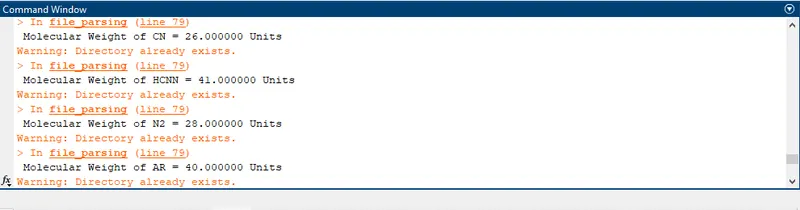
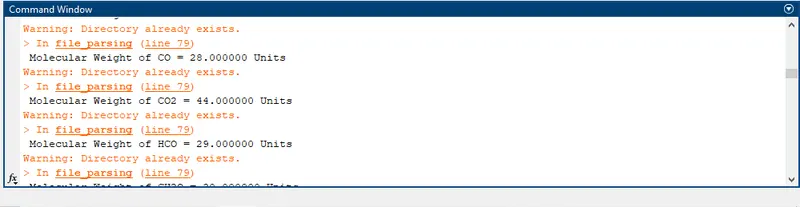
As you can see, for this error , I was getting the wrong molecular weight for every spices.
I have used mass in place of atoms , in this way I have overcome the problem.
Explanation of the Code:
1.Initially we have used the fopen command to read the data filr which is already saved in samepath. Then using the for loop we ahve skipping the next five lines and using fgetl we extracted for global temperature range.
2.The desired input from the user is stored as a string.
3.If a match is obtained, respective coefficients are extracted from the data file usinf fgetl command. Different co-efficients in a particular line is sorted out by specifyinng the place using strfind and range operator in that line. Also the local temperature range for the input molecule is also extracted.
4.We have created a temperature array using linspace command from low temperature to high temperature.
5. For calculating purpose of the properties I have used R (Universal gas constant) = 8.314 (J/mol/K) and calculated Cp,S,H.Now from the different thermodynamic property values, associated Cp v T, S v T and h v T plots are created.
6.Created the directory to store all the output figure using mkdir command given in matlab . Current folder is defined where the figure should be stored and saveas command is used to store the figure to that particular folder created.
7.Inorder to get the molecular weight, the function for calculating the molecular weight is called and stored to a variable and is displayed.
Now, for the thermodynamic propety values ( Cp, S, h) , the associated functions are called.
Output :
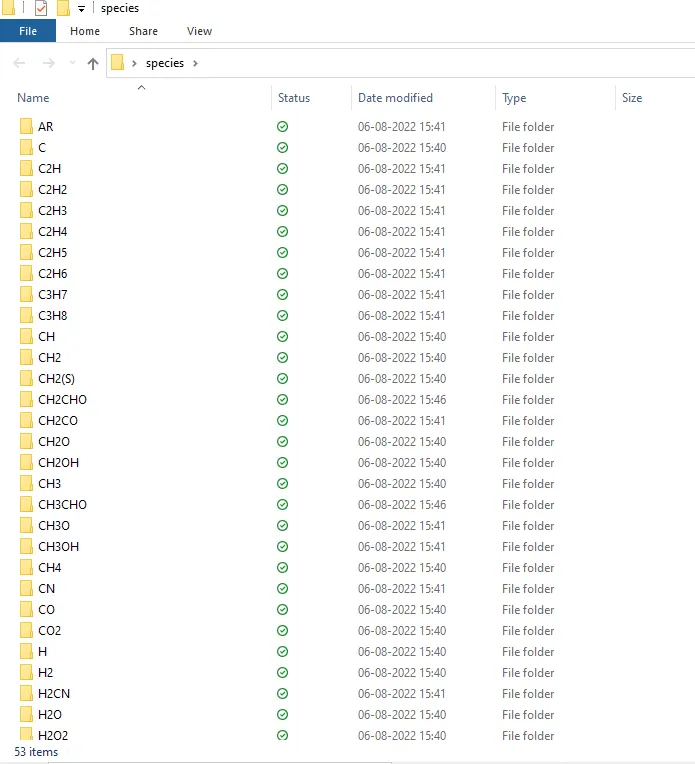
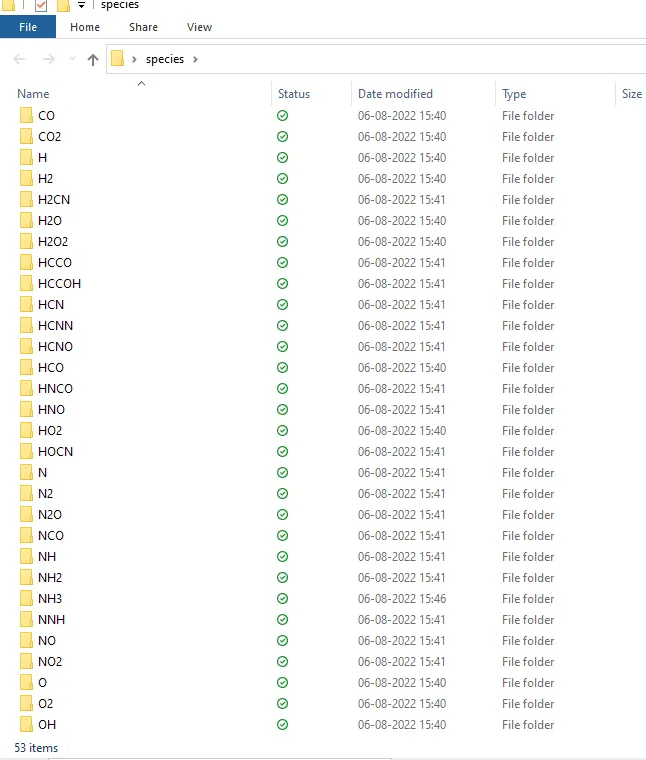
Screenshot of the folder where I have stored all the figures for 53 spices.
Output of o2:
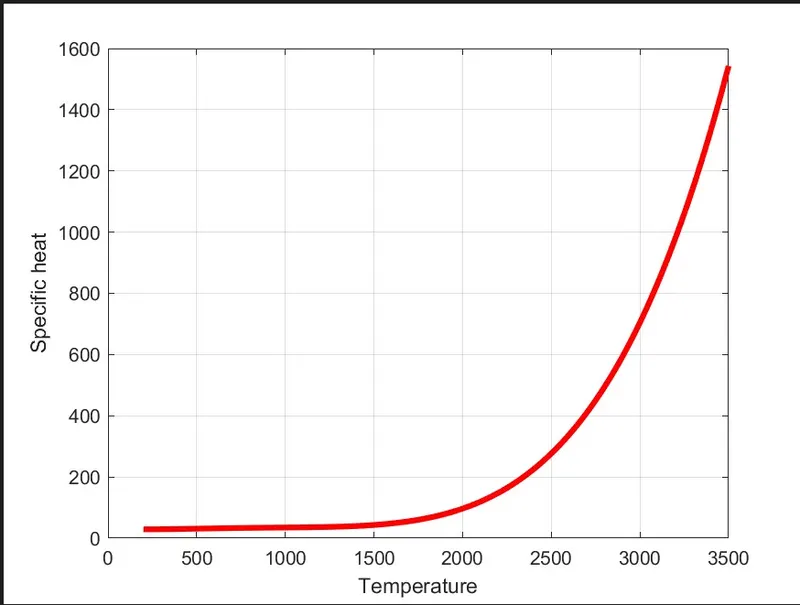
Cp vs T - Plot
h vs T - plot
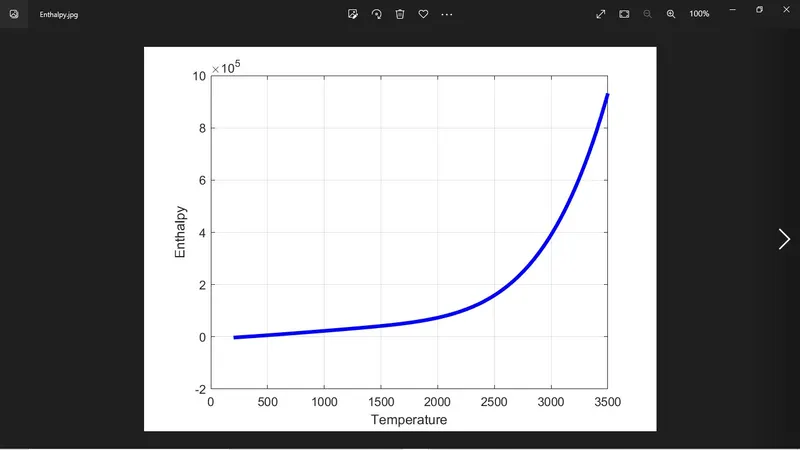
s vs T - plot 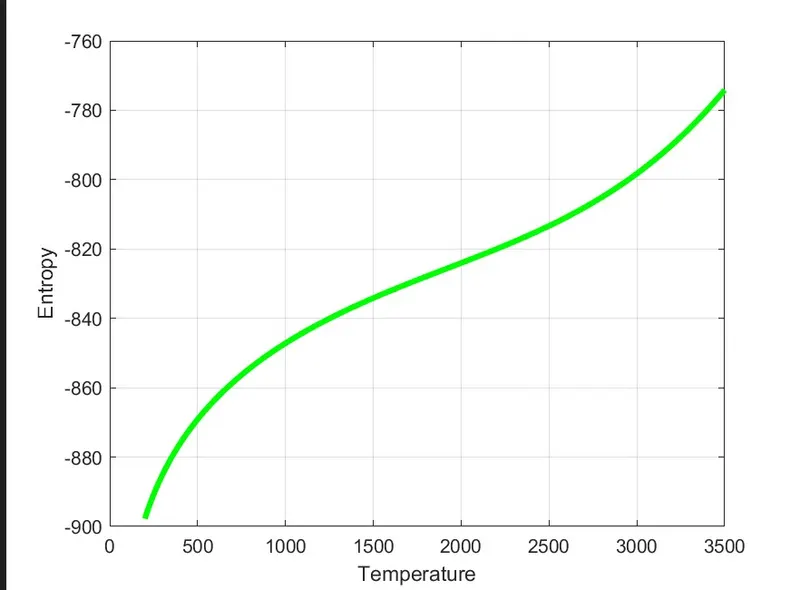
Output of N2:
Cp vs T - plot
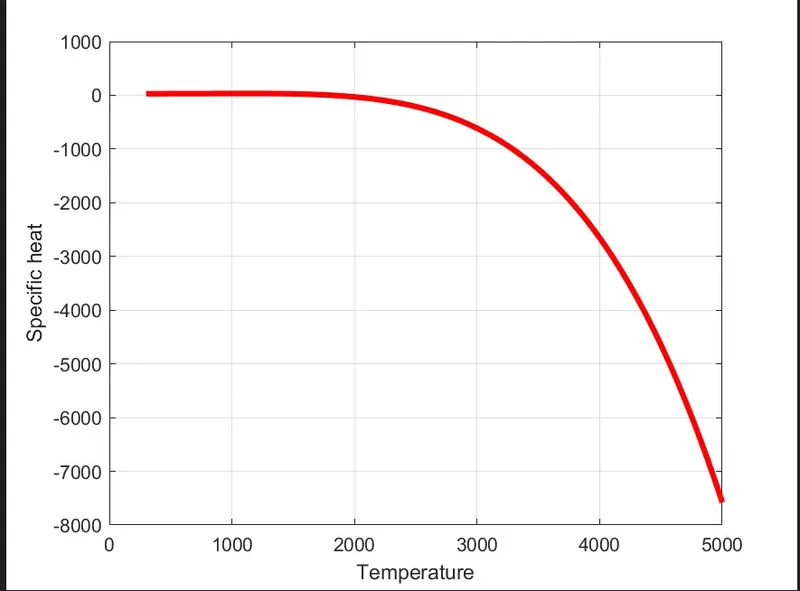
h vs T -plot
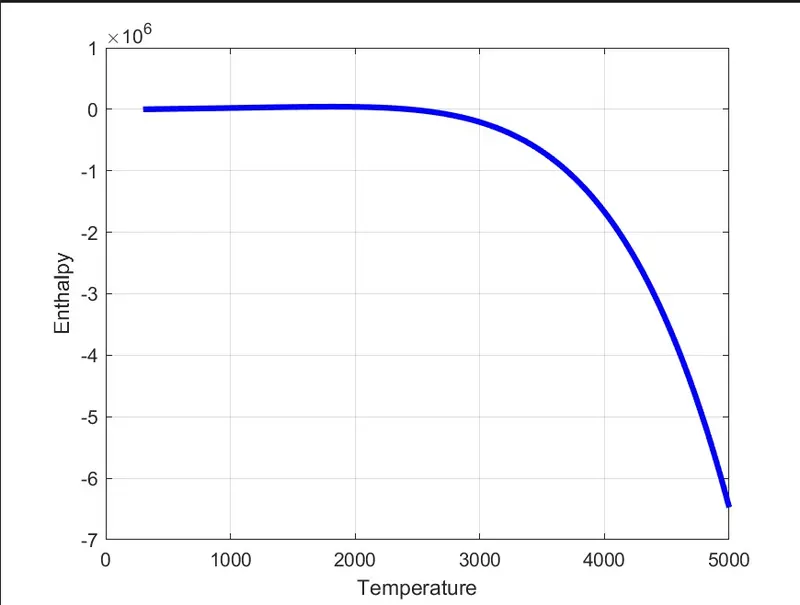
s vs T -plot
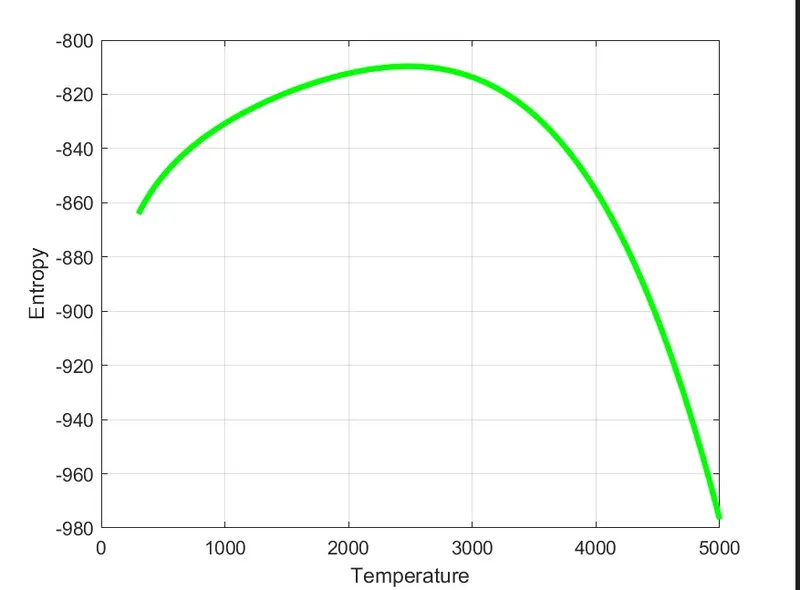
Output of Co2:
Cp vs T -plot
h vs T -plot
s vs T -plot
Screenshot of the molecuar weight of O2 , N2 and Co2 in the command window:
Conclusion:
On successful parsing of data from NASA Thermodynamic Data file, variation of thermodynamic properties with temperature of certain species of molecules are observed with the help of plots obtained.
References:
https://in.mathworks.com/help/matlab/ref/strfind.html
quora
etc...