Project 1 - Parsing NASA thermodynamic data
Aim:Write a function that extracts the 14 co-efficients and calculates the enthalpy, entropy and specific heats for all the species in the data file.
Program
clear all
close all
clc

f1=fopen('THERMO.dat','r');
fgetl(f1);

% Defining temperature values
templ = str2num(fgetl(f1));

global_low_temp = templ(1);
global_mid_temp = templ(2);
global_high_temp = templ(3);

% For skipping unwanted lines
 for i = 1:3
     fgetl(f1);
 end

 % Loop creation to read the values and plot molecular weight

 for i = 1:4:212
     line1 = fgetl(f1);

     l = strsplit(line1,' ');
     m = length(l);
     species = l{1};

      % Storing the values of the local temperature values
     low_temp = str2double(l(m-3));
     mid_temp = str2double(l(m-2));
     high_temp = str2double(l(m-1));

     % Storing the values of the second line of variables

     line2 = fgetl(f1);
     % Finding the position of E

     a = strfind(line2,'E');

     % Reading all the other variables
     a1 = str2double(line2(1:(a(1)+3)));
     a2 = str2double(line2((a(1)+4):(a(2)+3)));
     a3 = str2double(line2((a(2)+4):(a(3)+3)));
     a4 = str2double(line2((a(3)+4):(a(4)+3)));
     a5 = str2double(line2((a(3)+4):(a(5)+3)));

      % Storing the values of the 3rd line

     line3 = fgetl(f1);

     % Finding the position of E

     b = strfind(line3,'E');

     % Storing the values for the next set of variables
     a6 = str2double(line3(1:b(1)+3));
     a7 = str2double(line3((b(1)+4):(b(2)+3)));
     a8 = str2double(line3((b(2)+4):(b(3)+3)));
     a9 = str2double(line3((b(3)+4):(b(4)+3)));
     a10 = str2double(line3((b(4)+4):(b(5)+3)));

      % Storing ther values of the 4th line

      line4 = fgetl(f1);

      % Finding the position of E

     c = strfind(line4,'E');

     % Storing the values of variables in line 4

     a11 = str2double(line4(1:c(1)+3));
     a12 = str2double(line4((c(1)+4):(c(2)+3)));
     a13 = str2double(line4((c(2)+4):(c(3)+3)));
     a14 = str2double(line4((c(2)+4):(c(4)+3)));

      % Creating Temperature values for lower and higher temperature

     lower_temp = linspace(low_temp,mid_temp,100);
     higher_temp = linspace(mid_temp,high_temp,100);

     R = 8.314; % Universal Gas Constant

      % Calculating the values for cp, H and S using the given formulas
     for k = 1:100

         % lower temperature values for cp,h,s calculations
cp_low(k)=(a8+(a9*lower_temp(k))+(a10*(lower_temp(k)^2)+(a11*(lower_temp(k))^3)+a12*(lower_temp(k))^4))*R;
h_low(k)=(a8+(a9*lower_temp(k))/2+(a10*lower_temp(k)^2)/3+(a11*lower_temp(k)^3)/4+a12*(lower_temp(k)^4)/5+(a13/lower_temp(k)))*R*lower_temp(k);
s_low(k)=((a8*log(lower_temp(k))+(a9*lower_temp(k))+((a10*lower_temp(k)^2)/2)+((a11*lower_temp(k)^3)/3)+((a12*lower_temp(k)^4)/4)+a14)*R);


% higher temperature values for cp,h,s calculations
cp_high(k)=(a1+(a2*higher_temp(k))+(a3*(higher_temp(k)^2)+(a4*(higher_temp(k))^3)+a5*(higher_temp(k))^4))*R;
h_high(k)=(a1+(a2*higher_temp(k))/2+(a3*higher_temp(k)^2)/3+(a4*higher_temp(k)^3)/4+(a5*(higher_temp(k)^4))/5+(a6/higher_temp(k)))*R*higher_temp(k);
s_high(k)=((a1*log(higher_temp(k))+a2*higher_temp(k)+((a3*higher_temp(k)^2)/2)+((a4*higher_temp(k)^3)/3)+((a5*higher_temp(k)^4)/4)+a7)*R);

     end

% Making Folders for saving the plots

 nasa_graphs = species;
 mkdir(nasa_graphs);
 current = pwd;
 cd(nasa_graphs);

 % Plotting the graphs

 % For specific heat
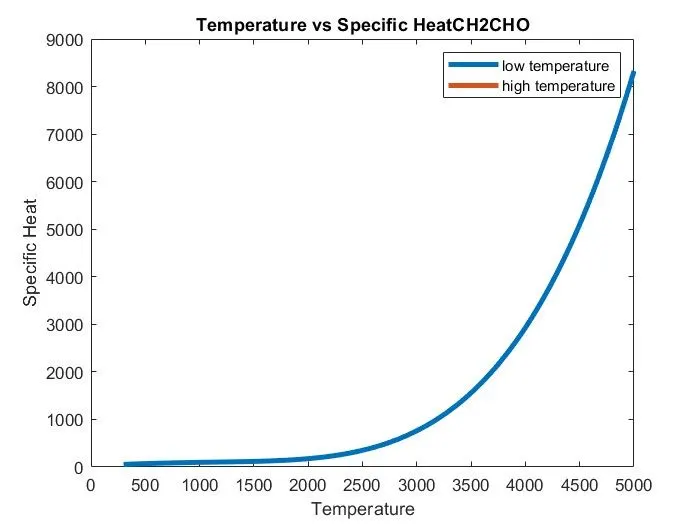
 figure(1)
 plot(lower_temp,cp_low,'linewidth',3)
 hold on
 plot(higher_temp,cp_high,'linewidth',3)
 hold off
 title(['Temperature vs Specific Heat',species])
 xlabel('Temperature');
 ylabel('Specific Heat');
 legend('low temperature','high temperature');
 fig = sprintf('Specific Heat of %s.png',species);
 saveas(gca,fig);

 % For Enthalpy
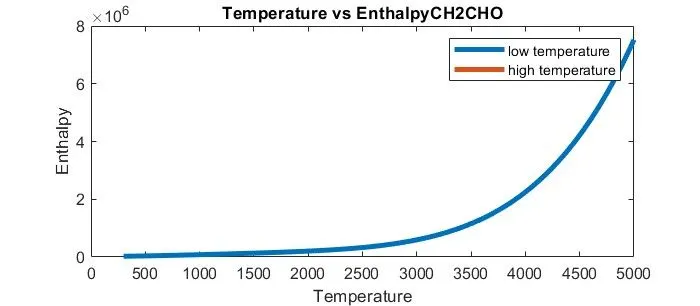
 figure(2)
 plot(lower_temp,h_low,'linewidth',3)
 hold on
 plot(higher_temp,h_high,'linewidth',3)
 hold off
 title(['Temperature vs Enthalpy',species])
 xlabel('Temperature');
 ylabel('Enthalpy');
 legend('low temperature','high temperature');
 fig = sprintf('Enthalpy of %s.png',species);
 saveas(gca,fig);

 % For Entropy
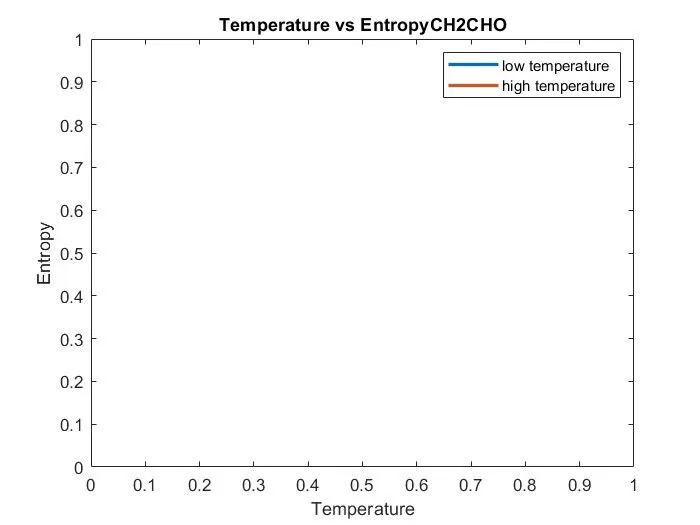
 figure(3)
 plot(lower_temp,s_low,'linewidth',2)
 hold on
 plot(higher_temp,s_high,'linewidth',2)
 hold off
 title(['Temperature vs Entropy',species])
 xlabel('Temperature');
 ylabel('Entropy');
 legend('low temperature','high temperature');
 fig = sprintf('Entropy of %s.png',species);
 saveas(gca,fig);
 cd(current)
 end

 % Calculating molecular weight

 atoms = ['H','C','N','R','S'];
 atom_weight = [1.00784 12.0109 16.002 39.065 32.067];
 mol_weight = 0;
 species_check = char(species);
 for i=1:length(species_check)
     for j=1:length(atoms)
         if (strcmp(species_check(i),atoms(j)))
             mol_weight = mol_weight + atom_weight(j);
             position = j;
         end
     end
 x = str2double(species_check(i));
 if x>1
      mol_weight = mol_weight + (atom_weight(j)*(x-1));
 end
 fprintf('Molecular weight of %s is : %f \n\',species_check,mol_weight)
 end
Explanation:
- program is started with fopen command to read the data file.using the fgetl command the lines in the data file are get in the program.
- For getting values for various species the program used loops for manipulating the values to an extent of the number of iterations that have to be taken into account
- the co-efficients are arranged ina fixed order and we have found the exact positiions with the help of strfind command in matlab and using the find variable to be E
- We have made a folder with the help of mkdir command.
- graphs were plotted for all the species of Cp vs T, h vs T, s vs T and all the graphs were saved using saveas command.
Graphs:

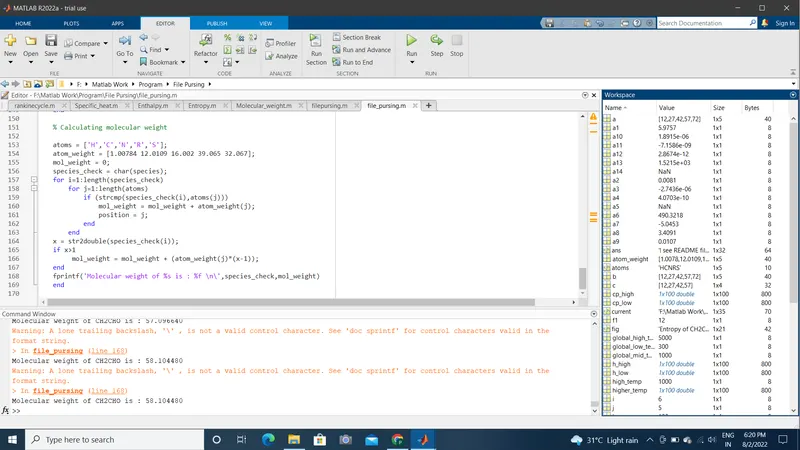
Molecular Waight is
Molecular weight of CH2CHO is : 58.104480