Project 1 - Parsing NASA thermodynamic data
Aim:
To write a code in Matlab to parse the NASA thermodynamic data file and then calculate the thermodynamic properties of various gas species.
Objective:
To write a function that extracts the 14 co-efficients and calculates the specific heat, enthalpy and entropy for all the species in the data file.
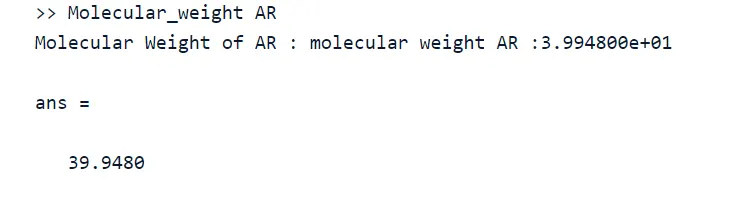
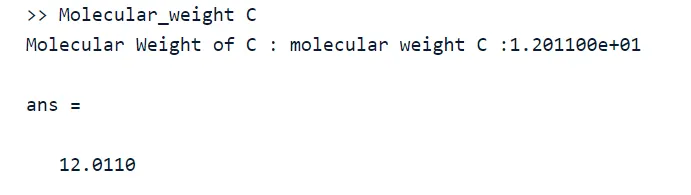
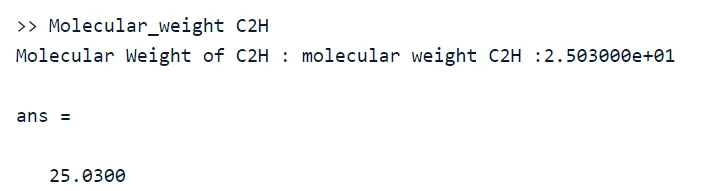
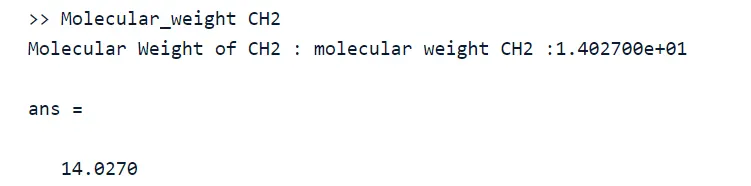
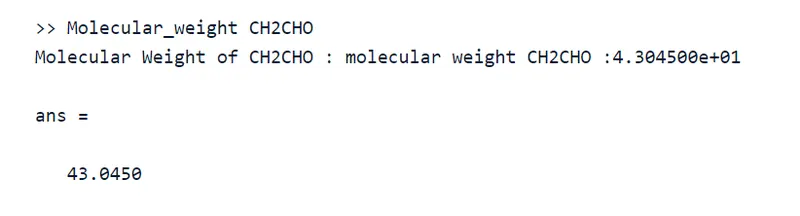
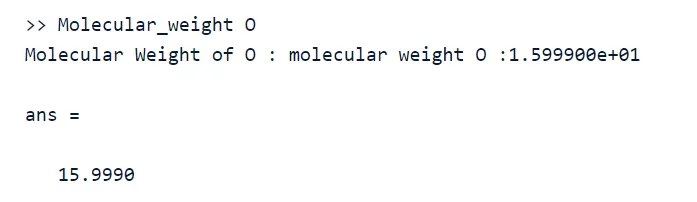
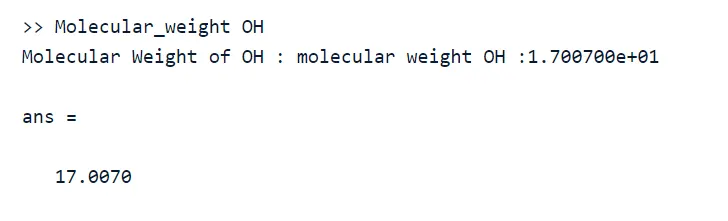
- To calculate the molecular weight of each species and display it in the command window.
- To plot Cp, Enthalpy and Entropy for the local temperature range (low temperature : high temperature) specific for each species.
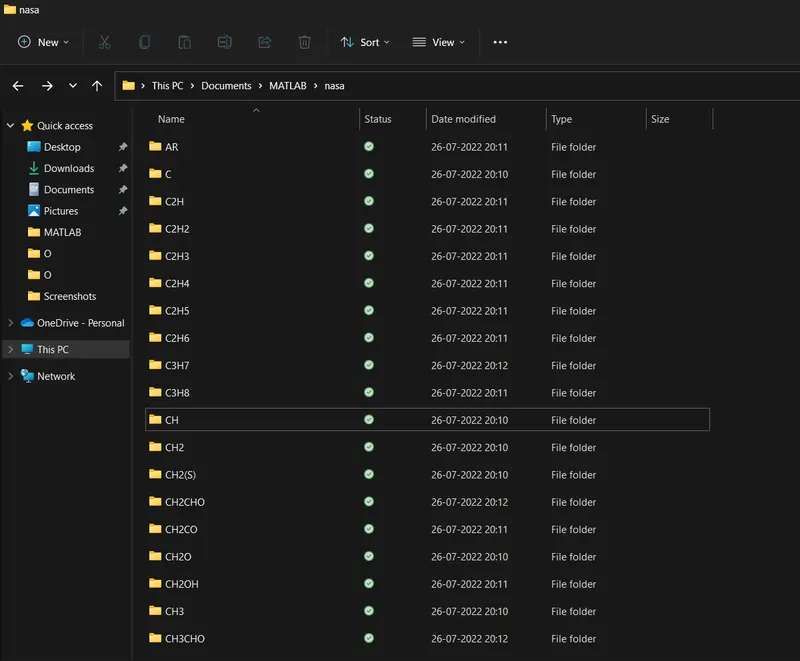
- To save the plots as images with appropriate names and dump them in separate folders for each species with suitable name and all these should be done automatically.
- The main program will just take the 'THERMO.dat' file as input and generate Cp, H and S plots.
Theory:
File Parsing:
It is the method of splitting the file or other input into a piece of data that can be easily stored or manipulated. By doing this we are going to split a string into parts then recognizing the parts to convert it into something simpler than a string.
Here in this project we are going to split the NASA thermodynamic data which is having 53 gas species values in 213 lines. To perform the calculation for thermodynamic properties, we need some sort of co-efficient values and temperature ranges which is available in the NASA file. So, we are going to parse the values which are all needed for our calculation from that file.
Specific Heat:
Specific heat is the amount of heat energy required to raise the temperature of body per unit of mass. Specific heat is also known as specific heat capacity or mass specific heat. In SI units, specific heat is the amount of heat in joules required to raise 1 gram of a substance 1 Kelvin.
Enthalpy:
When a substance changes at constant pressure, enthalpy tells how much heat and work was added or removed from the substance. Enthalpy is similar to energy but not the same. When a substance grows or shrinks, energy is used up or released.
Entropy:
The entropy of an object is a measure of the amount of energy which is unavailable to do work. Entropy is also a measure of the number of possible arrangements of atoms a system can have. In this sense, entropy is the measure of uncertainty or randomness.
Gas Constant:
The gas constant is a physical constant denoted by R and is expressed in terms of units of energy per temperature increment per mole. The gas constant value is equivalent to Boltzmann constant but expressed as the pressure-volume product instead of nergy per increment of temperature per particle.
Molecular Weight:
Molecular weight is a measure of the sum of the atomic weight values of the atoms in a molecule. Molecular weight is used in chemistry to determine stoichiometry in chemical reactions and equations.
Governing Equations:
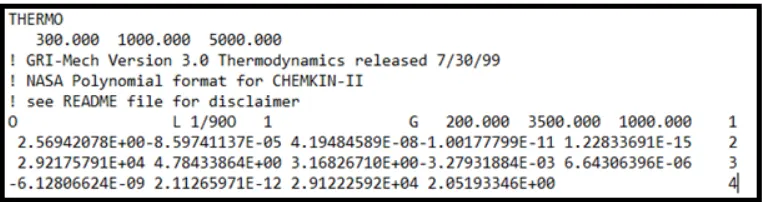
Sample NASA data:

where,
Cp = Specific Heat (J/K kg)
H = Enthalpy (J)
S = Entropy (J/K)
R = Universal gas constant = 8.314 (J/mol.K)
T = Temperature (K)
NASA Thermodynamic File
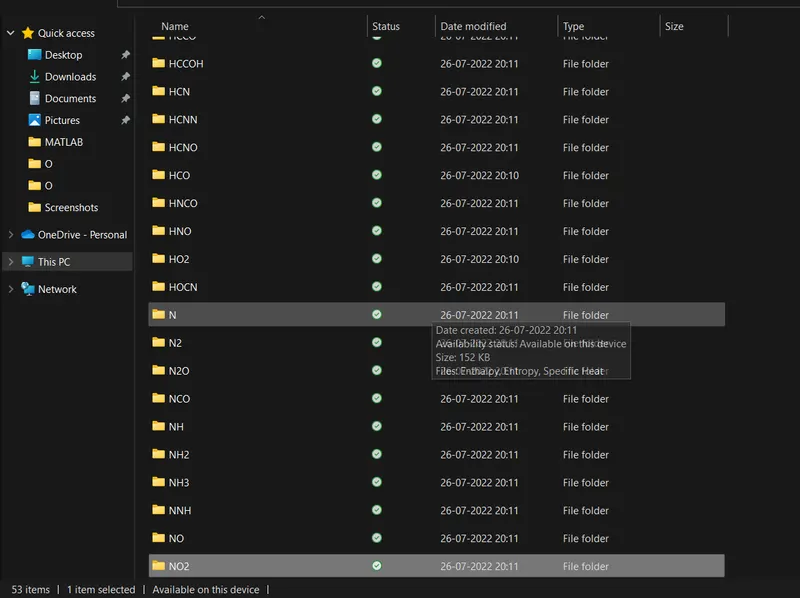
THERMO.dat file is a data file containing 14 coefficients for 53 different elements given by NASA. These coefficients are utilized to calculate the specific heat, enthalpy & entropy for a particular element. Each element has its own range of local temperature. Below screenshot of the THERMO.dat file is displayed.
List of 53 Elements contained in 'THERMO.dat' file:
AR C C2H C2H2 C2H3 C2H4
C2H5 C2H6 C3H7 C3H8 CH CH2
CH2(S) CH2CHO CH2CO CH2O CH2OH CH3
CH3CHO CH3O CH3OH CH4 CN CO
CO2 H H2 H2CN H2O H2O2
HCCO CCOH HCN HCNN HCNO HCO
HNCO HNO HO2 HOCN N N2
N2O NCO NH NH2 NH3 NNH
NO NO2 O O2 OH
Enthalpy, Entropy, and Specific Heat:
Enthalpy, entropy, and specific heat, of various species values at different temperatures are required extensively to analyze the thermodynamic process.
For example, if the combustion process is considered during this, these quantities are required to observe how the combustion is going on and how efficient it will be. It eventually allows seeking the scope of improvement in the process. Similarly in the other processes like refrigeration, air conditioning, chemical kinetics, nozzle flow, detonation process, etc, these quantities are widely involved to observe the phenomenon.
NASA came up with polynomials that can be used to evaluate thermodynamic properties such as Cp, H, and S. They have documented the coefficients that are required to evaluate these polynomials for 1000+ species.
The NASA polynomials have the form:
Cp/R = a1 + a2 T + a3 T^2 + a4 T^3 + a5 T^4
H/RT = a1 + a2 T /2 + a3 T^2 /3 + a4 T^3 /4 + a5 T^4 /5 + a6/T
S/R = a1 lnT + a2 T + a3 T^2 /2 + a4 T^3 /3 + a5 T^4 /4 + a7
Where R is the universal gas constant, T is the temperature and a1, a2, a3, a4, a5, a6, and a7 are the numerical coefficients supplied in the thermodynamic file. The FIRST 7 coefficients are HIGH-temperature coefficients (above 1000 K) and the SECOND 7 coefficients are LOW-temperature coefficients (below 1000 K).
1.CODE FOR SPECIFIC HEAT ;
function Cp = Specific_heat(a1,a2,a3,a4,a5,a8,a9,a10,a11,a12,T,R,tempmid)
 % calculating specific heat
 % calculating specific heat for higher and lower temperature repectively.
 if (T <= tempmid)
Cp = R*(a8 + (a9*T) + (a10*(T).^2) + (a11*(T).^3) + (a12*(T).^4));
 else
Cp = R*(a1 + (a2*T) + (a3*(T).^2) + (a4*(T).^3) + (a5*(T).^4));
 end
end
Explanation of the above code: -
- %Funtion for the Specific Heat - comments to make a program user friendly
- function [Cp] = Specific_heat(x1,x2,x3,x4,x5,x8,x9,x10,x11,x12,temp,gb_m,r) - function is used to make the code easy to implement ,it is a group of statements that together perform a task
- %Checking for the temperature -comments
- %The FIRST 7 coefficients are HIGH-temperature coefficients and the SECOND 7 coefficients are LOW-temperature coefficients
- if(temp<=gb_m) - comparing matrix values of the temperature generated from the linspace command with the global medium temperature
- Cp = r.*(x8 +(x9.*temp) +(x10*(temp).^2) + (x11*(temp).^3) + (x12*(temp).^4)); - calculation of the Specific heat wrt to the equations
- else - else statement to perform the task if the if statements fail
- Cp = r.*(x1 +(x2.*temp) +(x3*(temp).^2) + (x4*(temp).^3) + (x5*(temp).^4)); - calculation of the Specific heat wrt to the equations
- end
2. Entropy
function S = Entropy(a1,a2,a3,a4,a5,a7,a8,a9,a10,a11,a12,a14,T,R,tempmid)
 % calculating entropy
 % calculating entropy for higher and lower temperature repectively.
   if (T <= tempmid)
S = R*(a8.*log(T) + (a9*T) + ((a10*(T).^2)/2) + ((a11*(T).^3)/3) + ((a12*(T).^4)/4) + a14);
else
 S = R*(a1.*log(T) + (a2*T) + ((a3*(T).^2)/2) + ((a4*(T).^3)/3) + ((a5*(T).^4)/4) + a7);
    end
end
Explanation of the above code: -
-
%Funtion for the entropy - comments to make a program user friendly
-
function [S] = entropy_S(x1,x2,x3,x4,x5,x7,x8,x9,x10,x11,x12,x14,temp,gb_m,r) -
function is used to make the code easy to implement ,it is a group of statements that together perform a task
-
%Checking for the temperature -comments
-
%The FIRST 7 coefficients are HIGH-temperature coefficients and the SECOND 7 coefficients are LOW-temperature coefficients - comments
-
if(temp<=gb_m) - comparing matrix values of the temperature generated from the linspace command with the global medium temperature
-
S = r.*(x8.*log(temp) +(x9.*temp) +(x10*((temp).^2)/2) + (x11*((temp).^3)/3) + (x12*((temp).^4)/4) + (x14)); - calculation of the entropy wrt to the equations
-
else - else statement to perform the task if the if statements fail
-
S = r.*(x1.*log(temp) +(x2.*temp) +(x3*((temp).^2)/2) + (x4*((temp).^3)/3) + (x5*((temp).^4)/4) + (x7)); - calculation of the entropy wrt to the equations
-
end - to end or terminate the function
3. Enthalpy:
function H = Enthalpy(a1,a2,a3,a4,a5,a6,a8,a9,a10,a11,a12,a13,T,R,tempmid)
% calculating enthalpy
% calculating enthalpy for higher and lower temperature repectively.

if (T <= tempmid)
H = R*T.*(a8 + ((a9*T)/2) + ((a10*(T).^2)/3) + ((a11*(T).^3)/4) + ((a12*(T).^4)/5)+ ((a13./T)));
else
H = R*T.*(a1 + ((a2*T)/2) + ((a3*(T).^2)/3) + ((a4*(T).^3)/4) + ((a5*(T).^4)/5) +  ((a6./T)));
end
end
Explanation of the above code: -
-
%Funtion for the enthalpy - comments to make a program user friendly
-
function [H] = enthalpy_H(x1,x2,x3,x4,x5,x6,x8,x9,x10,x11,x12,x13,temp,gb_m,r) - function is used to make the code easy to implement ,it is a group of statements that together perform a task
-
%Checking for the temperature -comments
-
%The FIRST 7 coefficients are HIGH-temperature coefficients and the SECOND 7 coefficients are LOW-temperature coefficients - comments
-
if(temp<=gb_m) - comparing matrix values of the temperature generated from the linspace command with the global medium temperature
-
H = r*temp.*(x8 + ((x9*temp)/2) + ((x10*(temp).^2)/3) + ((x11*(temp).^3)/4) + ((x12*(temp).^4)/5) + ((x13./temp))); - calculation of the enthalpy wrt to the equations
-
else - else statement to perform the task if the if statements fail
-
H = r*temp.*(x1 + ((x2*temp)/2) + ((x3*(temp).^2)/3) + ((x4*(temp).^3)/4) + ((x5*(temp).^4)/5) + ((x6./temp))); - calculation of the enthalpy wrt to the equations
-
end - to terminate the function
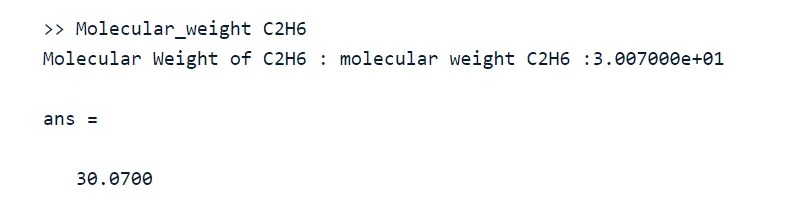
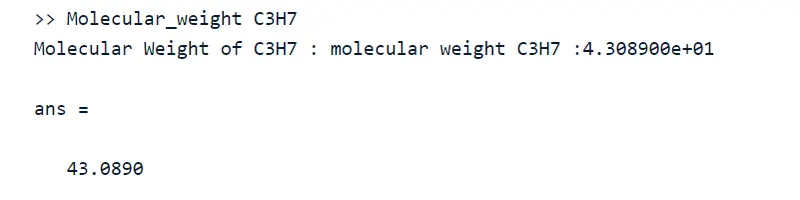
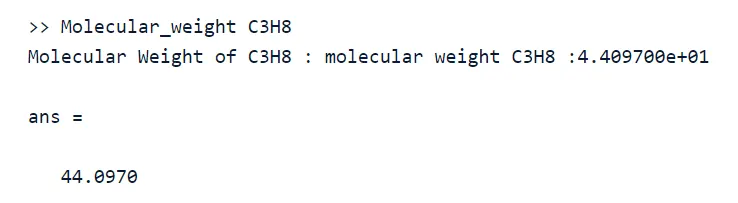
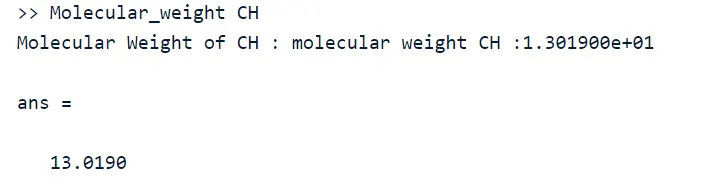
4.Molecular weight function:
function [molecular_wt] = Molecular_weight(species_name)

elements = ['H','C','N','O','A'];
atomic_wt = [1,12,14,16,40];
molecular_wt = 0;

for i = 1:length(species_name)
    for j = 1:length(elements)
        if strcmpi(species_name(i),elements(j))
            molecular_wt = molecular_wt + atomic_wt(j);
            position = j;
        end
    end
    f = str2double(species_name(i));
    if f>1
        molecular_wt = molecular_wt + atomic_wt(position)*(f-1);
    end
end
sprintf('The molecular weight of %s is %d', species_name, molecular_wt)
end
Explanation of the above code: -
- %function calculate molecular mass - comments to make a program user friendly
- function mw = mol_wt(sp_name)
- %storing value - comments to make a program user friendly
- compound_name = (sp_name)
- key_at = ['C','H','O','N','A']; - creating an array of elements
- %storing the atomic mss value in the array - comments to make a program user friendly
- value_at = [12.0107 1.00794 15.994 14.0067 39.948]; - storing the atomic mass value in the array
- mw =0 ; -asssigning molecular mass as 0
- %creating for loop to perform the task - comments to make a program user friendly
- for i = 1:length(compound_name) - creating for loop to execute till the elements lenght
- for j = 1:length(key_at) - creating for loop to execute till the key_at array length
- %comparing the string value - comments to make a program user friendly
- if strcmp(compound_name(i),key_at(j)) - comparing the string value of the species name and the elemts in the array key_at
- %if above comparision is true value of molecular mass is - comments
- %calculated- comments
- mw =mw + value_at(j); - molecular mass calculation
- %storing the position for further use- comments
- pos = j; - storing the position
- end - to terminate the if statement
- end - to terminate the inner for j loop
- k = str2num(compound_name(i)); - converting the srting to number
- %comparing if the value of k is greater than executed the further statements- comments
- if(k>1)
- %molecular mass calculation mw = mw + value_at(pos)*(k-1);- comments
- end - to terminate the if statement
- end- to terminate the outer for i loop
- %command to print the molecular masss of the molecule- comments
- fprintf('Molecular Weight of the species %s is %f',compound_name ,mw) - to print the species name and value
- end - to terminate the function
MAIN CODE :
clear all
close all
clc

%input
R = 8.314; %gas constant(J/(mol-k))
%reading data file
%open & read THERMO.dat file
f1 = fopen('THERMO.dat','r');
get = fgetl(f1);
%now reading temperature from this file
temp = fgetl(f1);
%splitting
s = strsplit(temp);
%converting strings cells into numbers
templow = str2num(s{2});
tempmid = str2num(s{3});
temphigh = str2num(s{4});
%temperature range
T = linspace(templow,temphigh,1000);
%skipping comment lines
for i=1:3
 get = fgetl(f1);
end

 %reading the species
 for j =1:53
 tline =fgetl(f1);
 A = strsplit(tline,' ');
 species_name =A{1};
%converting strings cells into numbers
lowtemp = str2double(A{end - 3});
midtemp = str2double(A{end - 2});
hightemp = str2double(A{end -1});

tline1 = fgetl(f1);
a = strfind(tline1,'E');

%finding first 7 higher and second lower coefficients
%finding the higher coefficients
a1 = tline1(1:a(1)+3);
a1 = str2num(a1);
a2 = tline1(a(1)+4:a(2)+3);
a2 = str2num(a2);
a3 = tline1(a(2)+4:a(3)+3);
a3 = str2num(a3);
a4 = tline1(a(3)+4:a(4)+3);
a4 = str2num(a4);
a5 = tline1(a(4)+4:a(5)+3);
a5 = str2num(a5);

tline2 = fgetl(f1);
b = strfind(tline2,'E');
a6 = tline2(1:b(1)+3);
a6 = str2num(a6);
a7 = tline2(b(1)+4:b(2)+3);
a7 =str2num(a7);

%finding lower coefficients
a8 = tline2(b(2)+4:b(3)+3);
a8 = str2num(a8);
a9 = tline2(b(3)+4:b(4)+3);
a9 = str2num(a9);
a10 = tline2(b(4)+4:b(5)+3);
a10 = str2num(a10);

tline3 = fgetl(f1);
c = strfind(tline3,'E');
a11 = tline(1:c(1)+3);
a11 = str2num(a11);
a12 = tline3(c(1)+4:c(2)+3);
a12 = str2num(a12);
a13 = tline3(c(2)+4:c(3)+3);
a13 = str2num(a13);
a14 = tline3(c(3)+4:c(4)+3);
a14 = str2num(a14);
%calculate specific heat
cp = Specific_heat(a1,a2,a3,a4,a5,a8,a9,a10,a11,a12,T,R,tempmid);

%calculating entropy
S = Entropy(a1,a2,a3,a4,a5,a7,a8,a9,a10,a11,a12,a14,T,R,tempmid)

%calculating enthalpy
H = Enthalpy(a1,a2,a3,a4,a5,a6,a8,a9,a10,a11,a12,a13,T,R,tempmid)

%writing molecular weight file
 [molecular_wt] = Molecular_weight(species_name)
%plotting cp,H & s with temperature

%saving in a folder
        cd('C:\Users\Madhu\OneDrive\Documents\MATLAB\nasa')
        mkdir(species_name);  %creating directory
    cd(species_name);
     % Plot 1 Cp vs T
    figure(1)
    plot(T,cp,'linewidth',2,'color','b');
    xlabel('Temperature(K)');
    ylabel('Specific Heat(KJ)');
    title(sprintf('Specific heat vs Temperature range of %s',species_name));
    grid on
    saveas(figure(1),'Specific Heat.jpg');

    % Plot 2 S vs T
    figure(2)
    plot(T,S,'linewidth',2,'color','r');
    xlabel('Temperature');
    ylabel('Entropy(KJ/mol-K)');
    title(sprintf('Entropy vs Temperature range of %s',species_name));
    grid on
    saveas(figure(2),'Entropy.jpg');

    % Plot 3 Cp vs T
    figure(3)
    plot(T,H,'linewidth',2,'color','g');
    xlabel('Temperature');
    ylabel('Enthalpy(KJ/mol)');
    title(sprintf('Enthalpy vs Temperature range of %s',species_name));
    grid on
    saveas(figure(3),'Enthalpy.jpg');

    cd('C:\Users\Madhu\OneDrive\Documents\MATLAB\O\O\O\O')  %Changing directory to Original matlab path

    % Molecular weight
    W = Molecular_weight(species_name);

end
Explanation of the above CODE: -
-
%File Parsing for a file - comments to make a program user friendly
-
clc - to clear the command window
-
clear all - to clear all the workspace variables
-
close all - to close all the output window
-
f1 = fopen('THERMO.dat','r'); - command to open a file in read mode
-
first_line = fgetl(f1); - to read file line by line
-
%R is the universal gas constant J/(mol-K)
-
R = 8.314; - constant
-
temp = fgetl(f1); - to save the line in the temp variable
%Reading text from headerfile - comments to make a program user friendly
%Reading the global temperature from the next line -
A = strsplit(temp,' '); - to split the line saved in temp variable when space(' ') is found
%Cell array is generated 1x4 cell array
-
glob_lowtemp = str2num(A{2}); - assigning the global lower temperature
-
glob_midtemp = str2num(A{3});- assigning the global middle temperature
-
glob_hightemp =str2num(A{4});- assigning the global high temperature
%Temperature range
-
Temperature = linspace(glob_lowtemp,glob_hightemp,1000); - command to generate the 1000 values between the range of temperature
%skipping the three comment lines -
for j =1:3; - for skipping the comments line by running loop
-
k =fgetl(f1); - to read the comments line
-
end - end of the for loop
%running for loop fopr 53 times as there are 53 species -
for i = 1:53; - for loop to parse the file and create plot for 53 molecules in the file
%Parsing of the species block -comments to make a program user friendly
-
tline = fgetl(f1); - reading the first line for a molecule
-
S =strsplit(tline,' '); - splitting the string when the space is found by the command
-
Species_name =S{1}; - extracting the name of the molecule
%Extracting the coefficients from first line
-
line2 =fgetl(f1); - reading the first line of the coefficients
-
x =findstr(line2,'E'); - finding the string using the command
%Finding the 5 coefficient
-
x1 = line2(1:x(1)+3); - Extracting the 1st coefficients from the line
-
x1 = str2num(x1); - converting the string coefficients extracted above to number
-
x2 = line2(x(1)+4:x(2)+3); - Extracting the 2nd coefficients from the line
-
x2 = str2num(x2); - converting the string coefficients extracted above to number
-
x3 = line2(x(2)+4:x(3)+3); - Extracting the 3rd coefficients from the line
-
x3 = str2num(x3); - converting the string coefficients extracted above to number
-
x4 = line2(x(3)+4:x(4)+3); - Extracting the 4th coefficients from the line
-
x4 = str2num(x4); - converting the string coefficients extracted above to number
-
x5 = line2(x(4)+4:x(5)+3); - Extracting the 5th coefficients from the line
-
x5 = str2num(x5); - converting the string coefficients extracted above to number
-
%line3 5coefficients
-
line3 = fgetl(f1); - reading the line of the coefficients
-
x = findstr(line3,'E');- finding the string using the command
-
x6 = line3(1:x(1)+3); -Extracting the 6th coefficients from the line
-
x6 = str2num(x6); - converting the string coefficients extracted above to number
-
x7 = line3(x(1)+4:x(2)+3);-Extracting the 7th coefficients from the line
-
x7 = str2num(x7); - converting the string coefficients extracted above to number
-
x8 = line3(x(2)+4:x(3)+3);-Extracting the 8th coefficients from the line
-
x8 = str2num(x8); - converting the string coefficients extracted above to number
-
x9 = line3(x(3)+4:x(4)+3);-Extracting the 9th coefficients from the line
-
x9 = str2num(x9); - converting the string coefficients extracted above to number
-
x10 = line3(x(4)+4:x(5)+3);-Extracting the 10th coefficients from the line
-
x10 = str2num(x10); - converting the string coefficients extracted above to number
%Line4 4coefficients
-
line4=fgetl(f1); - reading the line of the coefficients
-
x = findstr(line4,'E');- finding the string using the command
-
x11 = line4(1:x(1)+3);-Extracting the 11th coefficients from the line
-
x11 = str2num(x11); - converting the string coefficients extracted above to number
-
x12 = line4(x(1)+4:x(2)+3);-Extracting the 12th coefficients from the line
-
x12 = str2num(x12); - converting the string coefficients extracted above to number
-
x13 = line4(x(2)+4:x(3)+3);-Extracting the 13th coefficients from the line
-
x13 = str2num(x13); - converting the string coefficients extracted above to number
-
x14 = line4(x(3)+4:x(4)+3);-Extracting the 14th coefficients from the line
-
x14 = str2num(x14); - converting the string coefficients extracted above to number
% Entropy Calculation -
S = entropy_S(x1,x2,x3,x4,x5,x7,x8,x9,x10,x11,x12,x14,Temperature,glob_midtemp,R);
%Cp calculation means Specific Heat calculation
-
Cp = Specific_heat(x1,x2,x3,x4,x5,x8,x9,x10,x11,x12,Temperature,glob_midtemp,R);
%Enthlpy Calculaion is H
-
H = enthalpy_H(x1,x2,x3,x4,x5,x6,x8,x9,x10,x11,x12,x13,Temperature,glob_midtemp,R);
%Molecular Weight calculation of different elements
-
mw(i) = mol_wt(Species_name);
%Reading and writinh of the molecular wieght in the list of molecular
%wieght -
% Plotting on the graph for species fo the temperature and specific
% heat%Creating a folder for saving the species with its properties
-
directory_curr = pwd; - pwd identify the current directory
-
mkdir(Species_name); - command used for making a new directory
-
cd(Species_name); - cd is for changing the directory
%Plotting the graph in different plotting window
%plot 1 for the temperature and entrophy
%plot 2 for the temperature and enthalphy
%plot 3 for the temperature and specific heat
%plot 1 Enthalphy and Temperaure -
figure(1) - to open the first figure window
-
plot(Temperature,H,'linewidth',3,'color','b'); -plot between temperature and enthalpy
-
xlabel('Temperature in [K]'); - for labelling the x axis
-
ylabel('Enthalphy [KJ/mol]'); - for labelling the y axis
-
grid on - to make the grid on
-
title(sprintf('Variation in Enthalphy wrt Temperature %s',Species_name)); - to give the title to the plot
-
saveas (figure(1),'Enthalhy.jpg'); - to save the plot as jpg file in the folder made
%plot 2 Entropy and Temperaure
-
figure(2) - to open the second figure window
-
plot(Temperature,S,'linewidth',3,'color','r'); -plot between temperature and entropy
-
xlabel('Temperature in [K]'); - labeling of the xaxis
-
ylabel('Entropy [KJ/mol-k]'); - labelling the y axis
-
grid on - to make the grid on
-
title(sprintf('Variation in Entropy wrt Temperature %s',Species_name));- to give the title to the plot
-
saveas (figure(2),'Entropy.jpg'); - to save the plot as jpg file in the folder made
%plot 3 Specific Heat and Temperaure
-
figure(3) - - to open the third figure window
-
plot(Temperature,Cp,'linewidth',3,'color','g');plot between temperature and specific heat
-
xlabel('Temperature in [K]'); - labeling of the xaxis
-
ylabel('Specific Heat [KJ]');- labelling the y axis
-
grid on- to make the grid on
-
title(sprintf('Variation in Specific Heat wrt Temperature %s',Species_name));- to give the title to the plot
-
saveas (figure(3),'Specific Heat.jpg'); - to save the plot as jpg file in the folder made
-
cd(directory_curr); - to change the directory
-
end to end the for loop
Syntax Used during Coding
|
Fopen : |
Open a file or obtain information about open files |
|
‘r’ : |
Open the file for reading |
|
fgetl |
Read line from file |
|
strsplit |
Split string or character vector at specified delimiter |
|
str2num |
Convert character array or string to numeric array |
|
strfind |
Find one string within another |
|
linspace |
Generate linearly spaced vectors |
|
fprintf |
Write formatted data to file |
|
pwd |
Identify current directory |
|
mkdir |
Make new directory |
|
cd |
Change working directory |
OUTPUT:
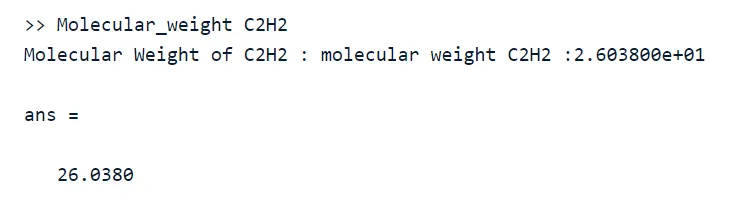
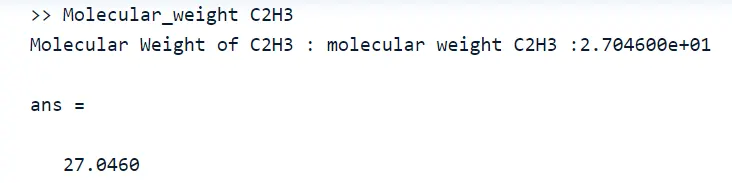
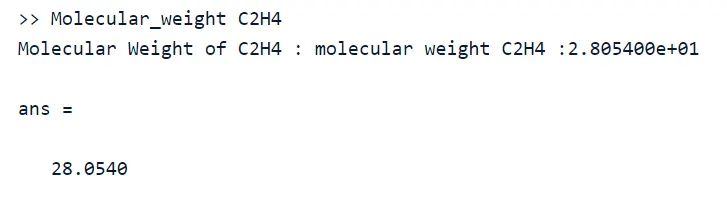
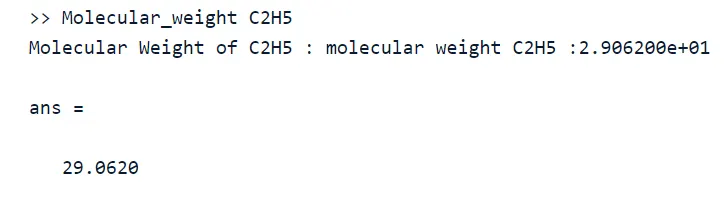
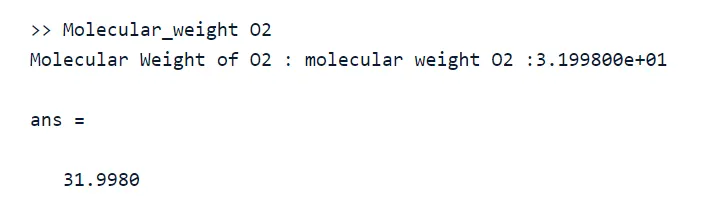
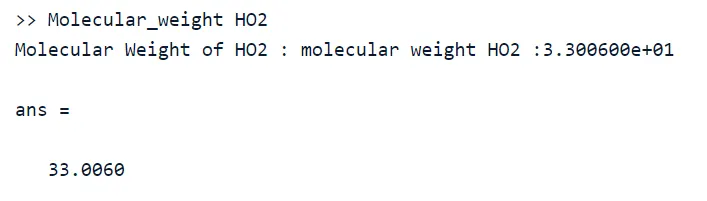
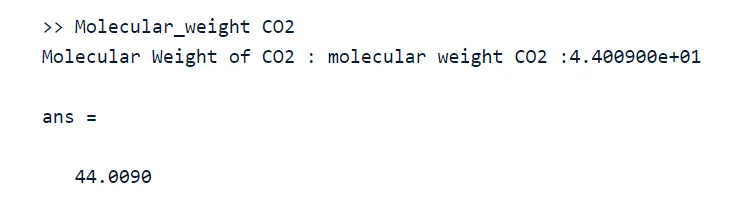
Attachment:
Screenshot of the window where all the folders are saved. :

Results:
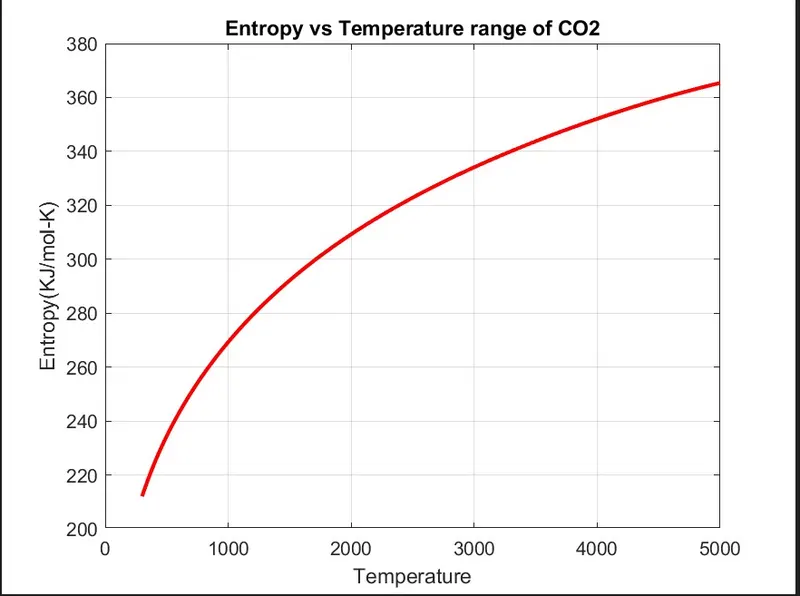
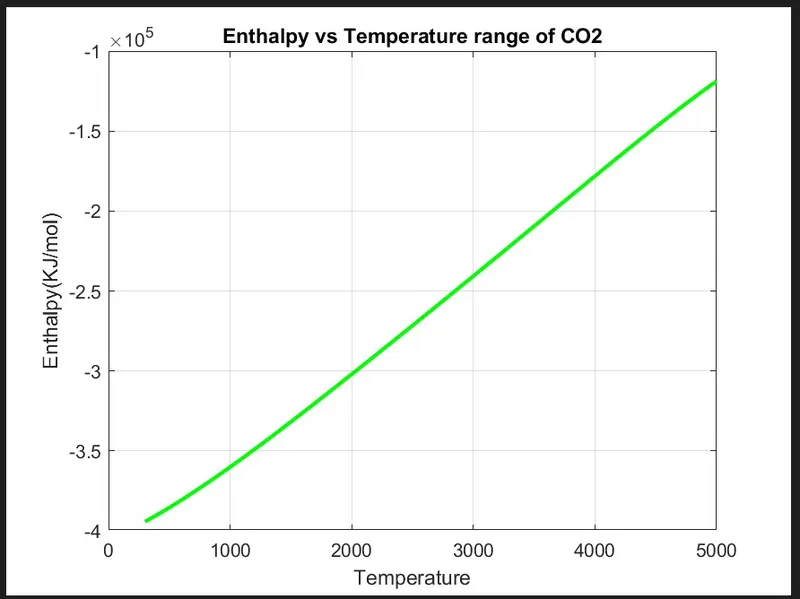
Specific Heat, Entropy and Enthalpy Plots for O2, N2 and Co2 species :
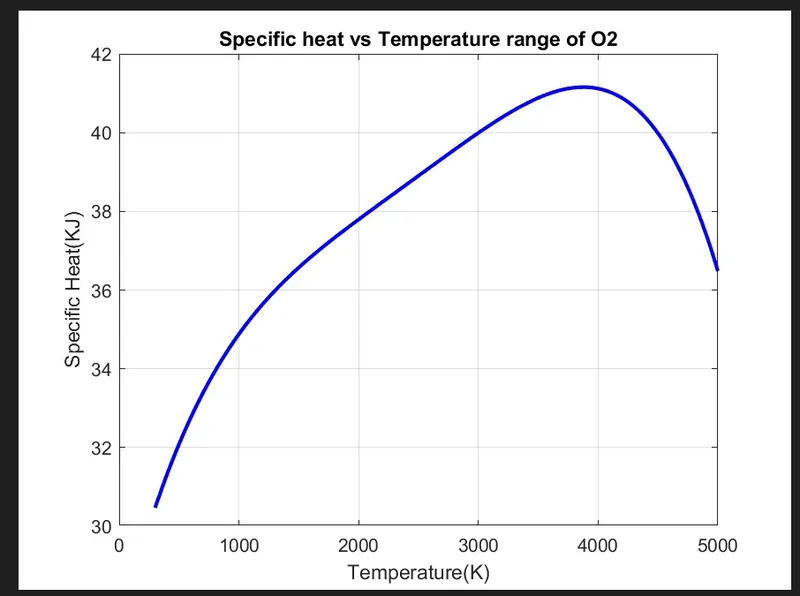
1. Plots for O2
a. Variation of Specific heat with the temperature of O2
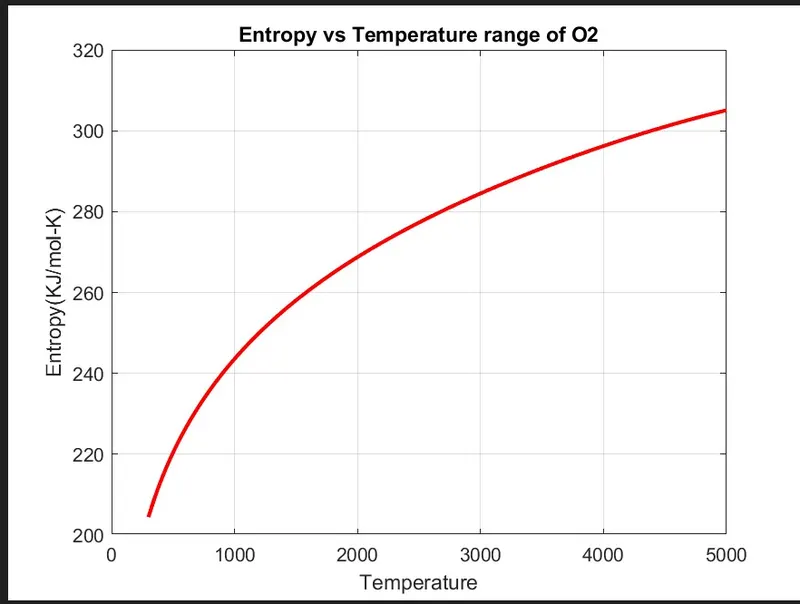
b. Variation of Entropy with the temperature of O2
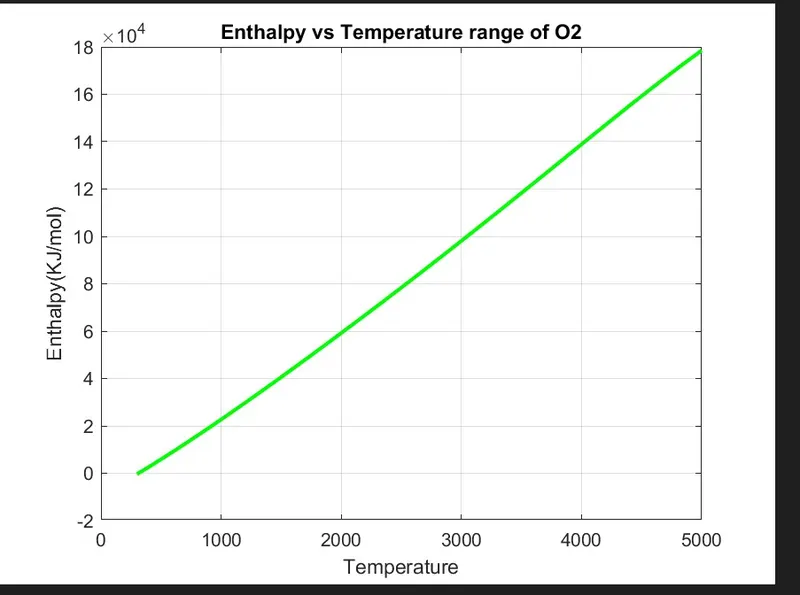
c. Variation of Enthalpy with the temperature of O2
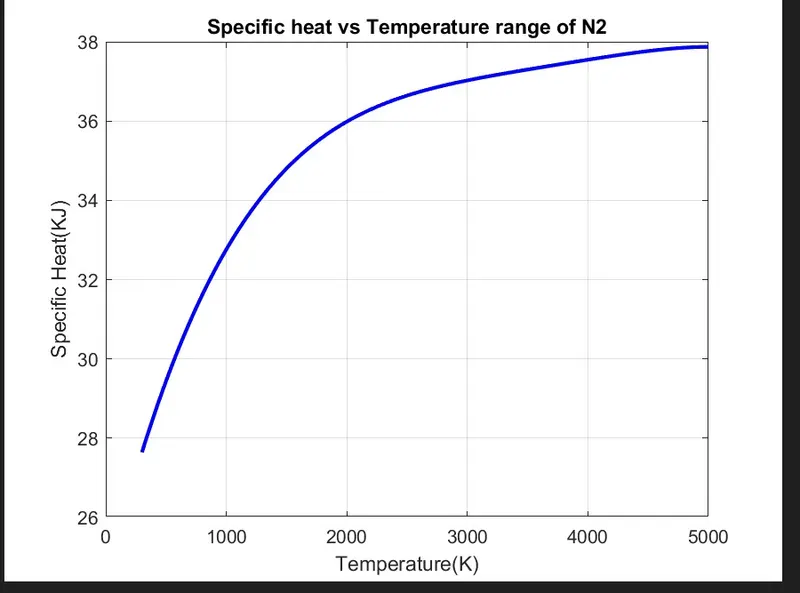
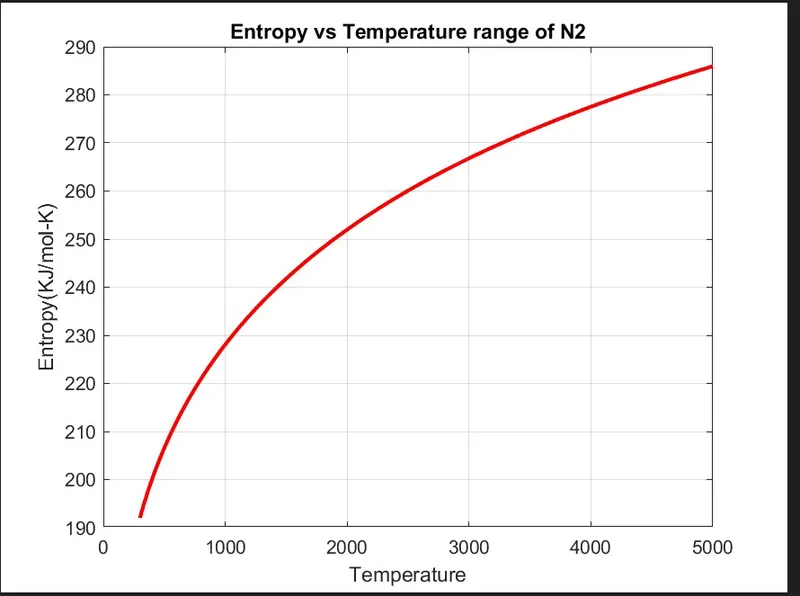
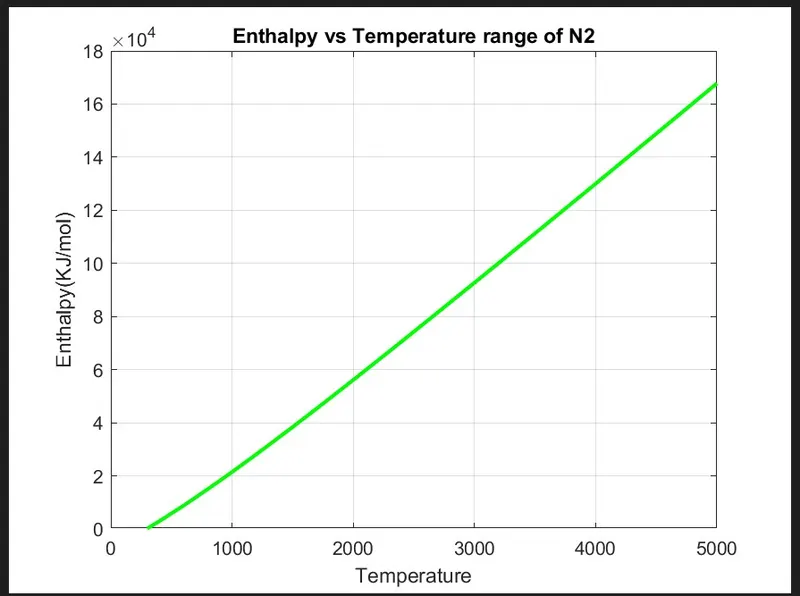
2. Plots for N2 :
a. Variation of Specific heat with the temperature of N2
b. Variation of Entropy with temperature of N2
c. Variation of Enthalpy with the temperature of N2
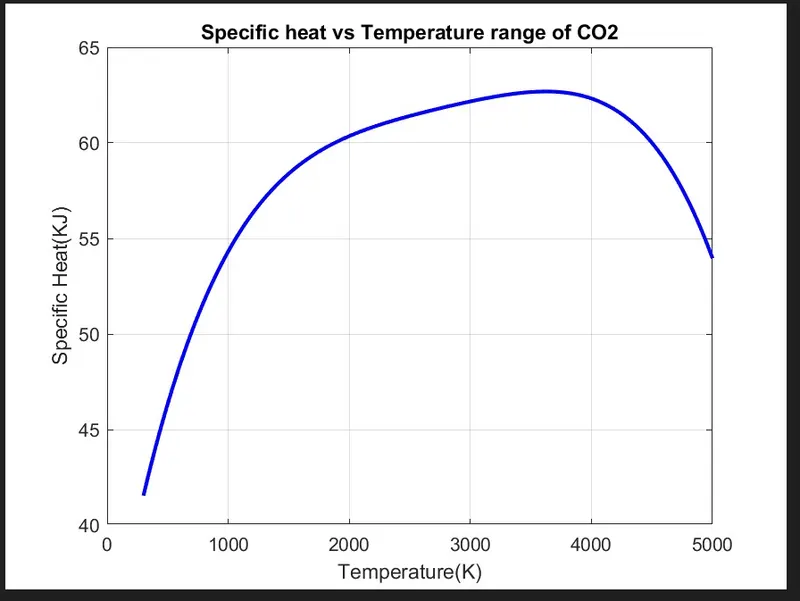
3. Plots for Co2 :
a. Variation of Specific heat with the temperature of Co2
b. Variation of Entropy with the temperature of CO2
c. Variation of Enthalpy with the temperature of CO2
Conclusion :
Using MATLAB code, the necessary coefficients required to evaluate various thermodynamic parameters for different species are extracted from NASA thermodynamic data file. The specific heat, enthalpy, and entropy for all the species are calculated and plotted against the local temperature range. The molecular weight is calculated for all the species.
References :
https://in.mathworks.com/help/matlab/ref/mkdir.html
https://in.mathworks.com/matlabcentral/answers/317006-create-new-folders-by-mkdir
https://in.mathworks.com/help/matlab/ref/saveas.html
https://in.mathworks.com/matlabcentral/answers/17580-how-to-define-a-path-in-saveas-command
https://in.mathworks.com/help/matlab/ref/msgbox.html
https://in.mathworks.com/matlabcentral/answers/151692-display-value-in-message-box
https://in.mathworks.com/help/matlab/ref/fprintf.html
https://in.mathworks.com/help/matlab/ref/sprintf.html
http://combustion.berkeley.edu/gri-mech/data/nasa_plnm.html
https://ntrs.nasa.gov/archive/nasa/casi.ntrs.nasa.gov/19940013151.pdf
https://link.springer.com/chapter/10.1007/978-1-4684-0186-8_8