Project 1 - Parsing NASA thermodynamic data
Aim : To write function that extracts the 14 co-efficients and To calculate the enthalpy, entropy and specific heats for all the species in the data file.
Explanation :
File parsing : It deals with the field of computational linguistics where it commonly defines the natural language processing.
parser helps to split the large input data into smaller data and will process the data and parsing helps to automate the certain things, and also reduces the human effort.
here the given formulae,
Cp = (a1 + a2*T + a3*T^2 + a4*T^3 + a5*T^4)*R
H = (a1 + a2*T/2 + a3*T^2/3 + a4*T^3/4 + a5*T^4/5 + a6/T)*R*T
S =( a1*logT + a2*T + a3*T^2/2 + a4*T^3/3 + a5*T^4/4 + a7)*R
here Cp is specific heat
H is Enthalpy
S is Entropy
T is temperature
R is universal gas constant
using this formulae we have to find required values and plots and graphs
Code :
close
clear
clc

% file reading

f1 = fopen('THERMO.dat','r');

for i = 1:5
    fgetl(f1)
end

for j =1:53
a = fgetl(f1);

b = strsplit(a,' ');

species_name = b{1};

low_temp = str2double(b{end-3});
high_temp = str2double(b{end-2});
mid_temp = str2double(b{end-1});


% Extracting the coefficients
% getting first line coefficients(a1-a5)
line_1 = fgetl(f1);
a=strfind(line_1,'E');
a1=str2double(line_1(1:a(1)+3));
a2=str2double(line_1(a(1)+4:a(2)+3));
a3=str2double(line_1(a(2)+4:a(3)+3));
a4=str2double(line_1(a(3)+4:a(4)+3));
a5=str2double(line_1(a(4)+4:a(5)+3));

% Getting second line coefficients (a6-a10)
line_2 = fgetl(f1);
a_1=strfind(line_2,'E');
a6=str2double(line_2(1:a_1(1)+3));
a7=str2double(line_2(a_1(1)+4:a_1(2)+3));
a8=str2double(line_2(a_1(2)+4:a_1(3)+3));
a9=str2double(line_2(a_1(3)+4:a_1(4)+3));
a10=str2double(line_2(a_1(4)+4:a_1(5)+3));

% Getting third line coefficients(a11-a14)
line_3=fgetl(f1);
a_2=strfind(line_3,'E');
a11=str2double(line_3(1:a_2(1)+3));
a12=str2double(line_3(a_2(1)+4:a_2(2)+3));
a13=str2double(line_3(a_2(2)+4:a_2(3)+3));
a14=str2double(line_3(a_2(3)+4:a_2(4)+3));

% calculations for specific heat,Enthalpy,Entropy(Cp,H,S)

T = linspace(low_temp,high_temp,100);
for i = 1 : length(T)
    if(T(i)<=(mid_temp))
        T1(i)=T(i);
    else
        T2(i)=T(i);
    end
end


ltr = T1;
d = length(ltr);
htr = T2((d+1):100);
R = 8.314;


CP1 = (a1 + a2*htr + a3*htr.^2 + a4*htr.^3 + a5*htr.^4)*R;
H1 = (a1 + (a2*htr)/2 + (a3*htr.^2)/3 + (a4*htr.^3)/4 + (a5*htr.^4)/5 + (a6./htr))*R.*htr;
S1 = (a1*log(htr) + a2.*htr + (a3*htr.^2)/2 + (a4*htr.^3)/3 + (a5*htr.^4)/4 + a7)*R;

CP2 = (a8 + a9*ltr + a10*ltr.^2 + a11*ltr.^3 + a12*ltr.^4)*R;
H2 = (a8 + (a9*ltr)/2 + (a10*ltr.^2)/3 + (a11*ltr.^3)/4 + (a12*ltr.^4)/5 + (a13./ltr))*R.*ltr;
S2 = (a8*log(ltr) + a9.*ltr + (a10*ltr.^2)/2 + (a11*ltr.^3)/3 + (a12*ltr.^4)/4 + a14)*R;

% combining both cp1 and cp2
        CP= [CP1,CP2];
        H = [H1,H2];
        S = [S1,S2];

% creating folder
mkdir(['C:\Users\palle\Downloads\File parsing\',species_name])

% plotting
figure(1)

plot(T,CP);
xlabel('Temperature');
ylabel('Specific heat');
title('Temperature vs Specific heat');

figure(2)

plot(T,H);
xlabel('Temperature(K)');
ylabel('Enthalpy(j)');
title('Temperature vs Enthalpy');

figure(3)

plot(T,S);
xlabel('Temperature(K)');
ylabel('Entropy(j/k)');
title('Temperature vs Entropy');


cd(['C:\Users\palle\Downloads\File parsing\',species_name])

saveas(1,'Specific heat vs Temperature','jpg')
saveas(2,'Enthalpy vs Temperature','jpg')
saveas(3,'Entropy vs Temperature','jpg')

% Molecular weight calculation
 mol_mass = molecular_wight(species_name);

end
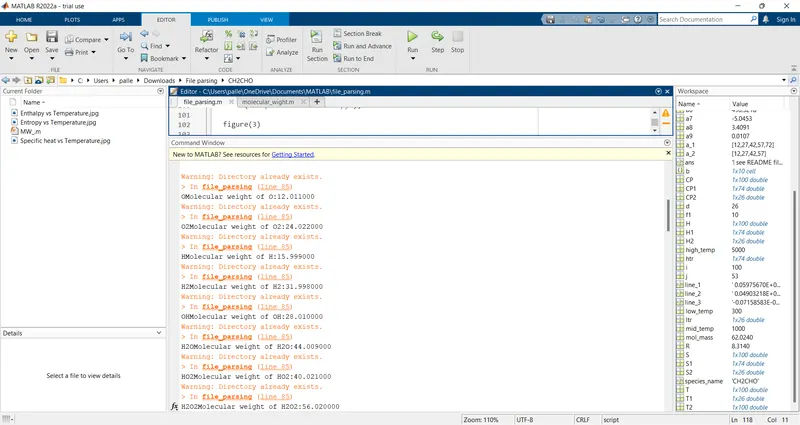
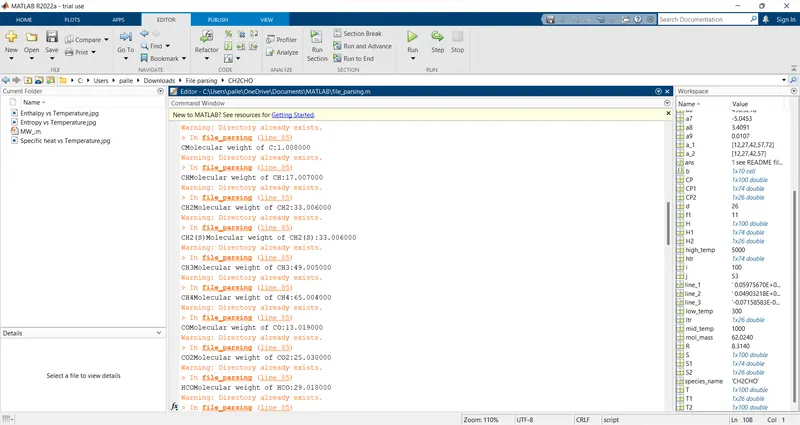
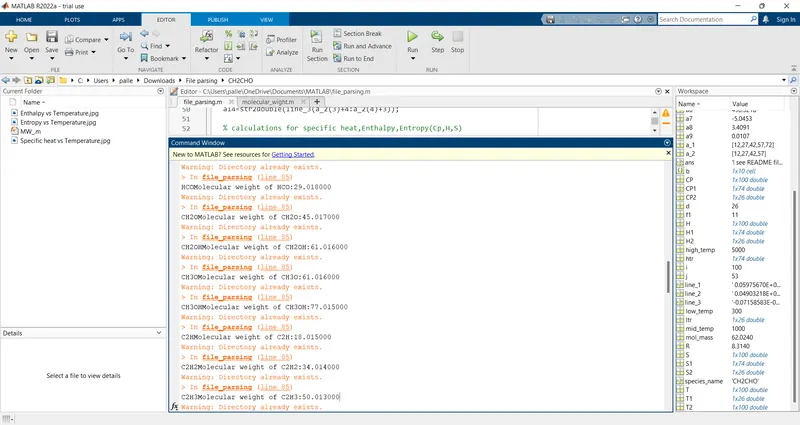
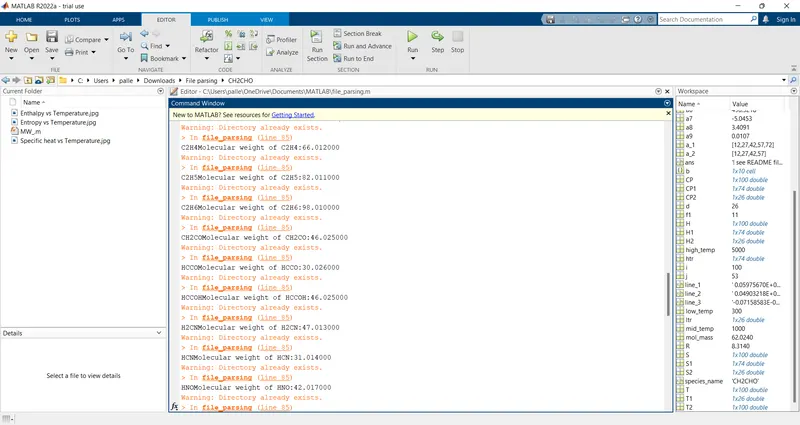
Objective : To write a program to calculate Molecular weight for 53 species
code :
% function to find molecular weight

function [mol_mass]= molecular_wight(species_name)
fprintf(species_name)


elements = ['H','C','O','N','A'];
atomic_weight = [15.999 1.008 12.011 14.007 39.948];
mol_mass = 0;
for l = 1:length(species_name)
    for j=1:length(atomic_weight)
        if strcmp(species_name(l),elements(j))
            mol_mass = mol_mass+atomic_weight(j);
            position = j;
        end
    end

    n = str2double(species_name(l));
    if n>1
        mol_mass = mol_mass+(atomic_weight(position)*(n-1));
    end
end
fprintf('Molecular weight of %s:',species_name)
fprintf('%f',mol_mass);
disp(' ')

end
Molecular weight for all species :
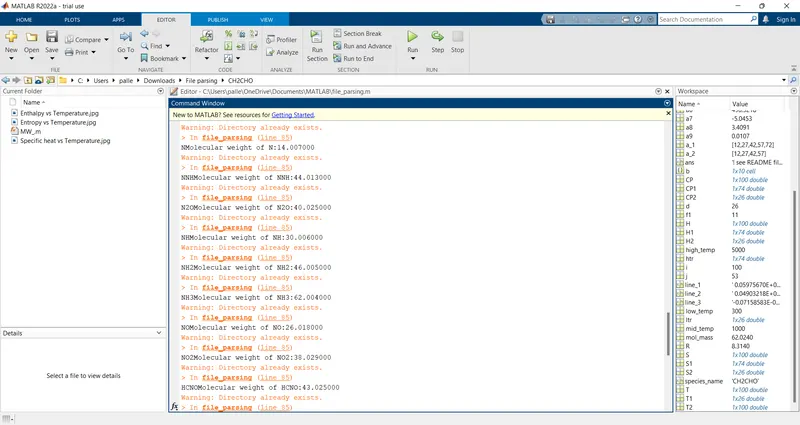
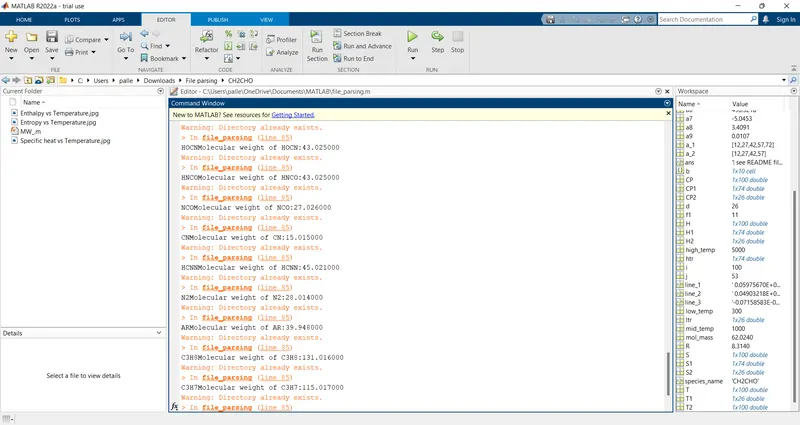
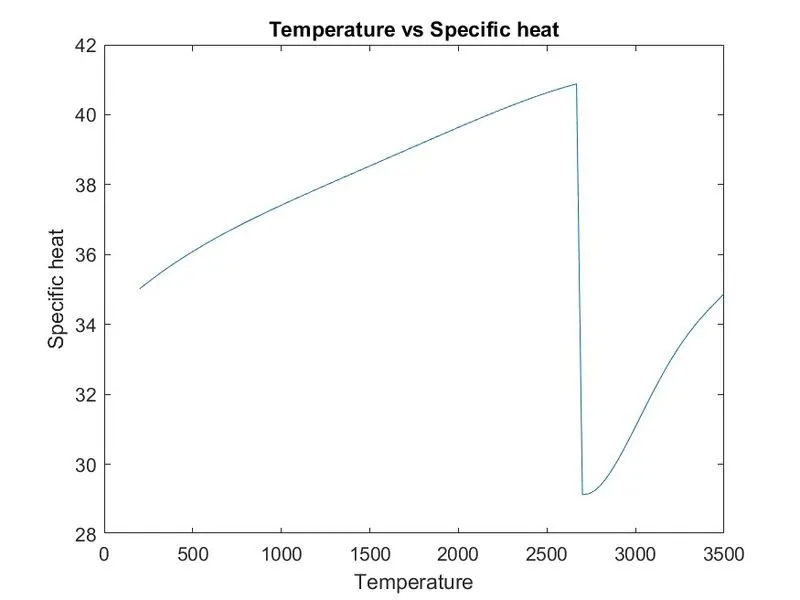
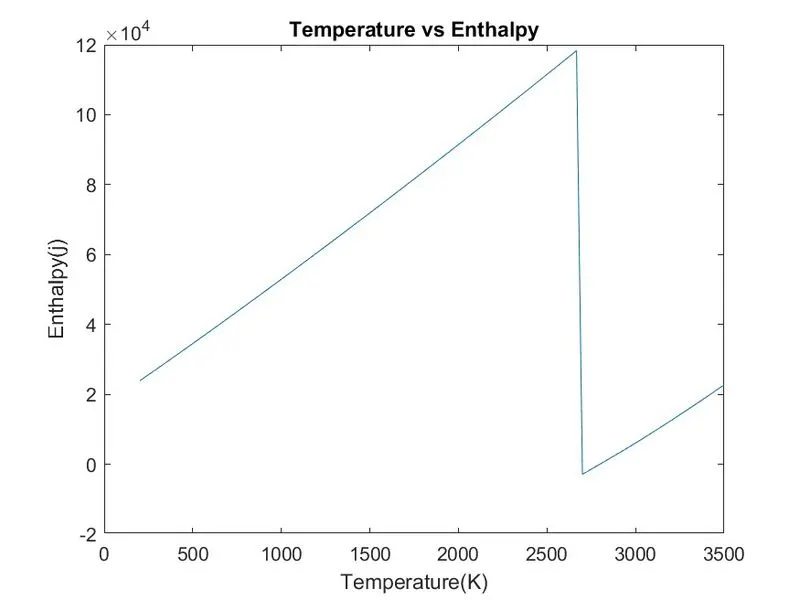
Attachments : plots for O2
1) plot for Specific heat(Cp) and Temperature(T)
2) plot for the Enthalpy(H) and Temperature(T)
3) plot for the Entropy(S) and Temperature(T)
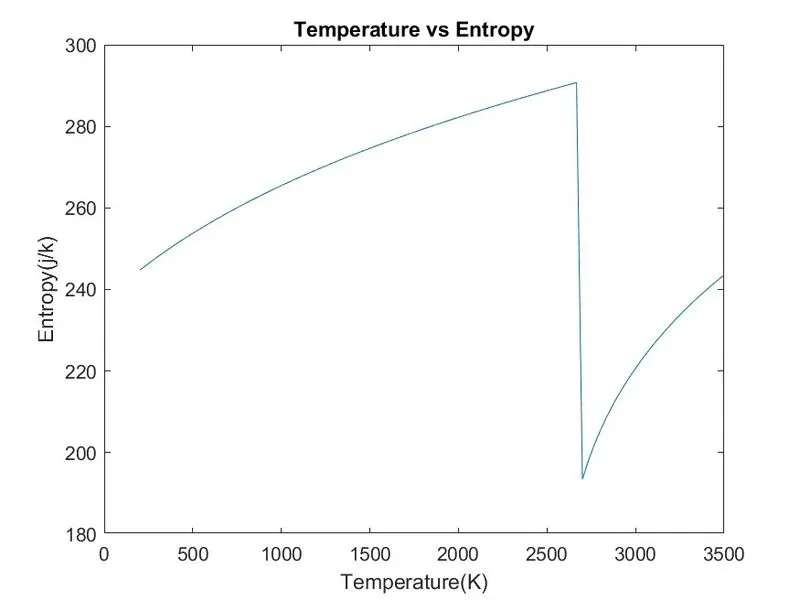
Plots for N2
1)plot for Specific heat(Cp) and Temperature(T)
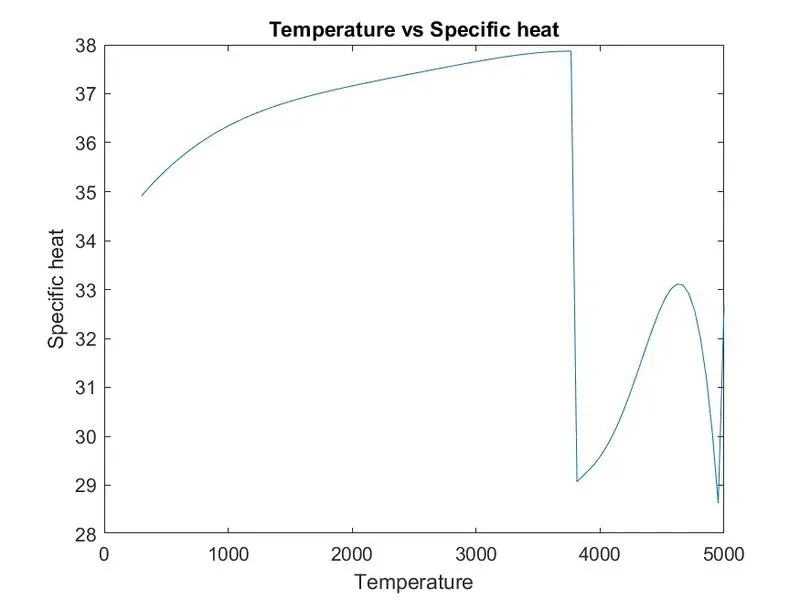
2) plot for the Enthalpy(H) and Temperature(T)
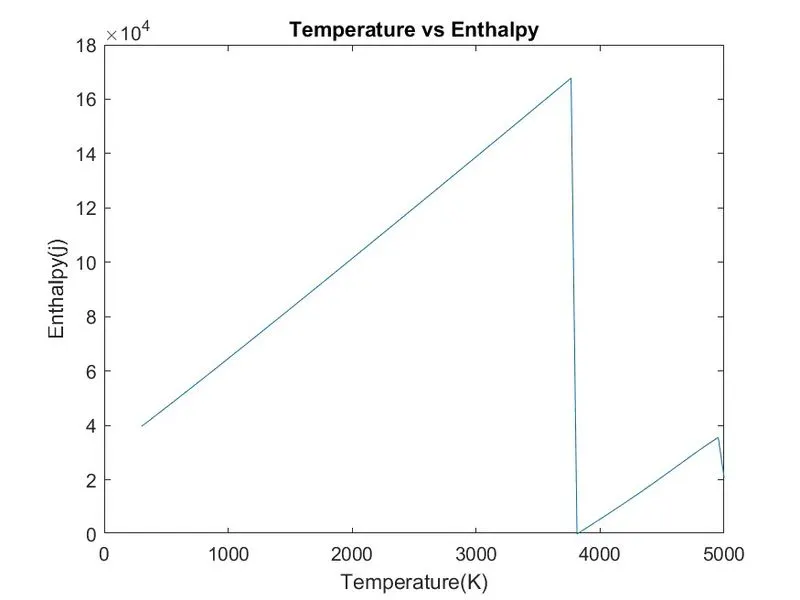
3) plot for the Entropy(S) and Temperature(T)
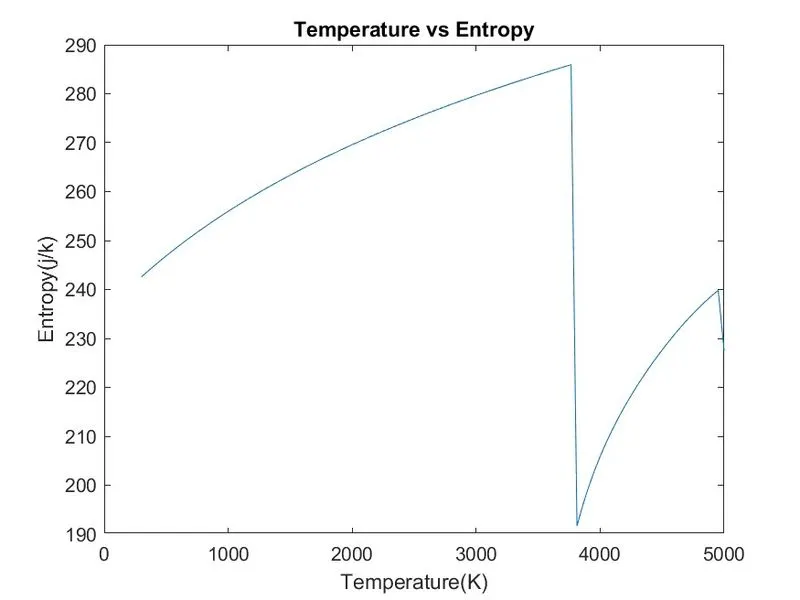
Plots for CO2
1)plot for Specific heat(Cp) and Temperature(T)
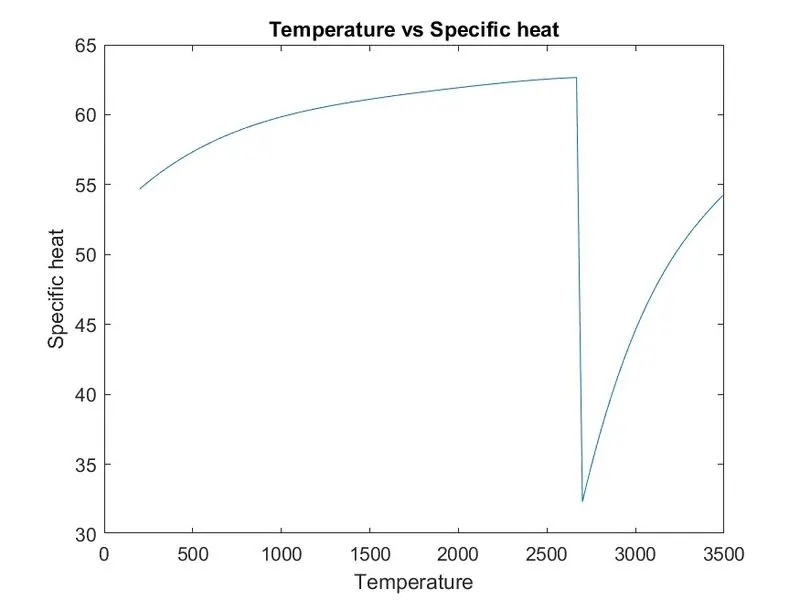
2) plot for the Enthalpy(H) and Temperature(T)
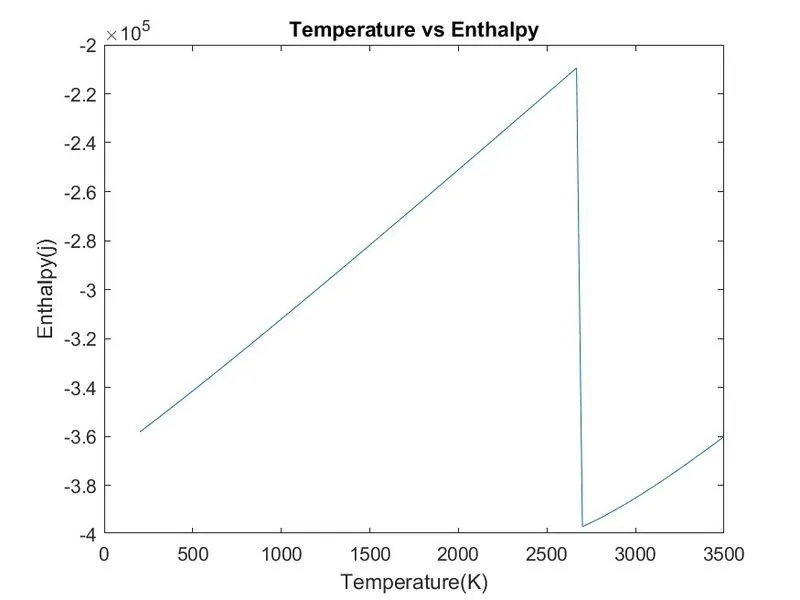
3) plot for the Entropy(S) and Temperature(T)
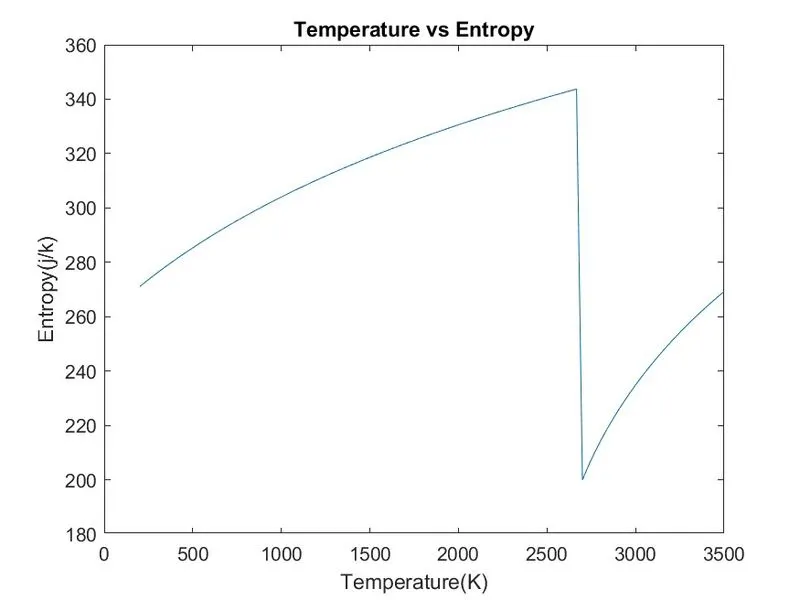
Screen shot for saved all species

Conclusion :
By using Thermo data plotted the required graphs for specific heat, Enthalpy and Entropy
And finded the molecular weight for all species