Project 1 - Parsing NASA thermodynamic data
PROJECT-1
AIM
Write a function that extracts 14 coefficents from 'NASA'S THERMODYNAMIC DATA' and calculate
- ENTHALPY
- ENTROPY
- SPECIFIC HEAT
- MOLECULAR WEIGHT OF EACH SPECIES
- PLOT THE CP,ENTHALPY ,ENTROPY, FOR LOCAL TEMPARATURE RANGE
THEORY INVOLVED
FILE PARSING :
It is a method used to retrive information from a particular text or file and how that can be used in another program
NASAS THERMODYNAMIC FILE
THERMO.dat file is a data file containing 14 coefficients for 53 different elements given by NASA. These coefficients are utilized to calculate the specific heat, enthalpy & entropy for a particular element. Each element has its own range of local temperature.
NASAS POLYNOMIALS HAVE THE FORM
Cp/R = a1 + a2 T + a3 T^2 + a4 T^3 + a5 T^4
H/RT = a1 + a2 T /2 + a3 T^2 /3 + a4 T^3 /4 + a5 T^4 /5 + a6/T
S/R = a1 lnT + a2 T + a3 T^2 /2 + a4 T^3 /3 + a5 T^4 /4 + a7
where R is the universal gas constant whose value is 8.314 j/mol/k
T is the temparature , a1,a2,a3,a4,a5,a6,a7 are the numerical coefficents provided in thermo.dat file.
The first 7 coefficents are High- temparature coefficents (above 1000k) and second 7 coefficents are LOW-temparature coefficents (below 1000k)
CODING FUNCTIONS
function-1 , ENTHALPY
function[H]=enthalpy_H(a1,a2,a3,a4,a5,a6,a8,a9,a10,a11,a12,a13,temp,t_mid,R)
% first 7 temp are high and second 7 are low
if(temp<=t_mid)
    H=R*temp.*(a8+((a9*temp)/2))+((a10*(temp).^2)/3)+((a11*(temp).^3)/4)+((a12*(temp).^4)/5)+((a13./(temp)));
else
    H=R*temp.*(a1+((a2*temp)/2))+((a3*(temp).^2)/3)+((a4*(temp).^3)/4)+((a5*(temp).^4)/5)+((a6./(temp)));
end
end
function-2, SPECIFIC HEAT
function[cp]=specific_heat(a1,a2,a3,a4,a5,a8,a9,a10,a11,a12,t_mid,temp,R)
% first 7 high temp coeff and next 7 low temp coiff
%temparature coefficients
if(temp<=t_mid)
    cp=R*(a8+(a9*temp)+(a10*(temp).^2)+(a11*(temp).^3)+(a12*(temp).^4));
else
    cp=R*(a1+(a2*temp)+(a3*(temp).^2)+(a4*(temp).^3)+(a5*(temp).^4));
end
end
function-3, ENTROPY
function[s]=entropy_s(a1,a2,a3,a4,a5,a7,a8,a9,a10,a11,a12,a14,t_mid,temp,R)
if(temp<=t_mid)
    s=(a8*log(temp)+(a9*temp)+(a10*(temp.^2)/2)+(a11*(temp.^3)/3)+(a12*(temp.^4)/4)+(a14))*R;
else
     s=(a1*log(temp)+(a2*temp)+(a3*(temp.^2)/2)+(a4*(temp.^3)/3)+(a5*(temp.^4)/4)+(a7))*R;
end
end
figure-4, Molecular weight
% function to calculate molecular mass
function mw=mol_wt(sp_name)

% storing values
compound_name=(sp_name);

% creating an array of elements
key_at=['C','H','O','N','A'];

% storing molecular mass of individual element
value_at=[12.0107 1.00794 15.994 14.0067 39.948];

% assigning molecular mass as zero
mw=0;
% creating loop
for i =1:length(compound_name)
for j=1:length(key_at)

    % comparing string value
    if strcmp(compound_name(i),key_at(j))
        % if the comp is true mol mass is calculated
        mw=mw+value_at(j);
        % storing the position for further use
        pos=j;
    end
end
% converting the string to number
k=str2num(compound_name(i));
 if (k>1)
     % molecular mass calculation
     mw-mw+value_at(pos)*(k-1);
 end
end
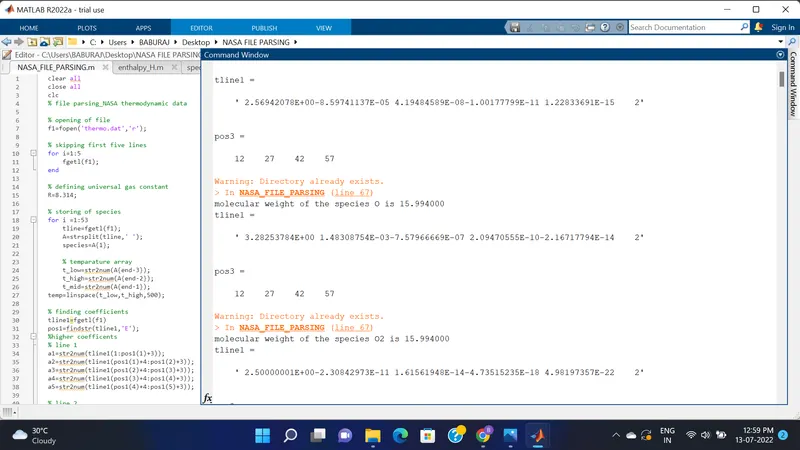
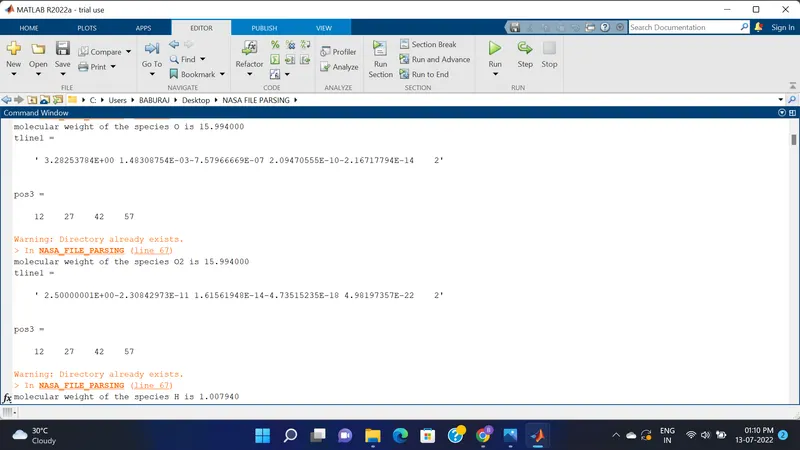
fprintf('molecular weight of the species %s is %f',compound_name,mw)
end
MAIN PROGRAM
clear all
close all
clc
% file parsing_NASA thermodynamic data

% opening of file
f1=fopen('thermo.dat','r');

% skipping first five lines
for i=1:5
    fgetl(f1);
end

% defining universal gas constant
R=8.314;

% storing of species
for i =1:53
    tline=fgetl(f1);
    A=strsplit(tline,' ');
    species=A{1};

    % temparature array
    t_low=str2num(A{end-3});
    t_high=str2num(A{end-2});
    t_mid=str2num(A{end-1});
temp=linspace(t_low,t_high,500);

% finding coefficients
tline1=fgetl(f1)
pos1=findstr(tline1,'E');
%higher coefficents
% line 1
a1=str2num(tline1(1:pos1(1)+3));
a2=str2num(tline1(pos1(1)+4:pos1(2)+3));
a3=str2num(tline1(pos1(2)+4:pos1(3)+3));
a4=str2num(tline1(pos1(3)+4:pos1(4)+3));
a5=str2num(tline1(pos1(4)+4:pos1(5)+3));

% line 2
tline2=fgetl(f1);
pos2=findstr(tline2,'E');
a6=str2num(tline2(1:pos2(1)+3));
a7=str2num(tline2(pos2(1)+4:pos2(2)+3));
a8=str2num(tline2(pos2(2)+4:pos2(3)+3));
a9=str2num(tline2(pos2(3)+4:pos2(4)+3));
a10=str2num(tline2(pos2(4)+4:pos2(5)+3));

% line3
tline3=fgetl(f1);
pos3=findstr(tline3,'E')
a11=str2num(tline3(1:pos3(1)+3));
a12=str2num(tline3(pos3(1)+4:pos3(2)+3));
a13=str2num(tline3(pos3(2)+4:pos3(3)+3));
a14=str2num(tline3(pos3(3)+4:pos3(4)+3));

% specific heat
cp=specific_heat(a1,a2,a3,a4,a5,a8,a9,a10,a11,a12,t_mid,temp,R);

% enthalpy
H=enthalpy_H(a1,a2,a3,a4,a5,a6,a8,a9,a10,a11,a12,a13,temp,t_mid,R);

%entropy
S=entropy_s(a1,a2,a3,a4,a5,a7,a8,a9,a10,a11,a12,a14,t_mid,temp,R);

% creating new folder for species
mkdir(species)
% changing directory
cd(species)

% plotting
figure(1)

plot(temp,cp)
xlabel('Temparature')
ylabel('specific_heat')
title('cp vs temparature of',sprintf('%s',species))
saveas(figure(1),'cp vs T.jpg')

figure(2)
plot(temp,H)
xlabel('Temparature')
ylabel('Enthalpy')
title('Enthalpy vs Temparature of',sprintf('%s',species))
saveas(figure(2),'H vs T.jpg')

figure(3)
plot(temp,S)
xlabel('Temparature')
ylabel('Entropy')
title('Entropy vs Temparature of',sprintf('%s',species))
saveas(figure(3),'s vs T.jpg')
% coming back to program directory
cd ..
    %calculating molecular weight of species
M=mol_wt(species);
end
EXPLANATION OF THE PROGRAM
- function for Enthalpy : in order to calculate the enthalpy of each species we create a function for enthalpy , in step 1 all the inputs are defined sicnce we have high temparature coefficent and low temparature coefficent we use if condition .
- function for specific heat : in order to calculate the specific heat of each species we create a function for specifc_heat , in step 1 all the inputs are defined sicnce we have high temparature coefficent and low temparature coefficent we use if condition .
- function for ENTROPY : in order to calculate the entropy of each species we create a function for entropy , in step 1 all the inputs are defined sicnce we have high temparature coefficent and low temparature coefficent we use if condition .
- function for MOLECULAR WEIGHT :
- in step one a function is created named as mol_wt
- the name of species is stored in a variable called compound_name
- an array of basic elements is created
- the molecular weight of individual elements is created
- strcmp is string comparison command used to compare values of compound_name and key_at if the two matches molecular weight is calculated
- str2num command is used to convert a string into number
EXPLANATION OF MAIN PROGRAM
- fopen is a keyword used to open a file and and file name and permission is given as input
- fgetl is a command used to read first line and following subsequent lines
- using a for loop first 5 lines are skipped
- the value of universal gas constant is defined
- a second for loop is created from 1:53
- strsplit is a command used to remove spaces and split individual strings
- str2num is a command used to change the string value into numerical value
- temparature range is specified using a linspace command
- findstr is a command used to get string position value
- using findstr position of string E is found and is used find a1,a2,a3,a4,a5 from line 1
- similarly the position value of E is found at line 2 and is used to find a6,a7,a8,a9,a10
- the position value of E is calculated in line 3 and a11,a12,a13,a14 is calculated
- function of specific heat is called
- function of enthalpy is called
- function of entropy is called
- mkdir is a command used to create a new directory
- cd is a command used to change working directory
plotting
- figure 1- a plot is created for temparature vs specific heat ,save as ('name'.jpg) is a command used to save the plot as an image
- figure 2- a plot is created for temparature vs enthalpy ,save as ('name'.jpg) is used to save it as an image
- figure 3 - a plot is created for temparature vs entropy ,save as ('name.jpg') is used to save it as an image
PLOTS & IMAGES
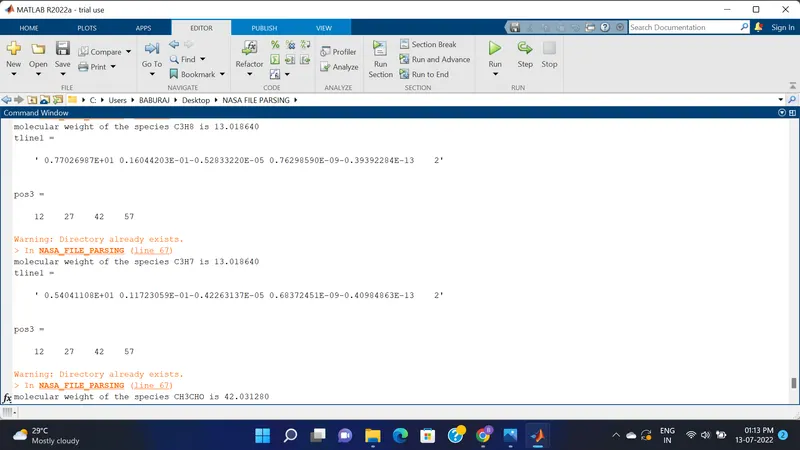
figure-1 ( screen shot of window with all the saved folders)
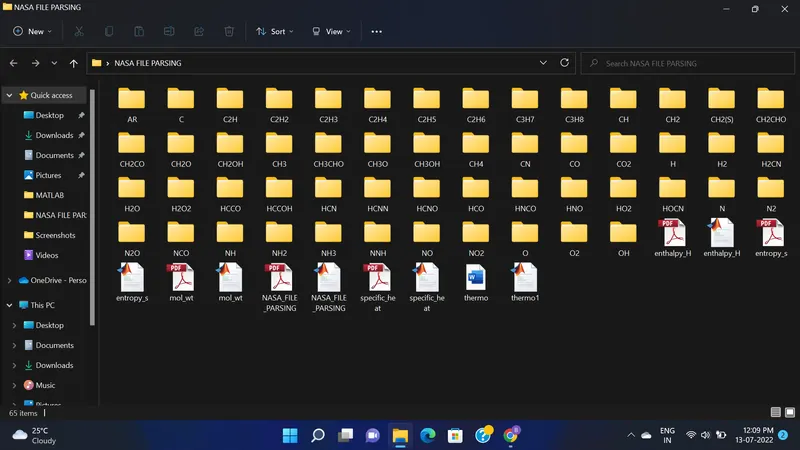
figure-2 ( plots of O2)
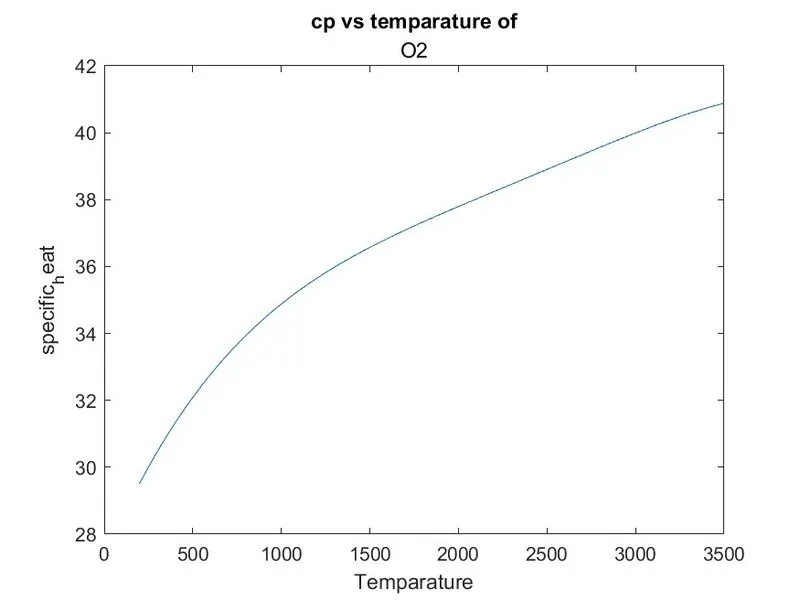
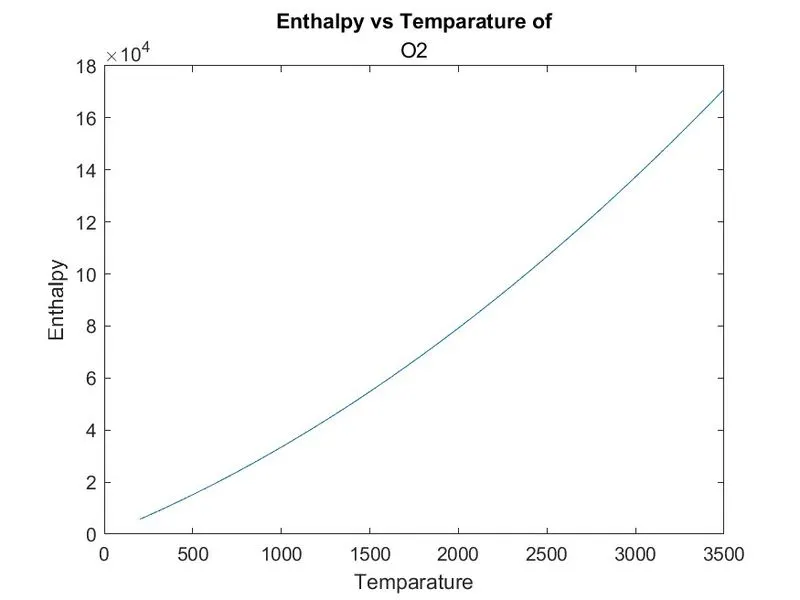
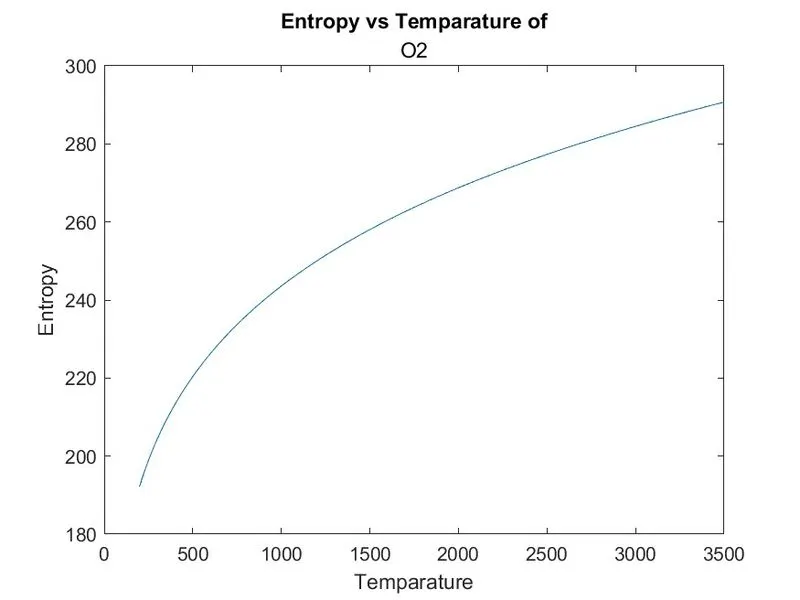
figure-3 ( plots of N2)
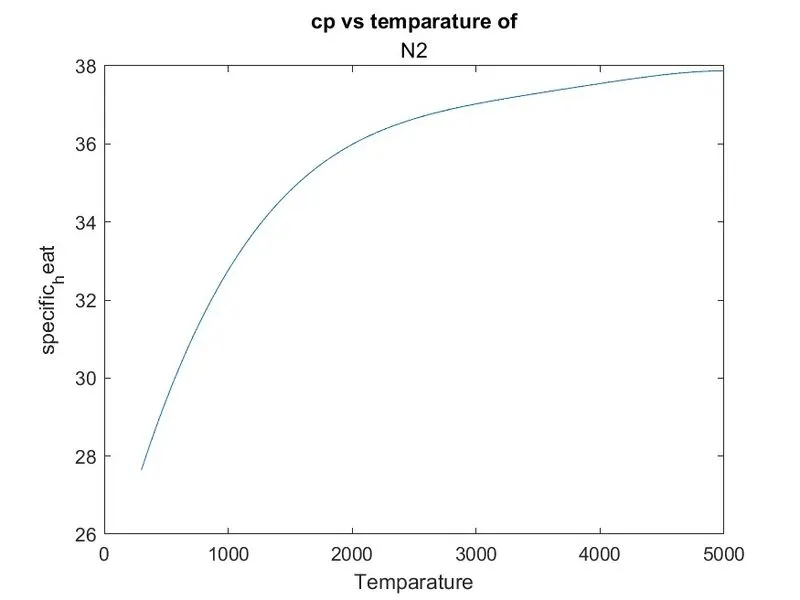
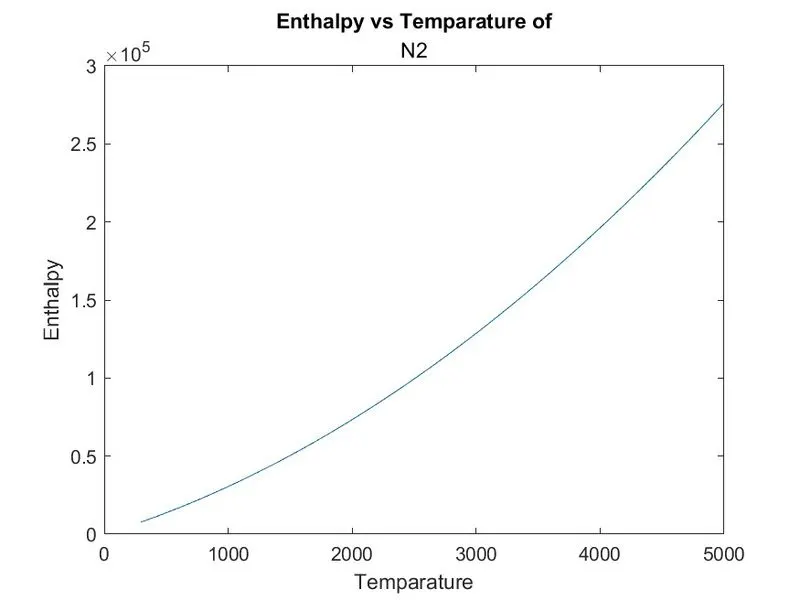
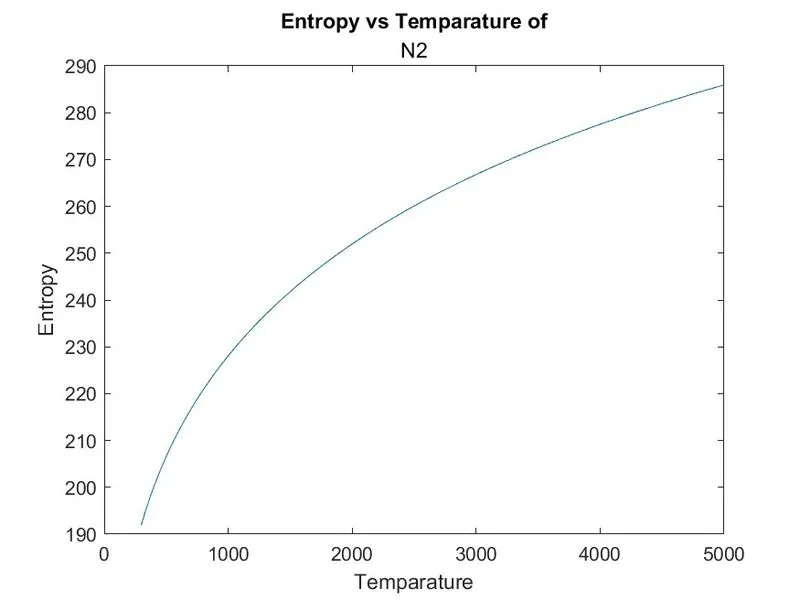
figure-4 (plots of co2)
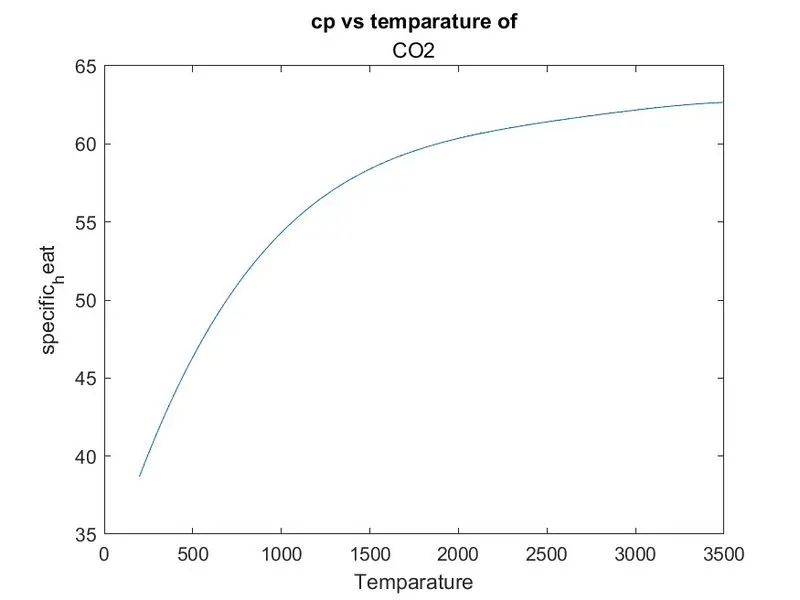
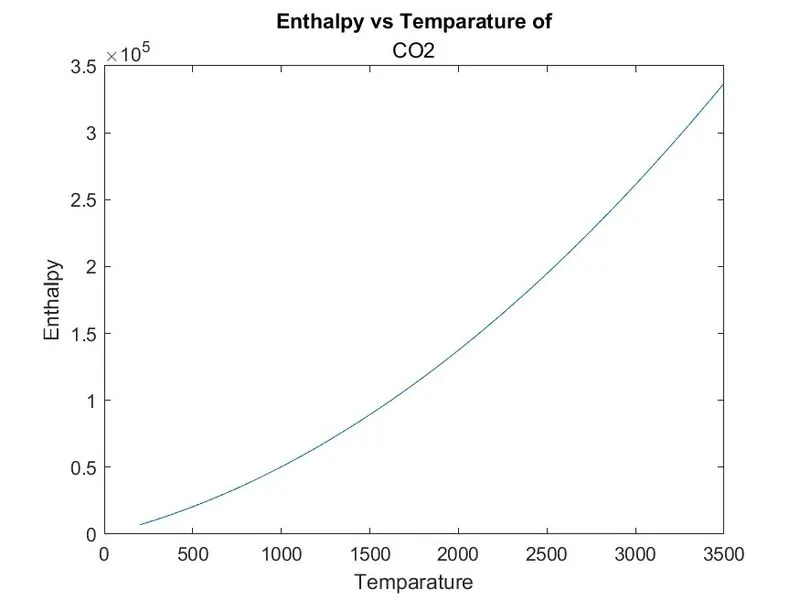
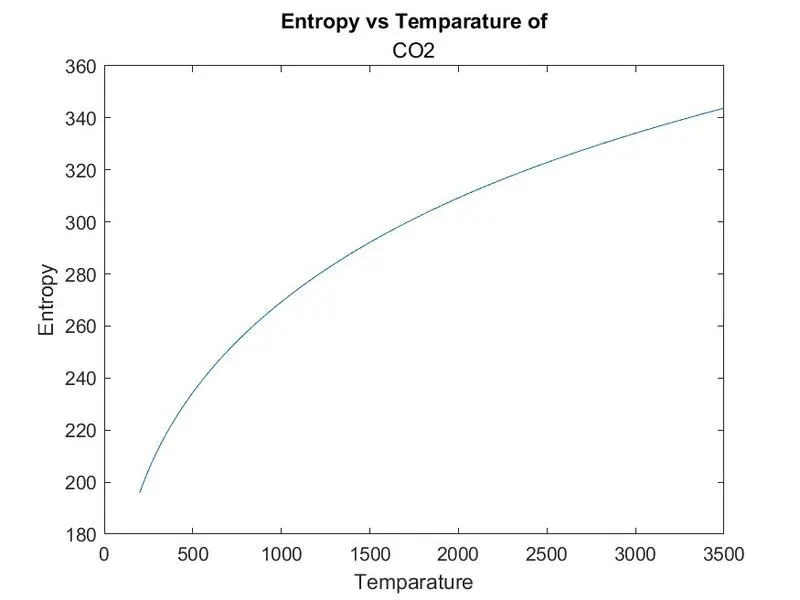
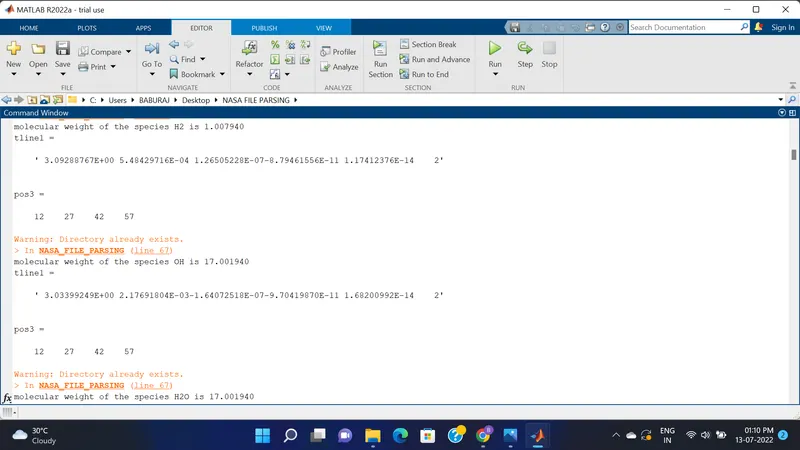
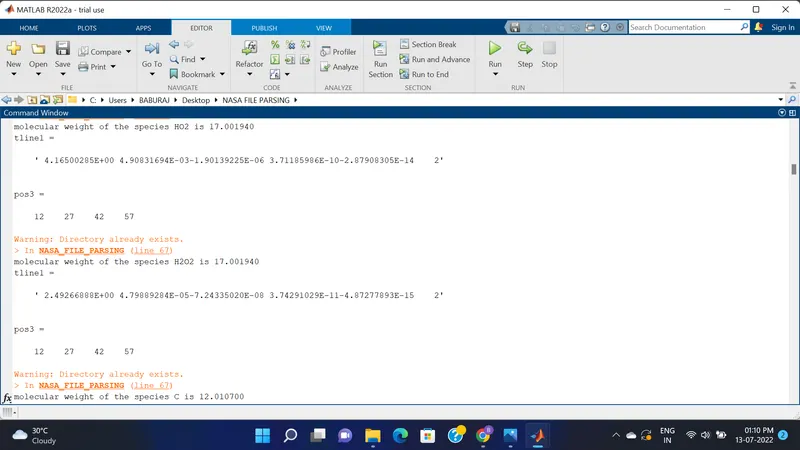
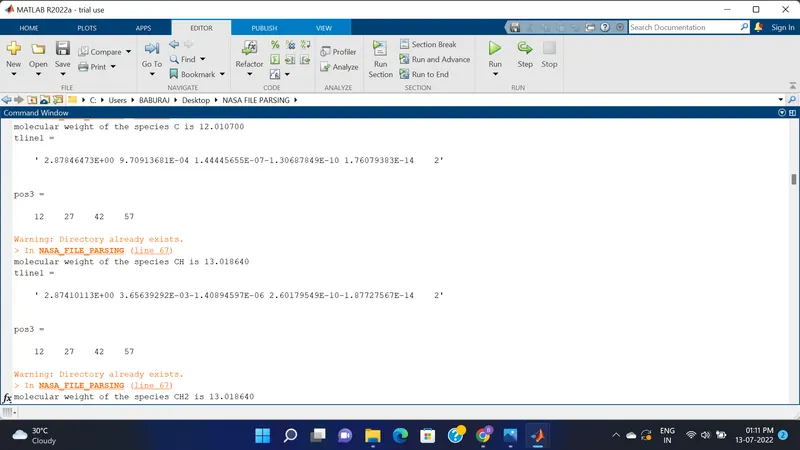
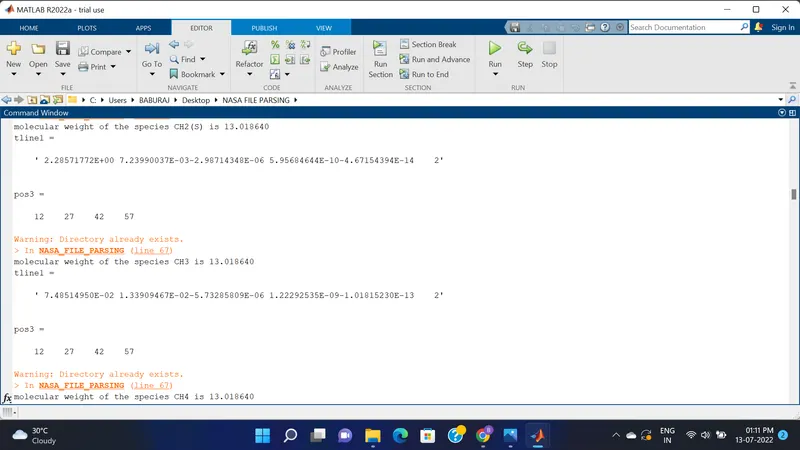
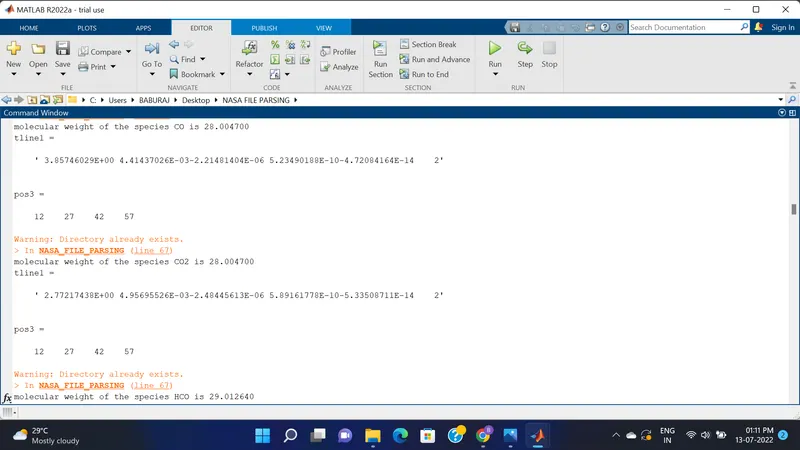
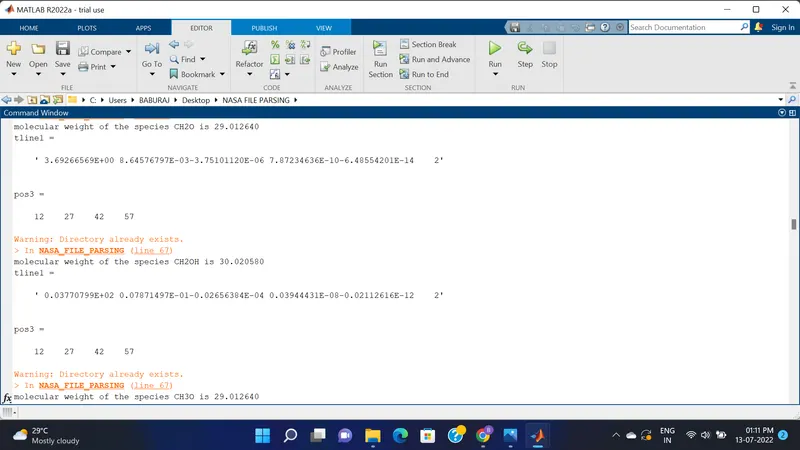
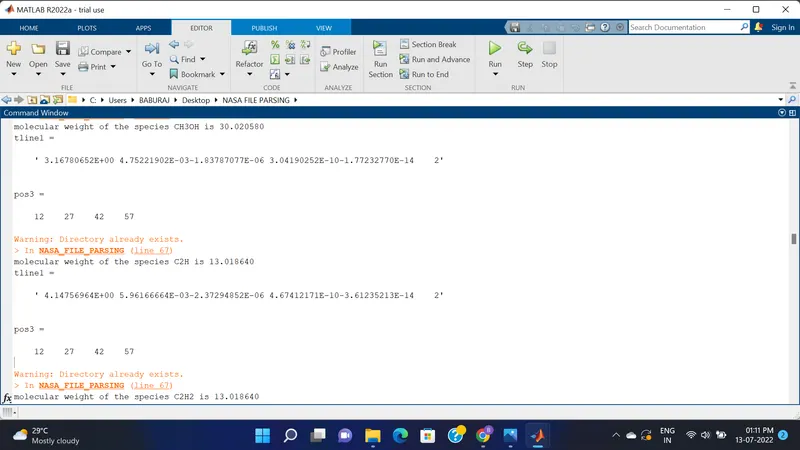
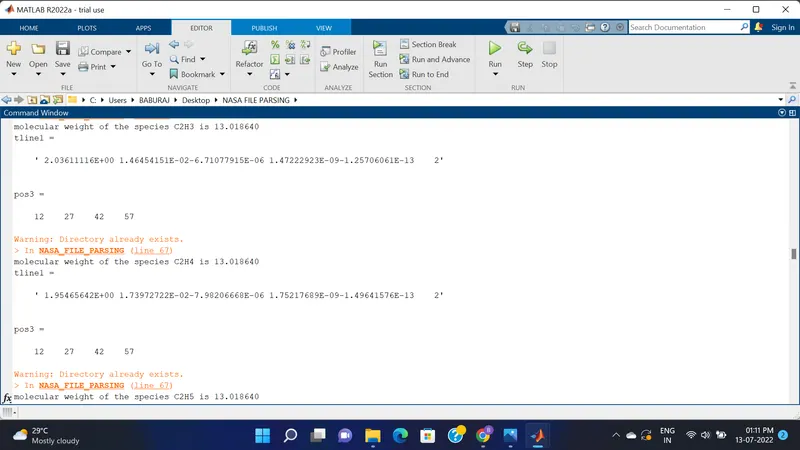
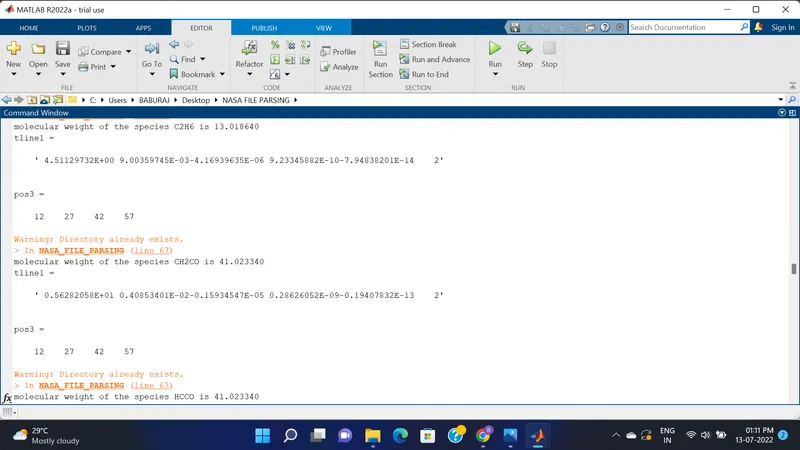
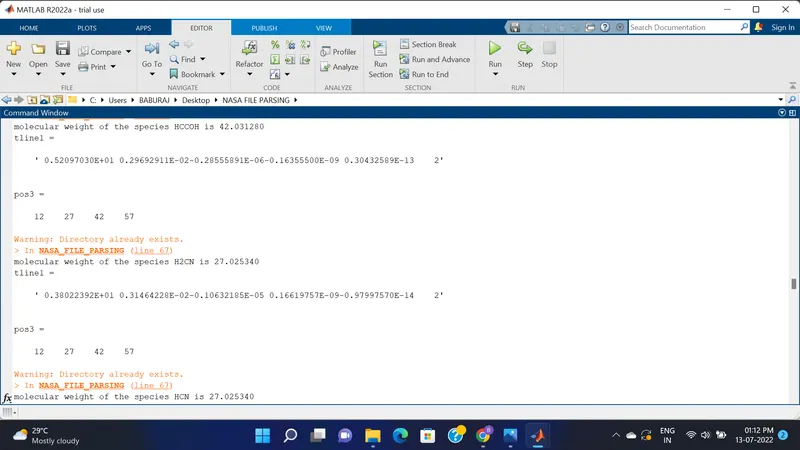
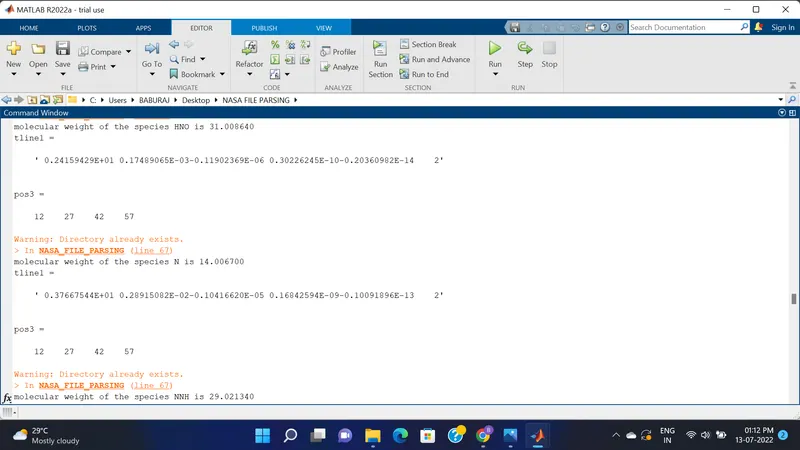
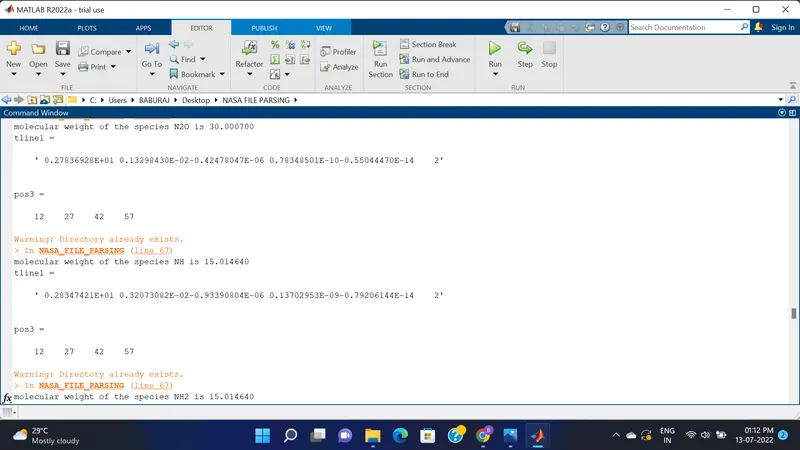
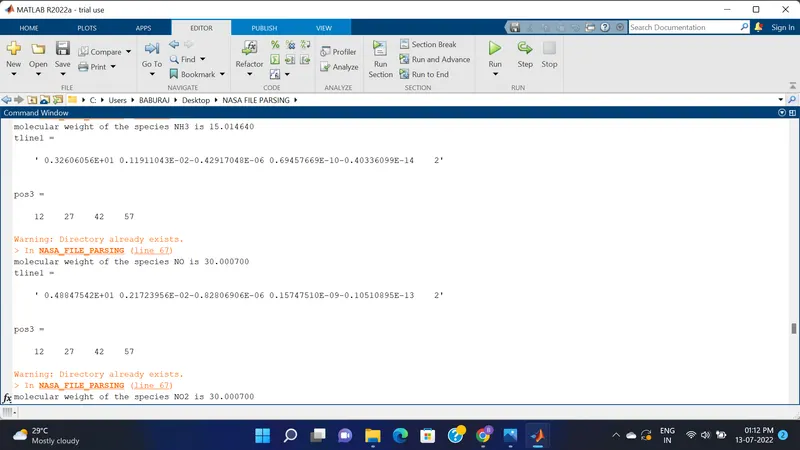
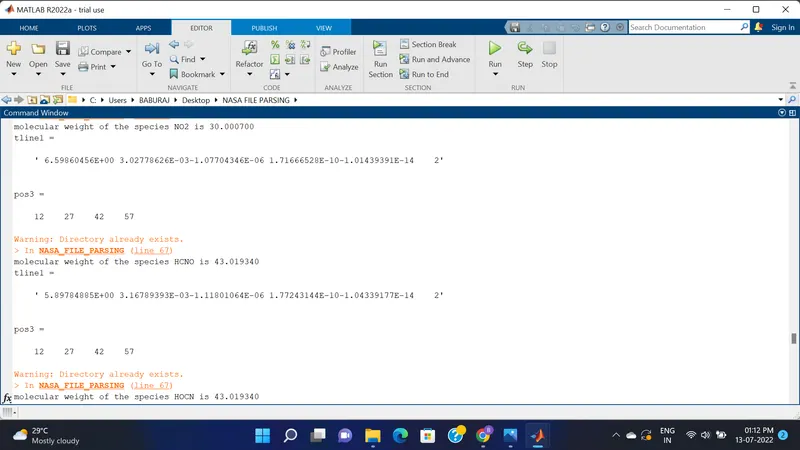
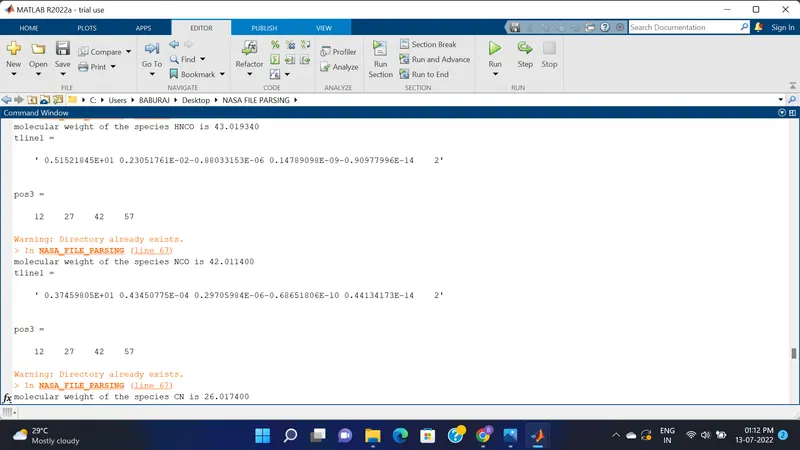
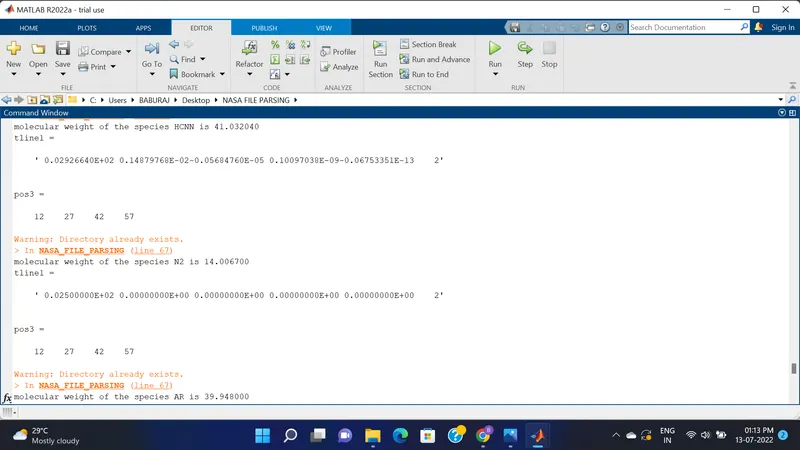
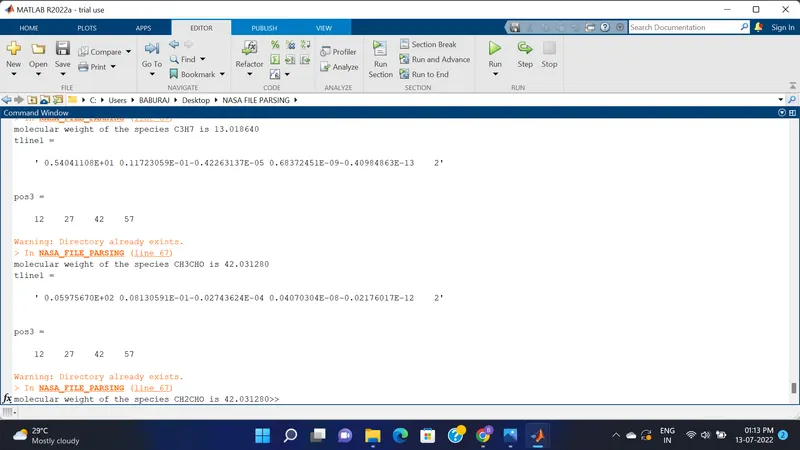
figure-5 ( molecular weight of all species)
ERRORS
1)
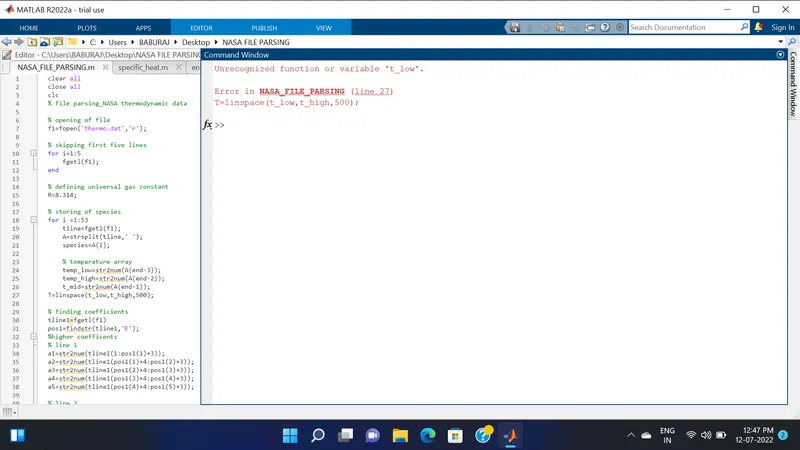
error in defining input variable T was replaced as temp since it is used everywere
2)
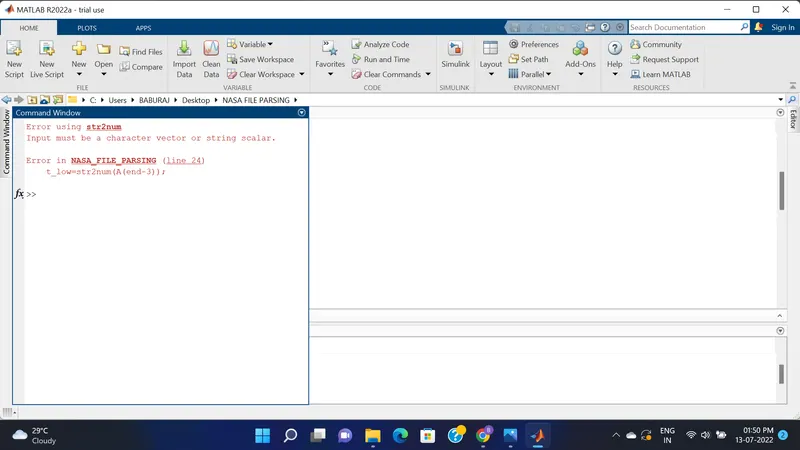
error occured due to usage of wrong brackets it is replaced by curly-brackets to remove error
RESULT
- molecular weight of each species is calculated
- 14 co-efficents are successfuly extracted and Enthalpy ,Entropy ,Specific heat of each species is calculated
- plots are made and saved as images
- project helped to study method of file parsing in detail
REFERENCES
https://en.wikipedia.org/wiki/Parsing
https://www.mathworks.com/matlabcentral/answers/106320-make-a-loop-to-calculate-molecular-weight
https://www.mathworks.com/matlabcentral/answers/317006-create-new-folders-by-mkdir