Project 1 - Parsing NASA thermodynamic data
Aim:
To create a matlab program to study a given data file:thermo.data and took respective temperacture data ad co-efficient data for respective species and calculate Specific heat,entropy,enthalpy and molicular weight and also plot CP,H.S respect to T.
Main Program:
clear all
close all
clc

%inputs
R = 8.314;%Universal gas constat

f1 = fopen('thermo.data.txt','r');


for i = 1:5
    fgetl(f1)
end
for i=1:53
    line_one=fgetl(f1)
    l1=strsplit(line_one, ' ')
    species_name=l1{1}


 %local temperature
 t1 = l1{(7)}
 t1 = str2num(t1);
 t2 = l1{(8)}
 t2 = str2num(t2);
 t3 = l1{(9)}
 t3 = str2num(t3);
 local_low_temperature = t1
 local_high_temperature= t2
 local_mid_temperature = t3

%co-efficient values in 1st line
l1 = fgetl(f1)
loce = strfind(l1,'E')

cof1 = l1(1:loce(1)+3);
cofo1 = str2num(cof1)

cof2 = l1(16:loce(2)+3);
cofo2 = str2num(cof2)

cof3 = l1(31:loce(3)+3);
cofo3 = str2num(cof3)

cof4 = l1(46:loce(4)+3);
cofo4 = str2num(cof4)

cof5 = l1(61:loce(5)+3);
cofo5 = str2num(cof5)

%co-efficient values in 2nd line
l2 = fgetl(f1)
locE_l2 = strfind(l2,'E')

cof6 = l2(1:locE_l2(1)+3);
cofo6 = str2num(cof6)

cof7 = l2(16:locE_l2(2)+3);
cofo7 = str2num(cof7)

cof8 = l2(31:locE_l2(3)+3);
cofo8 = str2num(cof8)

cof9 = l2(46:locE_l2(4)+3);
cofo9 = str2num(cof9)

cof10 = l2(61:locE_l2(5)+3);
cofo10 = str2num(cof10)

%co-efficient values in 3rd line
l3 = fgetl(f1)
locE_l3 = strfind(l3,'E')

cof11 = l3(1:locE_l3(1)+3);
cofo11 = str2num(cof11)

cof12 = l3(16:locE_l3(2)+3);
cofo12 = str2num(cof12)

cof13 = l3(31:locE_l3(3)+3);
cofo13 = str2num(cof13)

cof14 = l3(46:locE_l3(4)+3);
cofo14 = str2num(cof14)

%Temperature values
t = linspace(local_low_temperature,local_high_temperature,150)

%calculating Cp
[Cp] = specificheat(cofo1,cofo2,cofo3,cofo4,cofo5,cofo8,cofo9,cofo10,cofo11,cofo12,local_mid_temperature,R,t)

%calculating enthalpylpy [H]
[H] = enthalpy(cofo1,cofo2,cofo3,cofo4,cofo5,cofo8,cofo9,cofo10,cofo11,cofo12,local_mid_temperature,R,t)

%calculating Entropy [S]
[S] = entropy(cofo1,cofo2,cofo3,cofo4,cofo5,cofo8,cofo9,cofo10,cofo11,cofo12,local_mid_temperature,R,t)


%Plots formation and saving as file
mkdir(species_name)
cd(species_name)
%plot for Cp to temperature
figure(1)
plot(t,Cp)
xlabel('Temperacture')
ylabel('Specific Heat')
legend('Cp Curve')
title('Specific Heat vs Temperacture for',species_name)
saveas(figure(1),"Cp vs T.jpg")

%plot for Enthalpy to temperature
figure(2)
plot(t,H)
xlabel('Temperacture')
ylabel('Enthalpy')
legend('H Curve')
title('Enthalpy vs Temperacture for',species_name)
saveas(figure(1),"H vs T.jpg")

%plot for Entropy to temperature
figure(3)
plot(t,S)
xlabel('Temperacture')
ylabel('Entropy')
legend('S Curve')
title('Entropy vs Temperacture for',species_name)
saveas(figure(1),"S vs T.jpg")

cd ..

%calculating Molicular weight
%Molicular weight of elements in thermo data
[M] = molicular_weight(species_name)
sp_weight = sprintf('%s weight = %f',species_name,M);
disp(sp_weight)
end
Specific heat function program:
%creating a function to calculate specific heat

function [Cp] = specificheat(cofo1,cofo2,cofo3,cofo4,cofo5,cofo8,cofo9,cofo10,cofo11,cofo12,local_mid_temperature,R,t)

%first 7 co-efficients are high temperacture c0-efficient & secound 7
%co-efficients are low temperactue co-efficient

  if (t>local_mid_temperature)

    Cp = (cofo1+(cofo2.*t)+(cofo3.*(t.^2))+(cofo4.*(t.^3))+(cofo5.*(t.^4)))*R
  else

    Cp = (cofo8+(cofo9.*t)+(cofo10.*(t.^2))+(cofo11.*(t.^3))+(cofo12.*(t.^4)))*R

  end
end
Enthalpy function file:
%creacting a function for calculacting Enthalpy

function [H] = enthalpy(cofo1,cofo2,cofo3,cofo4,cofo5,cofo8,cofo9,cofo10,cofo11,cofo12,local_mid_temperature,R,t)

%first 7 co-efficients are high temperacture c0-efficient & secound 7
%co-efficients are low temperactue co-efficient

  if (t>local_mid_temperature)

    H = R*t.*cofo1+(cofo2*(t./2))+(cofo3.*((t.^2)./3))+(cofo4.*(((t.^3)./4))+(cofo5.*((t.^4)./5)))
  else

    H = R*t.*cofo8+(cofo9*(t./2))+(cofo10.*((t.^2)./3))+(cofo11.*(((t.^3)./4))+(cofo12.*((t.^4)./5)))

  end
end
Entropy function file:
%creacting a function for calculacting Entropy

function [S] = entropy(cofo1,cofo2,cofo3,cofo4,cofo5,cofo8,cofo9,cofo10,cofo11,cofo12,local_mid_temperature,R,t)

%first 7 co-efficients are high temperacture c0-efficient & secound 7
%co-efficients are low temperactue co-efficient

  if (t>local_mid_temperature)

    S = R*cofo1*log(t)+(cofo2.*t)+(cofo3.*((t.^2)./2))+(cofo4.*((t.^3)./3))+(cofo5.*((t.^4)/4))
  else

    S = R*cofo8*log(t)+(cofo9.*t)+(cofo10.*((t.^2)./2))+(cofo11.*((t.^3)./3))+(cofo12.*((t.^4)/4))

  end
end
Molicular weight function file:
function [M] = molicular_weight(species_name)
automic_name = ['H','C','O','N','A']
automic_weight = [1,12,16,14,40]
w = 0;
for i = 1:length(species_name)
    for j = 1:length(automic_name)
        if species_name(i)==automic_name(j)
            w = w+automic_weight(j)
            possition = j
        end
    end
    m = str2num(species_name(i))
    if m>1
        w = w+(automic_weight(possition)*(m-1));
    end
    M = w;
end
Explanaction:
- Clear all ,close all, clc commend used to close all data file opened relacted to matlab ,cleared all data stored in workspace prompt and in commend window.
- fopen commend helps to open the data file and 'r' = helps to read the data file.
- fgetl commend used to get the value in the data file.
- in the data file we don't want first 5 line so we use for loop for fgetl commend to read the data file for 5 times.
- now there are only species data which is orderly arranged.
- for loop is created to read all 53 species.
- the first line when the loop reads it get the chatacter in the line 1. strsplit commend used to split the character which is commen for all character.... here the common thing is space between each character.
- in these line there are 9 character value.in that 7,8,9 are the local temperacture value. Using str2num the character value converted in to numeric value.
- and the value is saved to respective variable.
- as like the temperacture value the co-efficient value took by the for loop. fo these co-efficient value two line got 5 values and 4 values in one line.
- for each line fgetl commend used read each line.[to read each line seperat fgetl commend is used]
- to get the respective co-efficient value we need to find the commen charactor which is E .
- now the E possition is saved in different variable name.
- first the location is spoted for each value and possition was saved in a new variable. but these is a charactor now str2num commend is used to convert the chatactor value to numerical value.
- after all 14 co-efficient value was collected ,now CP,H,S and molicular weight can be calculacted.
- for specific heat seperact function file created ,in that all the required values are passed in these function file.
- these are set to one condiction which is first 7 co-efficient values for high temperacture and next 7 co-efficent values for low temperacture co-efficient.
- to achive these aim if-else condiction is indused with (t>mid_temperacture) .Ex: If the loc_temp=200,mid_temp=1000,high_temp=3500. in these cause 1000 was mid temperacture. t is set to low to high temperacture range with linspace and range operactor.
- cthe same condiction is applicable for entropy and enthalpy function.
- to calculate molicular weight in each automic weight and name are assigned to respective variable.
- here initial weight is assumed to 0.
- now for loop is introduce to repect the calculaction for autom name and species name.
- now if caues is usde to compare the input species name and saved automic name.
- if the condiction is true the the weight will calculate to automic weight * number autom.
- if there are two element the progam calculate weight for first element and secound element weight and multiply with the number of autom and reduce the added weight in previous commend and add the both element value and the condiction got satisfied and the weight value stored in new variable.
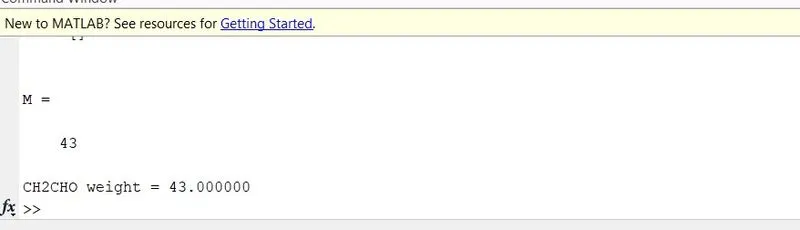
- now these value displayed in commend windoew
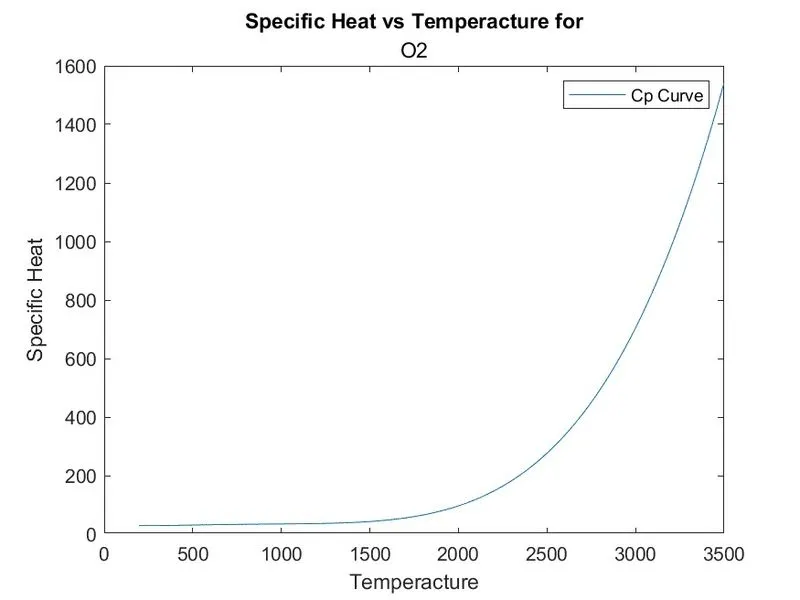
- now the plot commend is used to plot for Cp,H,S respect to temperacture.
- these files are save in a seperacte folder by mkdir and cd .. commend with species name.
- usinf saveas commend we can save the file in each folder and the give file type which is .jpg.
- cd .. = these commend helps to save the plots in seperact folder after that the file close and new folder is created for next species.
- plot for o2