Project 1 - Parsing NASA thermodynamic data
Theory
Specific heat(Cp)
Specific heat is defined by the amount of heat needed to raise the temperature of 1 gram of substance 1 degree Celcius(°C).
`Q=mcDeltaT`
Q=Heat Energy
m=mass
c=Specific heat capacity
`DeltaT`=Change in Temperature
Entropy(S)
The measeure of a system's thermal energy per unit temerature that is unavailable fo doing useful work.
`S=k_b*In*Omega`
S=entropy
`k_b`=Boltzman Constant
In=Natural Algorithm
`Omega`=Number of microscopic configurations
Enthalpy(H)
Enthapy is the sum of internal energy and work done
H=E+PV
H=Enthalpy
E=Internal Energy
P=Pressure
V=Volume
Objective
1. Write a function that extracts the 14 co-efficients and calculates the enthalpy, entropy and specific heats for all the species in the data file. You will be reading this file NASA thermodynamic data(Tip: use fopen and fgetl). The formulae are shown below.
Here R is the universal gas constant, T is the temeprature
The FIRST 7 coefficients are HIGH-temperature coefficients and the SECOND 7 coefficients are LOW-temperature coefficients.
Also use the LOCAL TEMPERATURE RANGES which is unique for each individual species, not the GLOBAL TEMPERATURE RANGE.
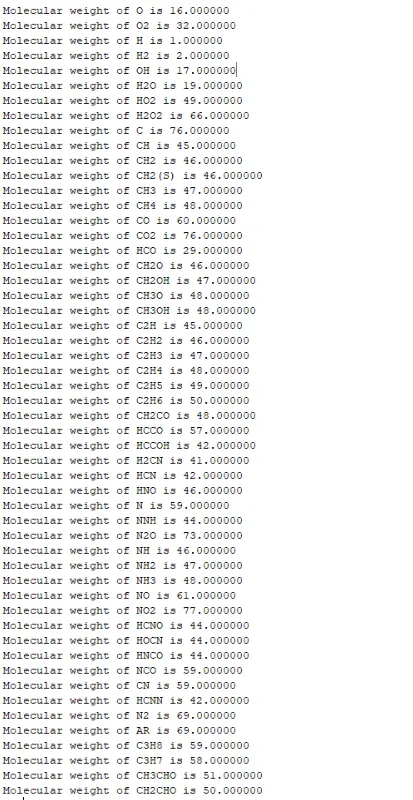
2. Calculate the molecular weight of each species and display it in the command window.
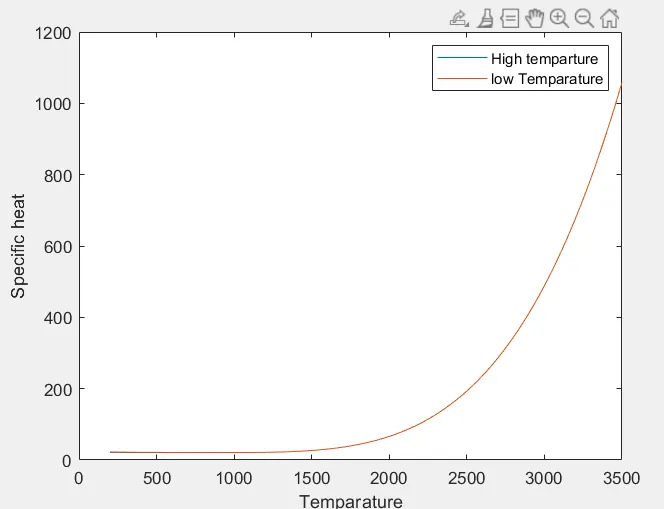
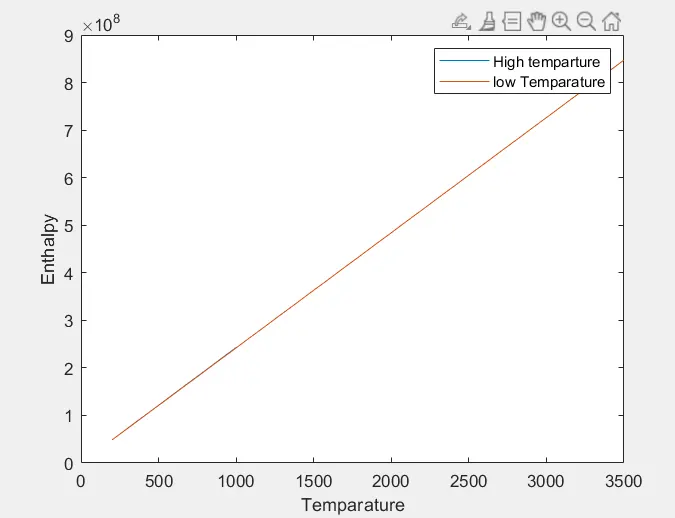
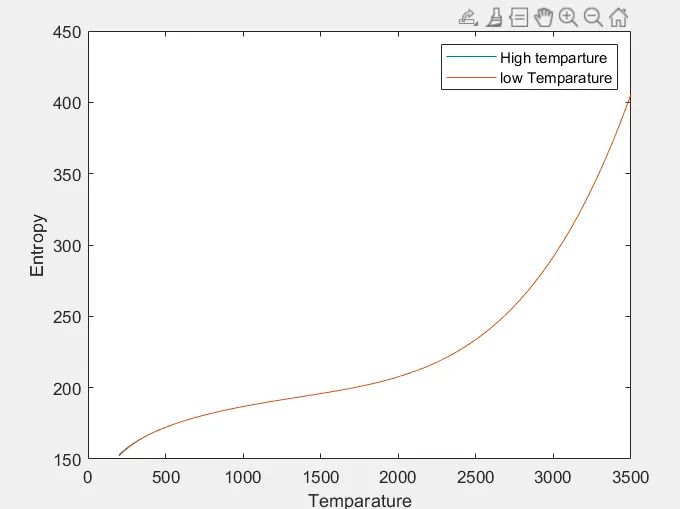
3. Plot the Cp, Enthalpy and Entropy for the local temperature range (low temperature : high temperature) specific for each species.
4. Save the plots as images with appropriate names and dump them in separate folders for each species with suitable name. All these should be generated automatically.
5. The main program that you will submit will just take the "THERMO.dat" file as an input and generate Cp, H and S plots.
6. Please write a detailed report to describe your logic.
Code
clear all
close all
clc

f1=fopen('THERMO.dat','r');
fgetl(f1);
G_temp = str2num(fgetl(f1));
%Global temparture

G_low=G_temp(1);
G_mid=G_temp(2);
G_high=G_temp(3);

for i=1:3
fgetl(f1);
end
R = 8.3145; %J/Mol*Km (units)

for j=1:53
line=fgetl(f1);
A = strsplit(line,' ');

% species
species = (A{1});
% Local_temparture
Low = str2num(A{end-3});
High=str2num(A{end-2});
Mid=str2num(A{end-1});
%co-efficients
a_line=fgetl(f1);
a =findstr(a_line, 'E'); %#ok<*FSTR>
A1=a_line(1:a(1)+3);
A1=str2num(A1); %#ok<*ST2NM>
A2=a_line(a(1)+4:a(2)+3);
A2=str2num(A2);
A3=a_line(a(2)+4:a(3)+3);
A3=str2num(A3);
A4=a_line(a(3)+4:a(4)+3);
A4=str2num(A4);
A5=a_line(a(4)+4: a(5)+3);
A5=str2num(A5);

b_line=fgetl(f1);
b=findstr(b_line,'E');

A6=b_line(1:b(1)+3);
A6=str2num (A6);
A7=b_line(b(1)+4:b(2)+3);
A7=str2num(A7);
A8=b_line(b(2)+4:b(3)+3);
A8=str2num(A8);
A9=b_line(b(3)+4:b(4)+3);
A9=str2num(A9);
A10=b_line(b(4)+4:b(5)+3);
A10=str2num(A10);

c_line=fgetl(f1);
c=findstr(c_line, 'E');


A11=c_line(1:c(1)+3);
A11=str2num(A11);
A12=c_line(c(1)+4:c(2)+3);
A12=str2num(A12);
A13=c_line(c(2)+4:c(3)+3);
A13=str2num (A13);
A14=c_line(c(3)+4:c(4)+3);
A14=str2num(A14);

%Specific heat, Enthalpy, Entropy @High temparture T_H= linspace (Low, Mid, 100);
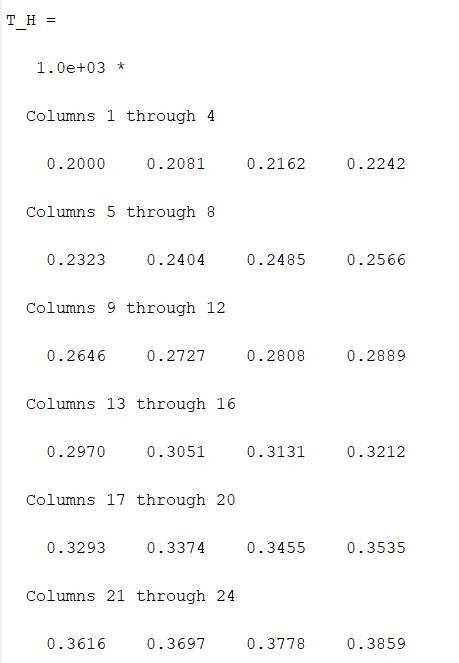
T_H=linspace(Low,Mid,100)
cp=(A1+(A2.*T_H)+(A3.*T_H.^2)+(A4.*T_H.^3)+(A5.*T_H.^4))*R;
H = (A1+(A2.*T_H/2)+(A3.*(T_H.^2)/3)+(A4.*(T_H.^3)/4)+(A5.*(T_H.^4)/5)+A6.*T_H)*R;
S=(A1*log (T_H)+(A2.*T_H)+(A3.*(T_H.^2)/2)+(A4.*(T_H.^3)/3)+(A5.*(T_H.^4)/4)+A7) *R;

%Specific heat, Enthalpy, Entropy @ Low temparture T_Llinspace (Mid, High, 100);
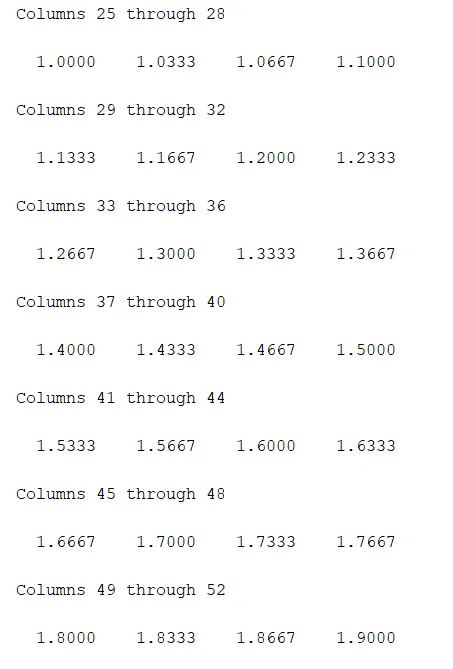
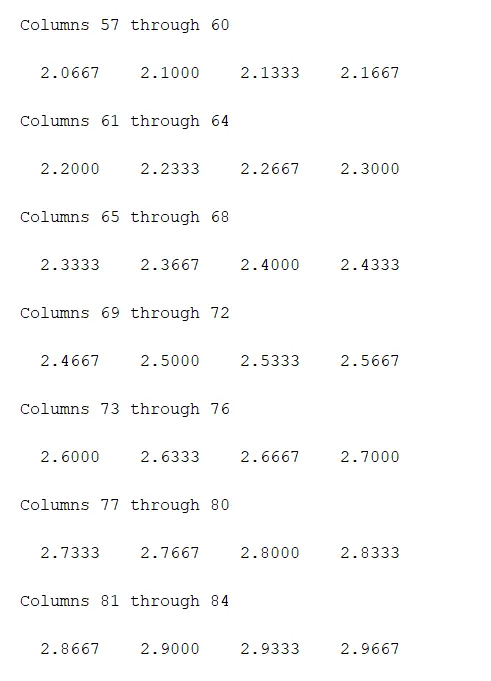
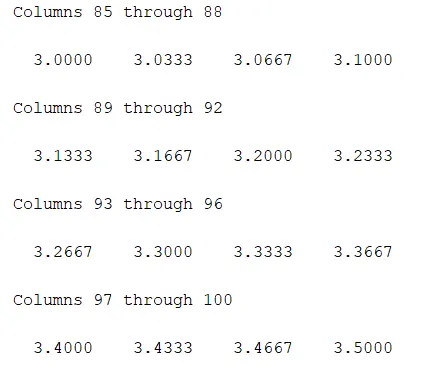
T_L=linspace(Low,High,100)
cp1=R*(A8+(A9.*T_L)+(A10.*T_L.^2)+(A11.*T_L.^3)+(A12.*T_L.^4));
H1=R*(A8+(A9.*T_L/2)+(A10.*(T_L.^2)/3)+(A11.*(T_L.^3)/4)+(A12.*(T_L.^4)/5)+A13.*T_L);
S1=R*(A8*log(T_L)+(A9.*T_L)+(A10.*(T_L.^2)/2)+(A11.*(T_L.^3)/3)+(A12.*(T_L.^4)/4)+A14);

% To create a folder

str = sprintf('C:\Users\lenovo\Desktop\Project1\Joseph', species);
mkdir(str);
cd(str);

figure()
plot(T_H,cp)
hold on

plot(T_L,cp1)
hold off
xlabel('Temparature')
ylabel('Specific heat')
legend('High temparture','low Temparature')
saveas(gcf,'Specific heat')

figure()
plot(T_H,H)
hold on
plot(T_L,H1)
hold off
xlabel('Temparature')
ylabel('Enthalpy')
legend('High temparture','low Temparature')
saveas(gcf,'Enthalpy')

figure()
plot(T_H,S)
hold on
plot (T_L,S1)
hold off
xlabel('Temparature')
ylabel('Entropy')
legend('High temparture','low Temparature')
saveas(gcf,'Entropy')

cd ..

%Calculating Molecular weight
elements =['H','C','N','0','AR','(S)'];
Atomic_weight=[1,12,14,16,40,0,0,0,0];
molecular_wt=0;

for k=1:length(species)
[num,status] = str2num (species (k));
if status==0
ind=find(elements==species(k));
molecular_wt(k)=Atomic_weight(ind);
else
molecular_wt(k-1)=num*molecular_wt(k-1);
end
end
t_M=sum(molecular_wt);
K = sprintf('Molecular weight of %s is %f', species,t_M);
disp(K)
end
Explanation
-Opening the thermo.dat
-By using fgetl we will be reading the first line
-By using strsplit we are splitting the line
-We have to write a formula for high and low temperatures
-mkdir to create a folder
-cd to hange current folder
Images
Outputs
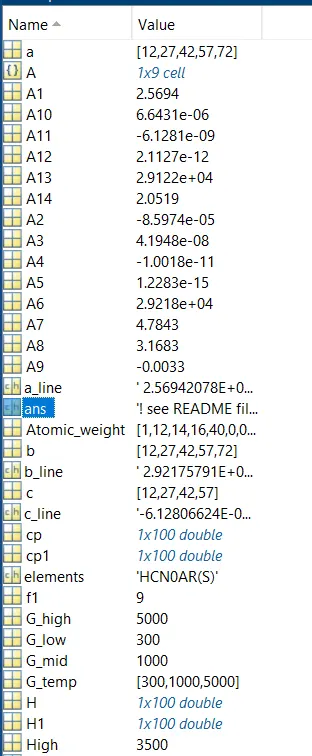
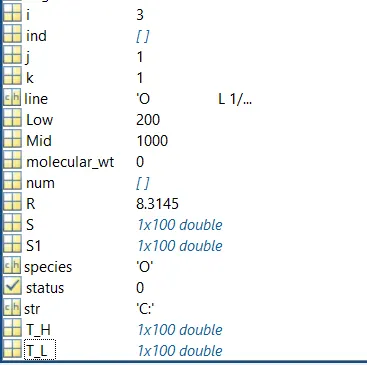
Data
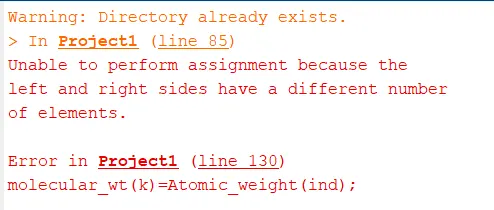
Errors
File
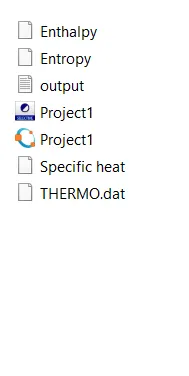
Rseult