Project 1 - Parsing NASA thermodynamic data
Aim:
In the above-given file, determine the thermodynamic properties such as specific heat capacity, enthalpy, entropy, and molecular weight of species of atoms.
Objectives:
- Write a function that extracts the 14 coefficients and calculates the enthalpy, entropy, and specific heats for all the species in the data file.
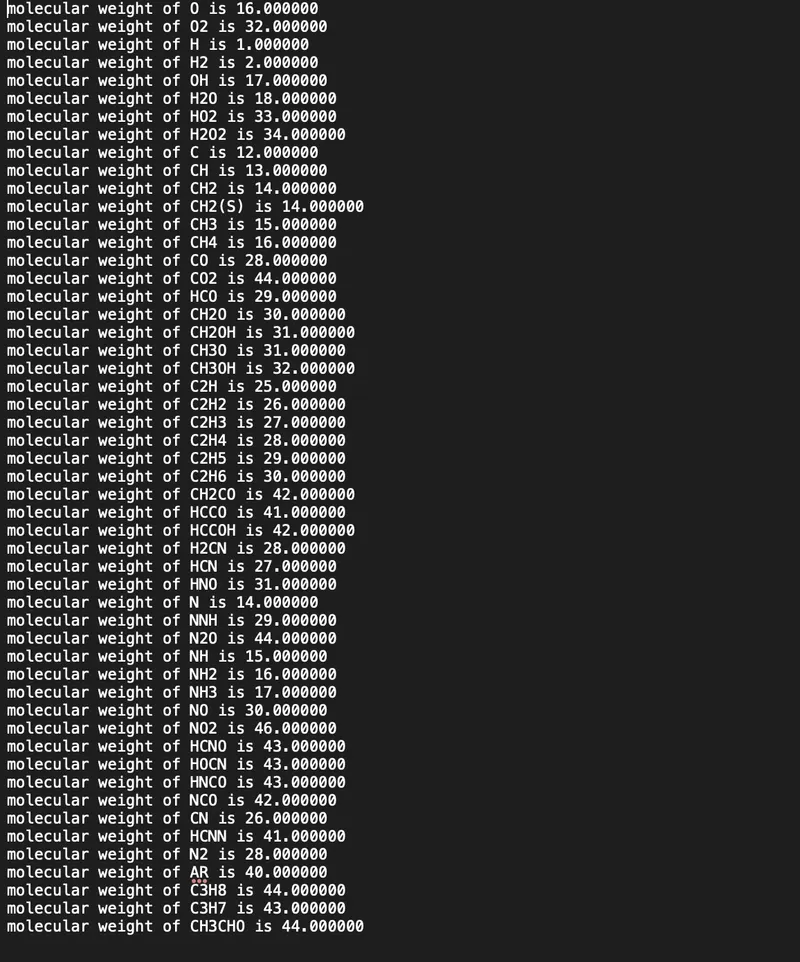
- Calculate the molecular weight of each species.
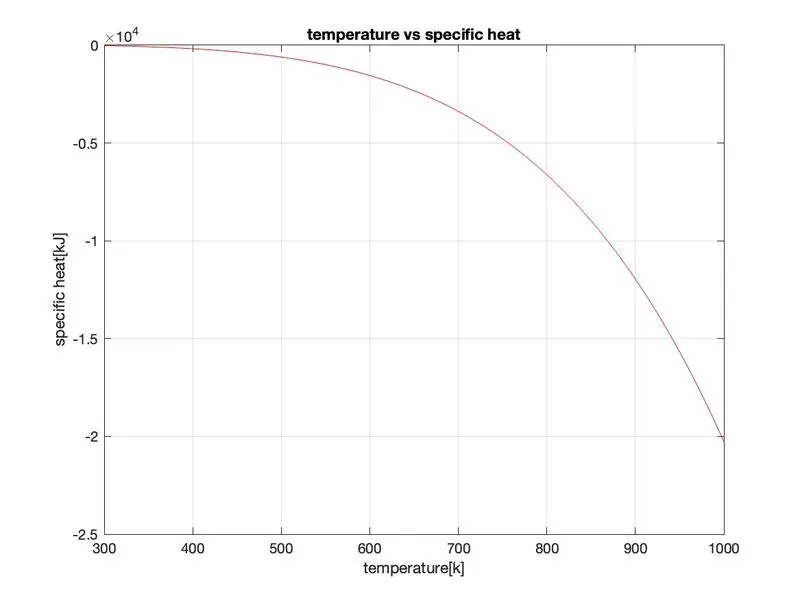
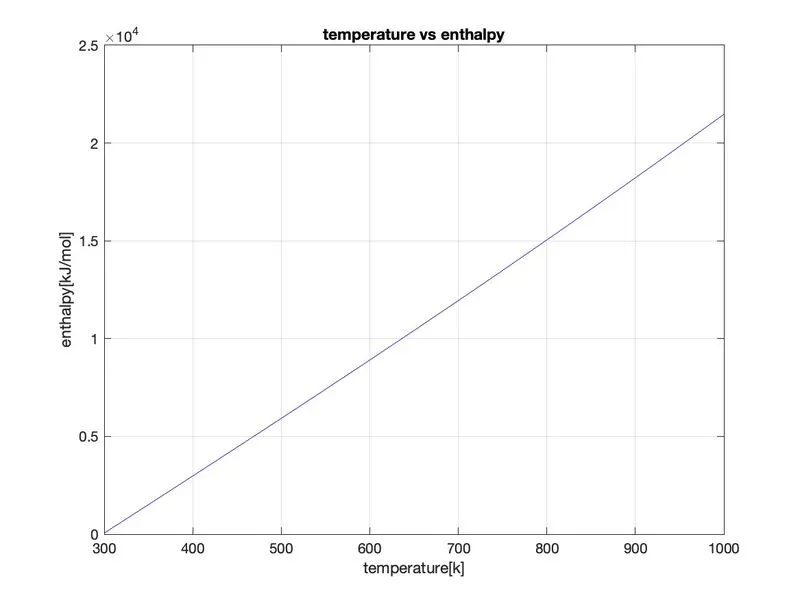
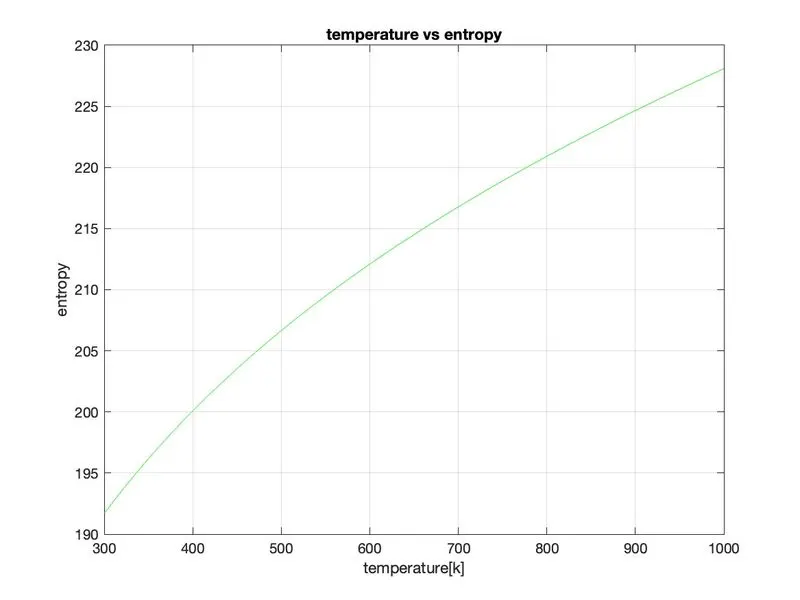
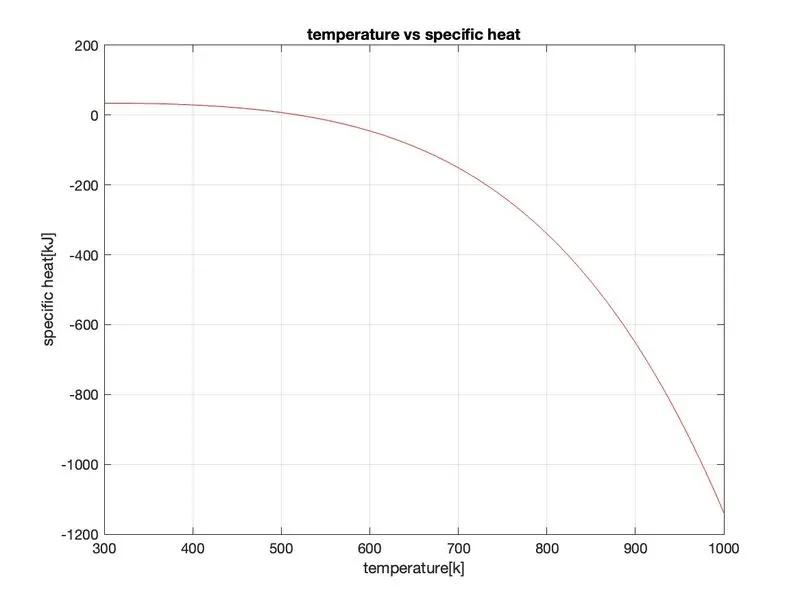
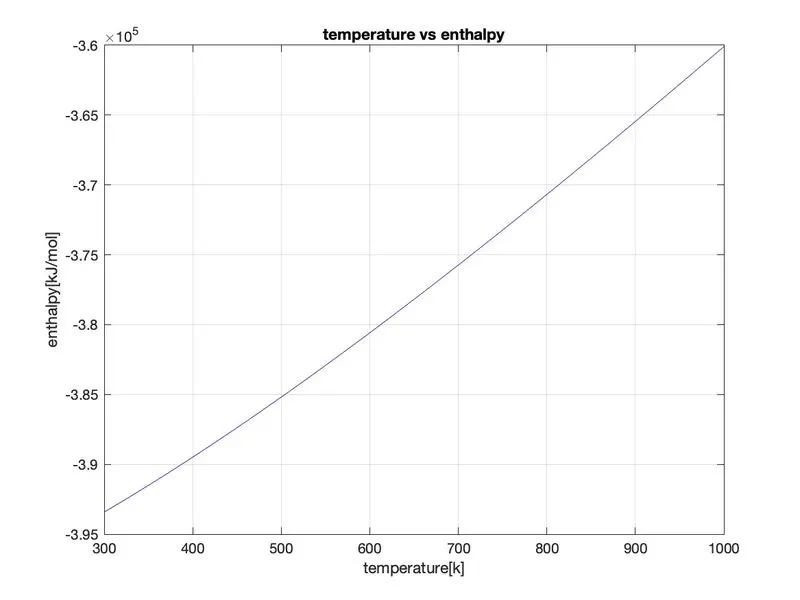
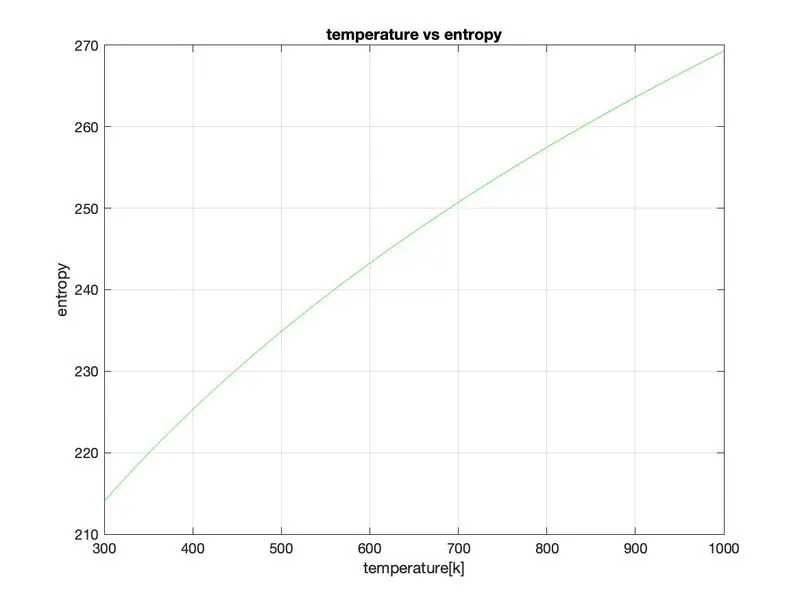
- Plot the Cp, Enthalpy, and Entropy for the local temperature range (low temperature: high temperature) specific for each species.
- Save the plots as images with appropriate names and dump them in separate folders for each species with a suitable name. All these should be generated automatically.
Theory:
- Specific heat: The amount of heat required to raise the temperature of 1 gram of a substance to 1 degree Celcius.
- Enthalpy: It is the measurement of energy in a thermodynamic system.
- Entropy: It is the measure of the disorder of the system
Logic for the code:
- Universal gas constant 'R' is given as input i.e. R=8.314.
- Open the thermodynamic data file.
- Read or extract the lines from the data file.
- Use 'for loop' to read or extract the species data.
- Create functions to calculate specific heat, enthalpy, entropy, and molecular weight.
- End the program.
Code:
Function to calculate the specific heat:
function [Cp]=specificheat(a1,a2,a3,a4,a5,b1,b2,b3,b4,b5,T,R)
t=1000;
%specific heat calculation
if T>t
    Cp=(a1+a2.*T+a3.*T^2+a4.*T^3+a5.*T^5).*R;
else
    Cp=(b1+b2.*T+b3.*T.^2+b4.*T.^3+b5.*T.^5).*R;
end
Function to calculate the enthalpy:
function [H]=enthalpy(a1,a2,a3,a4,a5,a6,b1,b2,b3,b4,b5,b6,T,R)
t=1000;
%enthalpy calculation
if T>t
    H=(a1.*T+(a2.*T.^2)./2+(a3.*T.^3)./3+(a4.*T.^4)./4+(a5.*T.^5)./5+a6).*R;
else
    H=(b1.*T+(b2.*T.^2)./2+(b3.*T.^3)./3+(b4.*T.^4)./4+(b5.*T.^5)./5+b6).*R;
end
Function to calculate the entropy:
function [S]=entropy(a1,a2,a3,a4,a5,a6,a7,b1,b2,b3,b4,b5,b6,b7,T,R)
t=1000;
%entropy calculation
if T>t
    S=(a1.*log(T)+a2.*T+a3.*(T.^2)./2+a4.*(T.^3)./3+a5.*(T.^4)./4+a7).*R
else
    S=(b1.*log(T)+b2.*T+b3.*(T.^2)./2+b4.*(T.^3)./3+b5.*(T.^4)./4+b7).*R
end
Function to calculate molecular weight:
function [Mw]=mol_wt(species)
elements=['H','O','C','N','A'];
at_wt=[1,16,12,14,40];
Mw=0;

for i=1:length(species)
    for j=1:length(elements)

        if strcmpi(species(i),elements(j))==1
            Mw=Mw+at_wt(j)
            position=j
        end
    end
    n=str2num(species(i));
    if n>1
        Mw=Mw+at_wt(position)*(n-1);
    end
end
disp(['molecular weight of',species,'is']);
disp(Mw)
end
Main program to extract all the parameters and save them in different files:
clear all
close all
clc

%universal gas constant
R=8.314;

%reading the file
f1=fopen('THERMO.txt','r')
%creating a file for molecular weight
f2=fopen('molecular weight.txt','w')

header=fgetl(f1)

%global temperature
l1=fgetl(f1)

for i=1:3
    l2=fgetl(f1)
end

T=linspace(300,1000,200);

for i=1:52
    l3=fgetl(f1);
    A=strsplit(l3,' ');

    species=strtok(l3,' ');

    %coefficient of species
    a=fgetl(f1);
    b=fgetl(f1);
    c=fgetl(f1);

    %exponential extraction
    d=strfind(a,'E');
    e=strfind(b,'E');
    f=strfind(c,'E');

    %high temperature coefficients
    a1=str2num(a(1:d(1)+3));
    a2=str2num(a(d(1)+4:d(2)+3));
    a3=str2num(a(d(2)+4:d(3)+3));
    a4=str2num(a(d(3)+4:d(4)+3));
    a5=str2num(a(d(4)+4:d(5)+3));
    a6=str2num(b(1:e(1)+3));
    a7=str2num(b(e(1)+4:e(2)+3));

    %low temperature coefficients
    b1=str2num(b(e(2)+4:e(3)+3));
    b2=str2num(b(e(3)+4:e(4)+3));
    b3=str2num(b(e(4)+4:e(5)+3));
    b4=str2num(c(1:f(1)+3));
    b5=str2num(c(f(1)+4:f(2)+3));
    b6=str2num(c(f(2)+4:f(3)+3));
    b7=str2num(c(f(3)+4:f(4)+3));

    %calculating Cp, H, S and mol_wt
    [Cp]=specificheat(a1,a2,a3,a4,a5,b1,b2,b3,b4,b5,T,R);
    [H]=enthalpy(a1,a2,a3,a4,a5,a6,b1,b2,b3,b4,b5,b6,T,R);
    [S]=entropy(a1,a2,a3,a4,a5,a6,a7,b1,b2,b3,b4,b5,b6,b7,T,R);
    [Mw]=mol_wt(species);

    %creating folder for species
    mkdir(species);
    current_dir=pwd;
    cd(species)

    %plotting
    %temperature vs. specific heat
    figure(1)
    plot(T,Cp,'Color','r')
    xlabel('temperature[k]')
    ylabel('specific heat[kJ]')
    title('temperature vs specific heat');
    grid on
    image=getframe(gcf)
    imwrite(image.cdata,'T vs Cp.png')
    saveas(1,'specific heat','jpg')

    %temperature vs. enthalpy
    figure(2)
    plot(T,H,'Color','b')
    xlabel('temperature[k]')
    ylabel('enthalpy[kJ/mol]')
    title('temperature vs enthalpy');
    grid on
    image=getframe(gcf)
    imwrite(image.cdata,'T vs H.png')
    saveas(2,'enthalpy','jpg')

    %temperature vs. entropy
    figure(3)
    plot(T,S,'Color','g')
    xlabel('temperature[k]')
    ylabel('entropy')
    title('temperature vs entropy');
    grid on
    image=getframe(gcf)
    imwrite(image.cdata,'T vs S.png')
    saveas(3,'entropy','jpg')

    %changing the folder
    cd(current_dir);
    fprintf(f2,'molecular weight of %s is %f',species);
end
fclose(f2);
fclose(f1);
Results:
Automatically saved files into folder:

Plots:
O2-
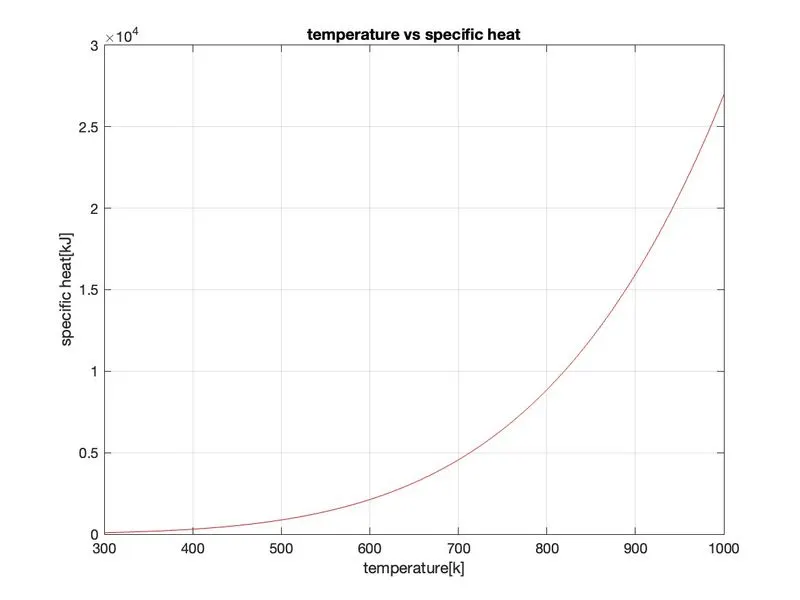
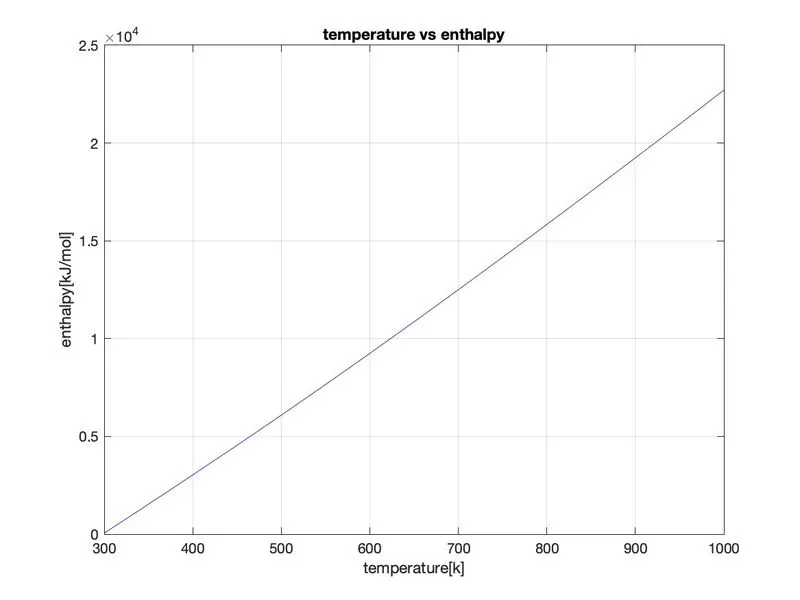
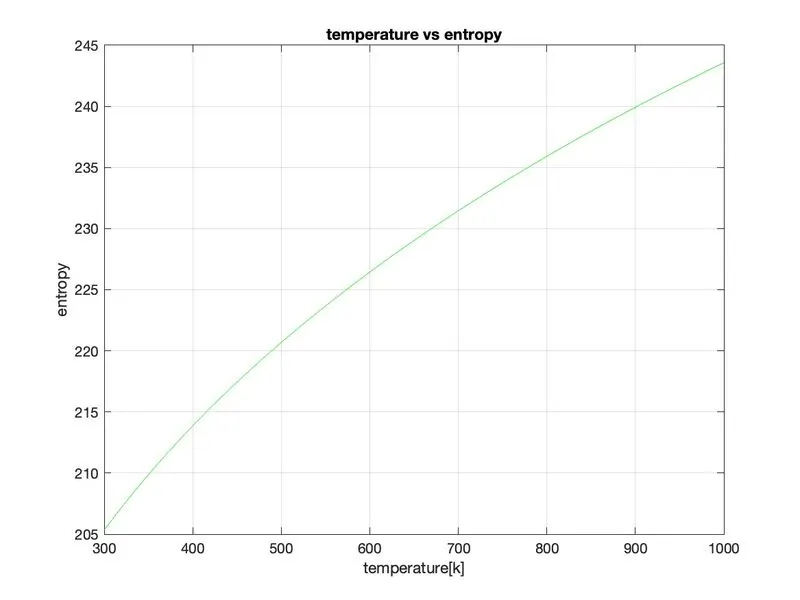
N2-
CO2-
Molecular weight: