Project 1 - Parsing NASA thermodynamic data
Aim:
To write a code in MATLAB to parse the NASA thermodynamic data file and then calculate the Thermodynamic properties, Molecular Weight and Plot nature of the thermodynamic properties of various species.
Objectives:
1. To write a function that extracts the 14 co-efficient for a given species from the given species
2. To write functions that calculate the enthalpy, entropy and specific heat using the NASA polynomials for the given species
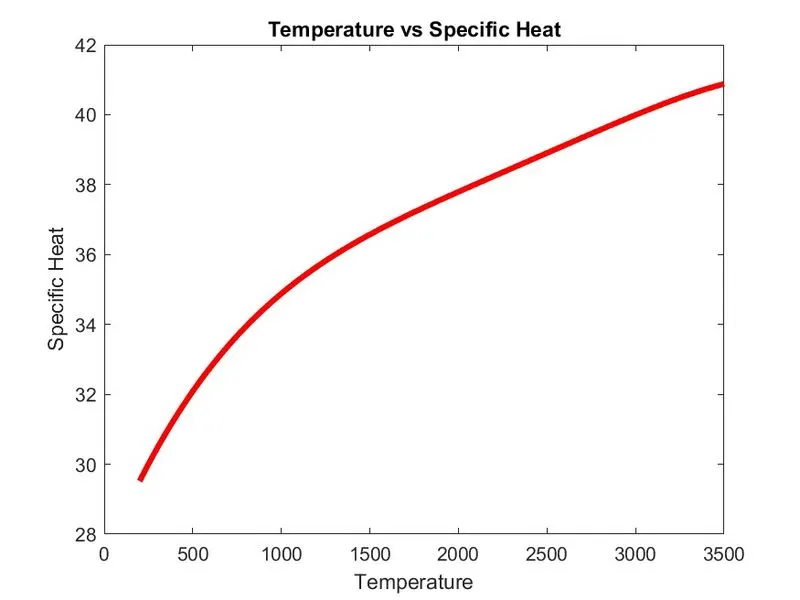
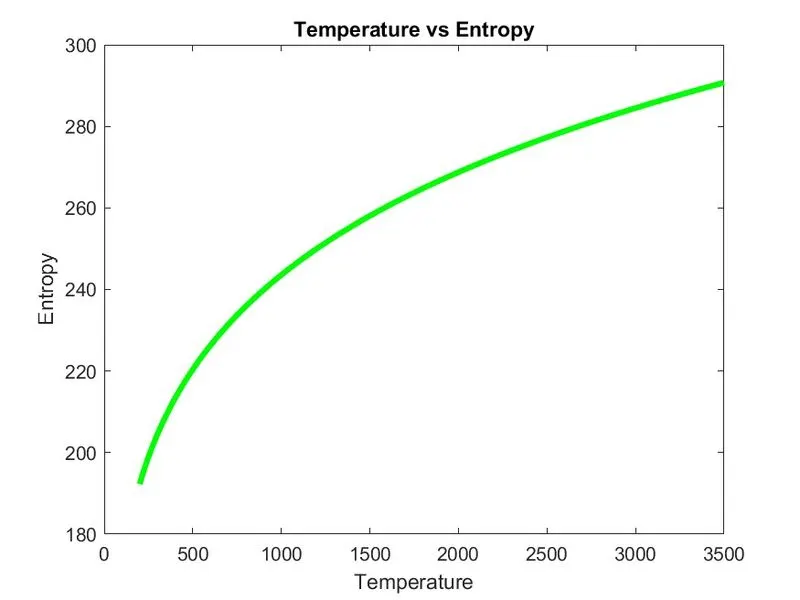
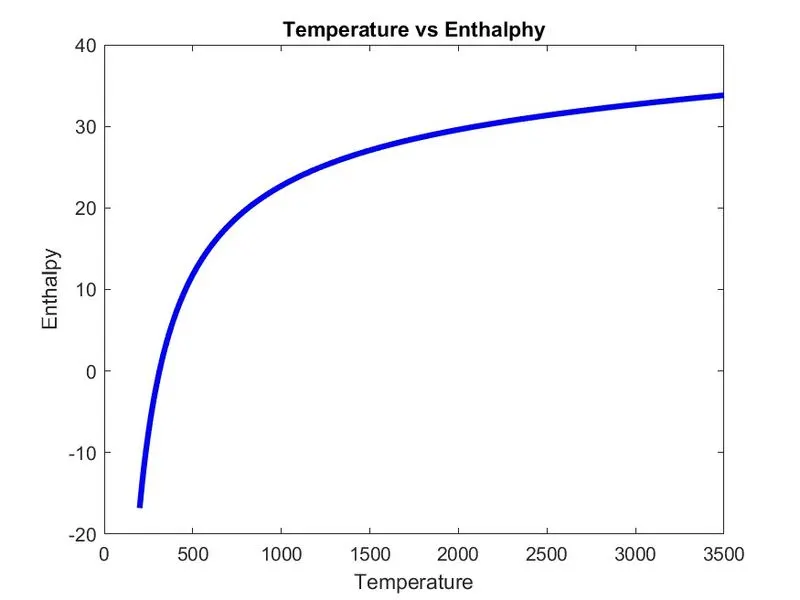
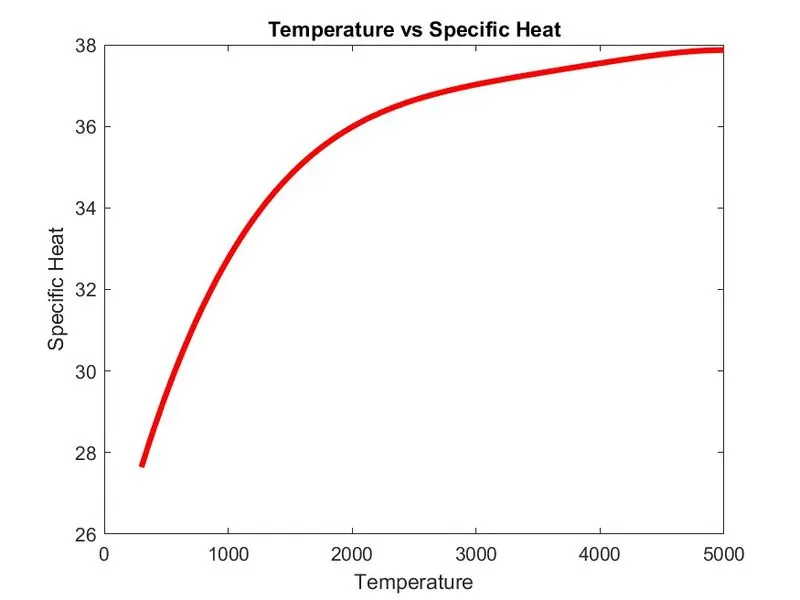
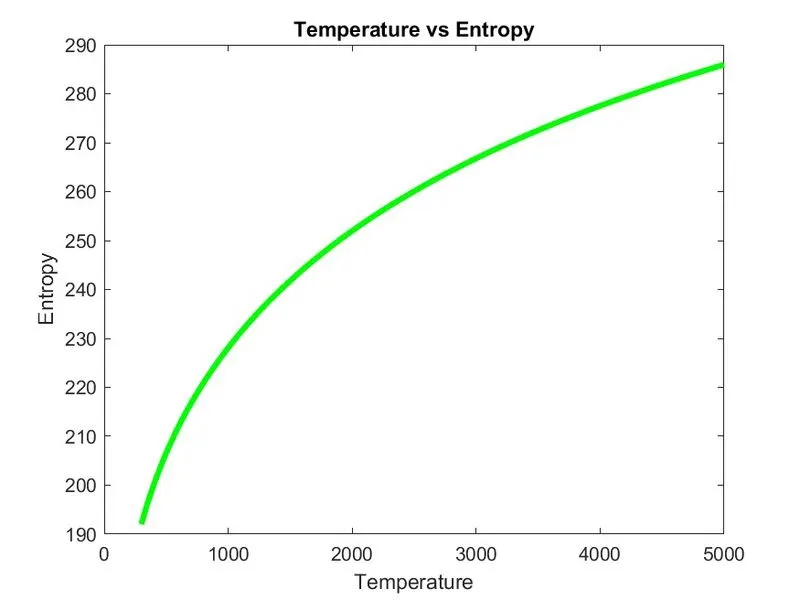
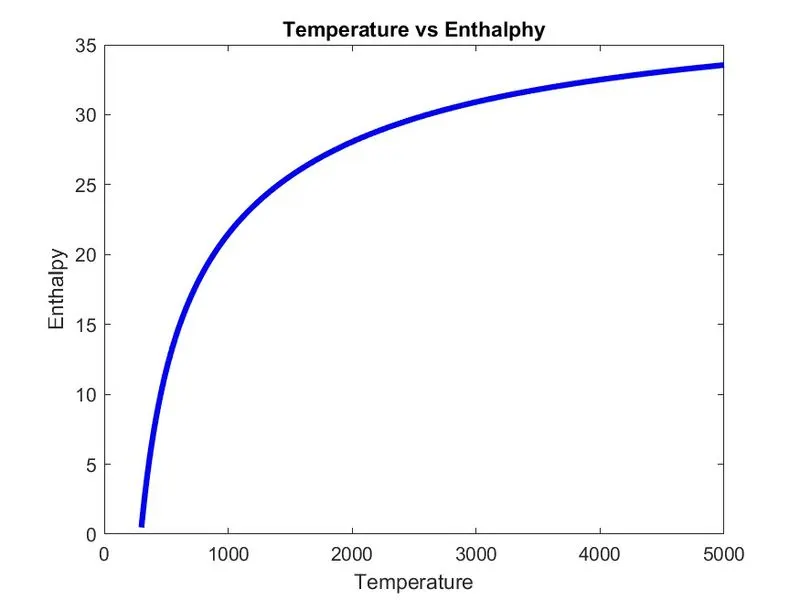
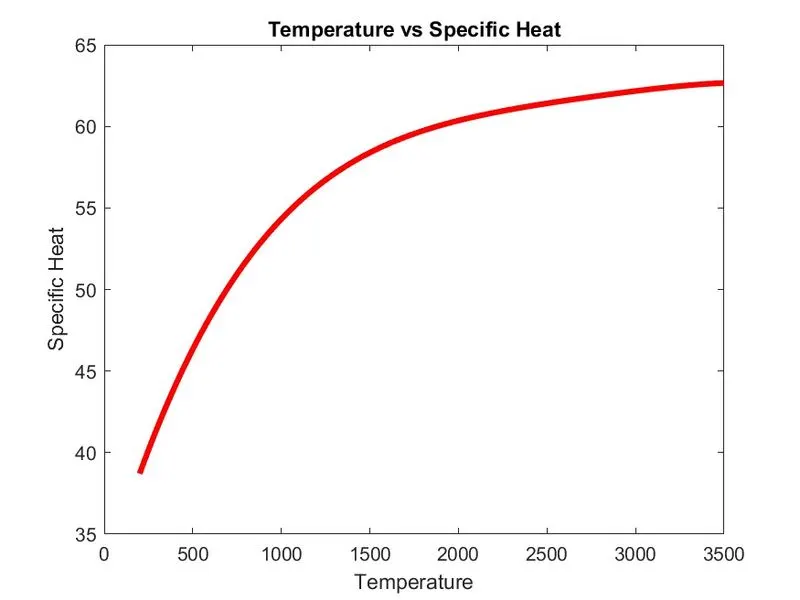
3. To write a function that plots the Cp, Enthalpy, and Entropy of an input species.
4. To write a function that calculates the molecular weight of each species.
Introduction:
1) Parsing
Parsing a file means reading in a data stream of some sort and building an in-memory model of the semantic content of that data, in other words, file parsing refers to how information can be read from a particular teste or any type of file and how that information can be used to in a computer program Test parsing is a common programming task that splits the given sequence of characters or values(test) into smaller parts based on some rules it has been used in a wide variety of applications ranging from simple fe posing to large scale natural language processing. For example, NASA come up with polynomials such as CpH and S. They have also documented the coefficients that are required to evaluate these polynomials for 1000+ species.
2) NASA Thermodynamic Data:
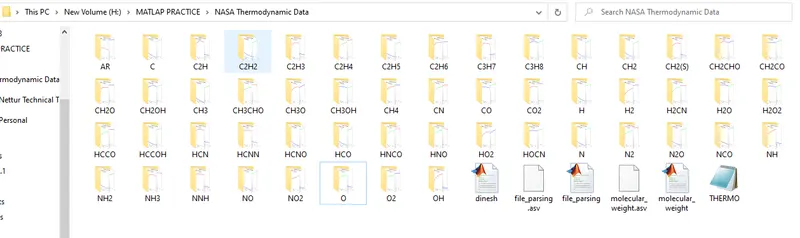
THERMO.dat tile is a data file containing 14 coefficients for 53 different elements given by NASA These coefficients are used to calculate the enthalpy entropy and specific heats for all the species in the data file. Each species o has its own range of local temperatures.
3) Specific Heat Capacity (Cp) :
Specific Heat capacity is the amount of heat to be supplied to(or taken out) of the unit more of a system in order to increase(or decrease) its temperature by one degree in a thermodynamic process in which quantity X is imposed.

4) Enthalpy. H(kJ):
It is a thermodynamic quantity equivalent to the total heat content of a system, it is equal to the internal energy of the system plus the product of pressure and volume.

5) Entropy S (kJ/k):
Entropy is the measure of a system's thermal energy per unit temperature that is unavailable for doing useful work Because work is obtained from ordered molecular motion, the amount of entropy is also a measure of the molecular disorder, or randomness, of a system

Main Program:
clear all
close all
clc

f1 = fopen('THERMO.dat','r');
fgetl(f1);
pline = fgetl(f1);
B = strsplit(pline,' ');
global_low_temp = str2num(B{2});
global_medium_temp = str2num(B{3});
global_high_temp = str2num(B{4});
fgetl(f1);
fgetl(f1);
fgetl(f1);

for m = 1:53

% Getting the Temperature.
tline = fgetl(f1);
K = strsplit(tline,' ');
sp = (K{1});
local_low_tem = str2num(K{end-3});
local_high_tem = str2num(K{end-2});
local_medium_tem = str2num(K{end-1});

% Getting the Coefficient 1
coeff_1 = fgetl(f1);
c = findstr(coeff_1,'E');
coeff_1(1:12+3);

c1 = str2double(coeff_1(1:c(1)+3));
c2 = str2double(coeff_1(c(1)+4:c(2)+3));
c3 = str2double(coeff_1(c(2)+4:c(3)+3));
c4 = str2double(coeff_1(c(3)+4:c(4)+3));
c5 = str2double(coeff_1(c(4)+4:c(5)+3));

% Getting the Coefficient 2
coeff_2 = fgetl(f1);
d = findstr(coeff_2,'E');
coeff_2(1:12+3);

c6 = str2double(coeff_2(1:d(1)+3));
c7 = str2double(coeff_2(d(1)+4:d(2)+3));
c8 = str2double(coeff_2(d(2)+4:d(3)+3));
c9 = str2double(coeff_2(d(3)+4:d(4)+3));
c10 = str2double(coeff_2(d(4)+4:d(5)+3));


% Getting the Coefficient 3
coeff_3 = fgetl(f1);
e = findstr(coeff_3,'E');
coeff_3(1:12+3);

c11 = str2double(coeff_3(1:e(1)+3));
c12 = str2double(coeff_3(e(1)+4:e(2)+3));
c13 = str2double(coeff_3(e(2)+4:e(3)+3));
c14 = str2double(coeff_3(e(3)+4:e(4)+3));

T = linspace(local_low_tem,local_high_tem,1000);
Tmid = [local_medium_tem];
R = 8.314;
[CP,H,S] = dinesh(T,Tmid,R,c1,c2,c3,c4,c5,c6,c7,c8,c9,c10,c11,c12,c13,c14);


% PLOTTING TEMPERATURE & cp
figure(1)
plot(T,CP,'linewidth',3,'Color','r');
xlabel('Temperature');
ylabel('Specific Heat');
title('Temperature vs Specific Heat');

% PLOTTING TEMPERATURE & S
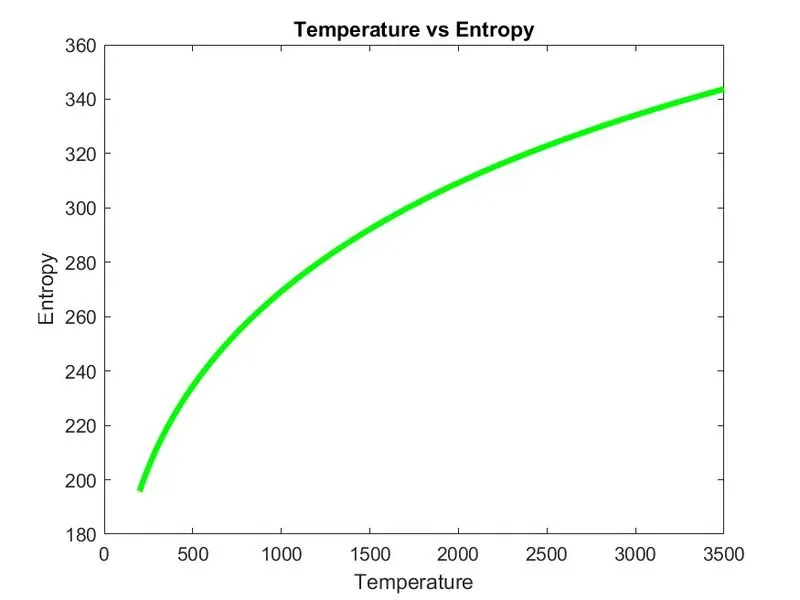
figure(2)
plot(T,S,'linewidth',3,'Color','g');
xlabel('Temperature');
ylabel('Entropy');
title('Temperature vs Entropy');

% PLOTTING TEMPERATURE & H
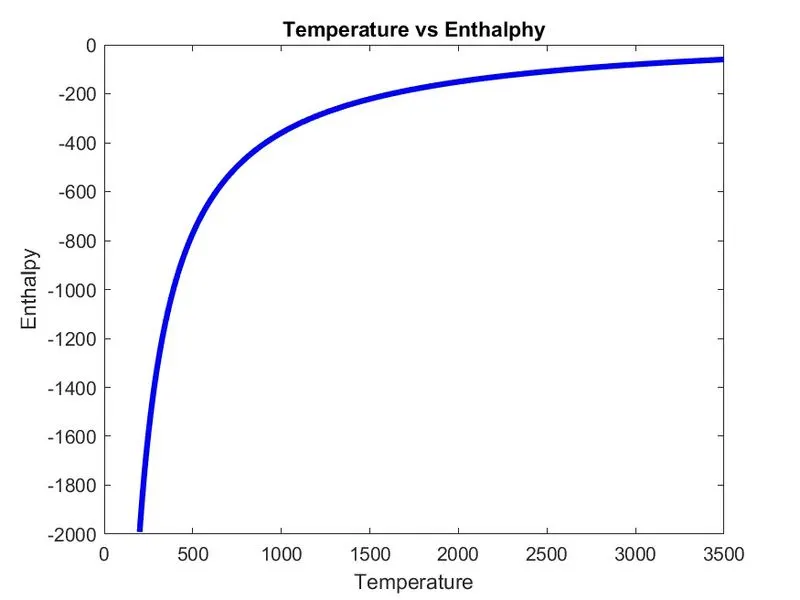
figure(3)
plot(T,H,'linewidth',3,'Color','b');
xlabel('Temperature');
ylabel('Enthalpy');
title('Temperature vs Enthalphy');

% saving the plots
mkdir(sp);
cd(sp);

saveas(figure(1),'species plot1.jpg');
saveas(figure(2),'species plot2.jpg');
saveas(figure(3),'species plot3.jpg');
cd ..

[mol_weight_cal] = molecular_weight(sp);


end
Program Explanation:
Initially, the file has been opened by using the command fopen.
And then the data has been extracted from the given file. Then the fgetl(f1) command is used to skip the first lines in the file.
function [CP,H,S] = dinesh(T,Tmid,R,c1,c2,c3,c4,c5,c6,c7,c8,c9,c10,c11,c12,c13,c14)
R = 8.314;

if T<= Tmid
    CP = ((c8) + (c9.*T) + (c10.*T.^2) + (c11.*T.^3) + (c12.*T.^4))*R;

    H = ((c8) + ((c9.*T)/2) + ((c10.*T.^2)/3) + ((c11.*T.^3)/4) + ((c12.*T.^4)/5) + (c13./T))*R;

    S = ((c8.*log(T)) + (c9.*T) + (c10.*T.^2)./2 + (c11.*T.^3)./3 + (c12.*T.^4)./4 + c14).*R;

else
    CP = ((c1) + (c2.*T) + (c3.*T.^2) + (c4.*T.^3) + (c5.*T.^4))*R;

    H = ((c1) + ((c2.*T)/2) + ((c3.*T.^2)/3) + ((c4.*T.^3)/4) + ((c5.*T.^4)/5) + (c6./T))*R;

    S = ((c1.*log(T)) + (c2.*T) + ((c3.*T.^2)./2) + ((c4.*T.^3)./3) + ((c5.*T.^4)./4) + c7).*R;


end
end
Program Explanation:
The FIRST 7 coefficients are HIGH-temperature coefficients and the SECOND 7 coefficients are LOW-temperature coefficients.
As per this requirement, we are using temperature from 0 to Tmid for the last 7 coefficients. Tmid to Tmax for the first 7 coefficients. using the if Command in MatLab.
In this function, we are defining the formula for Enthalpy, Entropy & Specific heat.
% calculating the Molecular weight
function mol_weight_cal = molecular_weight(sp)
species = sp;
elements = ['H','C','O','N','Ar'];
atomic_weight = [1.00794,12.0107,15.999,14.0067,39.948];
mol_weight_cal = 0;
for i = 1:length(species);
for j = 1:length(elements);
if species(i)==elements(j)
mol_weight_cal=mol_weight_cal+atomic_weight(j);
position = j;
end
end
n = str2num(species(i));
if n>1
mol_weight_cal = mol_weight_cal + atomic_weight(position)*(n-1);
end
end
fprintf('Molecular weight of %s = %f',sp,mol_weight_cal);
disp(' ')
end
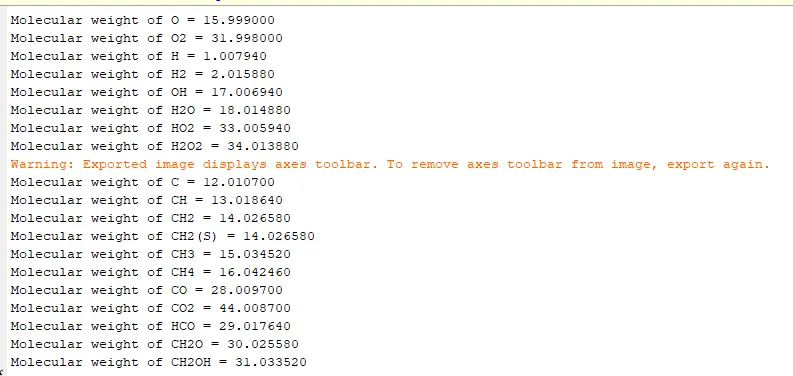
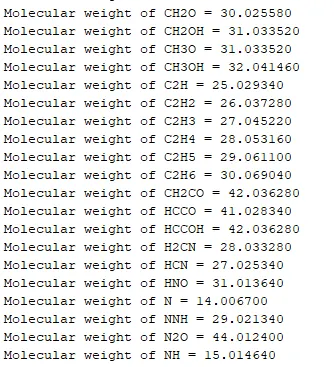
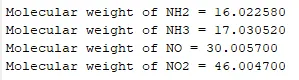
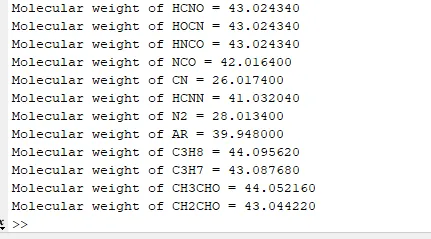
This calling function code helps us to calculate the molecular weight of the various gases in the given NASA file.
The calculation of molecular weight is by assigning the atomic weight of the gases. Same as calculating S, H, Cp for loop has been used for calculation
Consider the Mw as 0 and put a range of length(species), and j range of length (elements).
And the command "if'' is used to compare the atomic weight and molecular weight of all species And then compare if (n>)) then the molecular weight of all gases has been calculated.