Project 1 - Parsing NASA thermodynamic data
Courser: MATLAB for Mechanical Engineers
Challenge: Parsing NASA thermodynamic data
Submitted By: Amanpreet Singh Whan
1 Aim:
The Project 1 challenge aims to write a program to perform data analysis or parsing of the given Thermo.dat file using MATLAB software.
2 Theory and Governing Equations:
Data analysis is a process of inspecting, cleansing, transforming, and modeling data to discover useful information, informing conclusions, and supporting decision-making. Data analysis has multiple facets and approaches, encompassing diverse techniques under a variety of names, and is used in different business, science, and social science domains. In today's business world, data analysis plays a role in making decisions more scientific and helping businesses operate more effectively.
Process of Data Analysis:
Analysis refers to dividing a whole into its separate components for individual examination. Data analysis is a process for obtaining raw data and subsequently converting it into information useful for decision-making by users. Data is collected and analyzed to answer questions, test hypotheses, or disprove theories
Statistician John Tukey, defined data analysis in 1961, as:
Procedures for analyzing data, techniques for interpreting the results of such procedures, ways of planning the gathering of data to make its analysis easier, more precise, or more accurate, and all the machinery and results of (mathematical) statistics which apply to analyzing data.
Several phases can be distinguished, described below.
Data Requirements – Data Collection – Data Processing – Data Cleaning – Exploratory Data Analysis
3 Objectives:
The objectives of the Project 1 challenges are as follows:
- Write a program that can perform data analysis of the given NASA Thermo.dat file.
- The Program should extract the 14 coefficients and calculates the enthalpy, entropy, and specific heats for all the species in the data file.
- Calculate the molecular weight of each species.
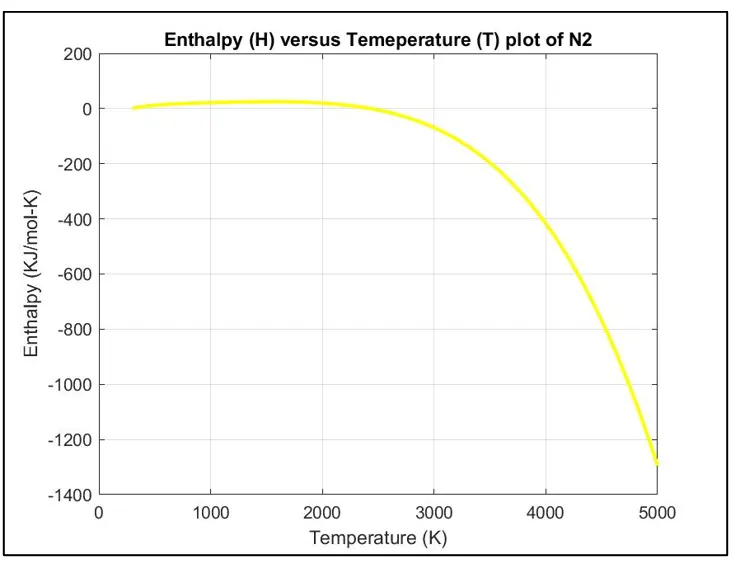
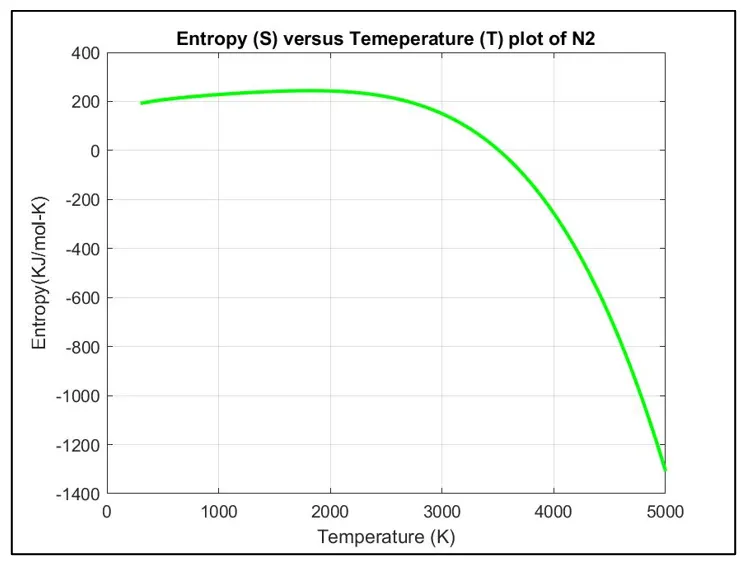
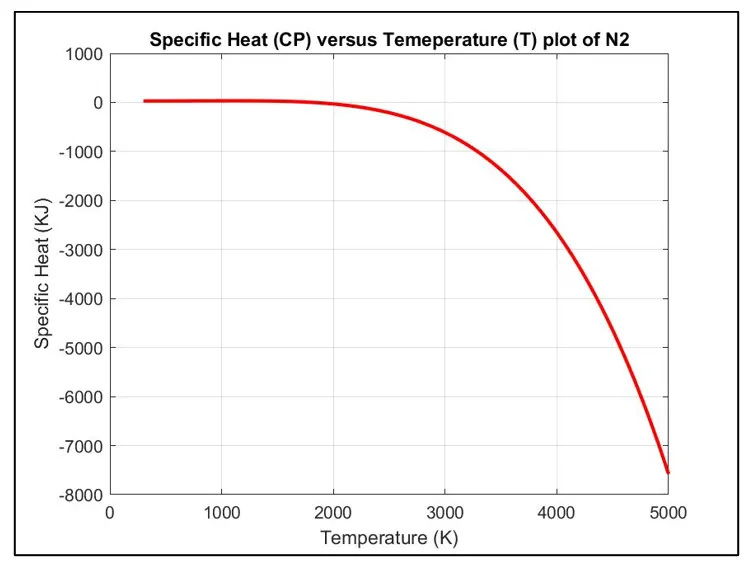
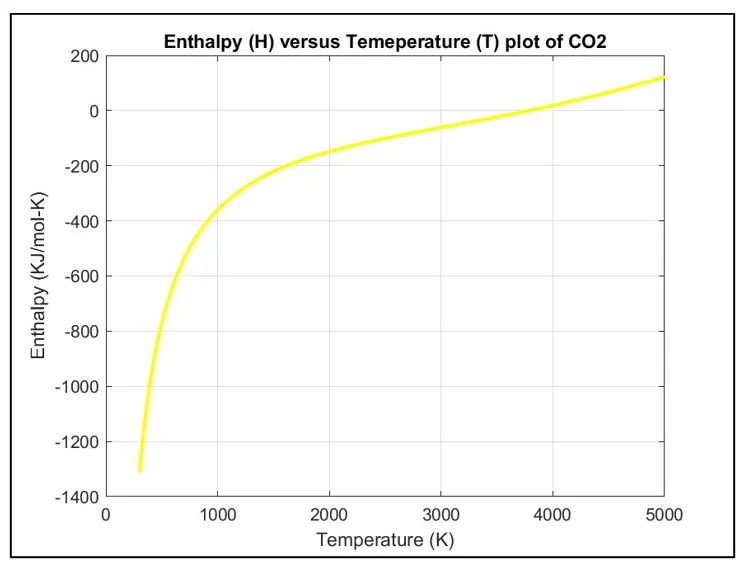
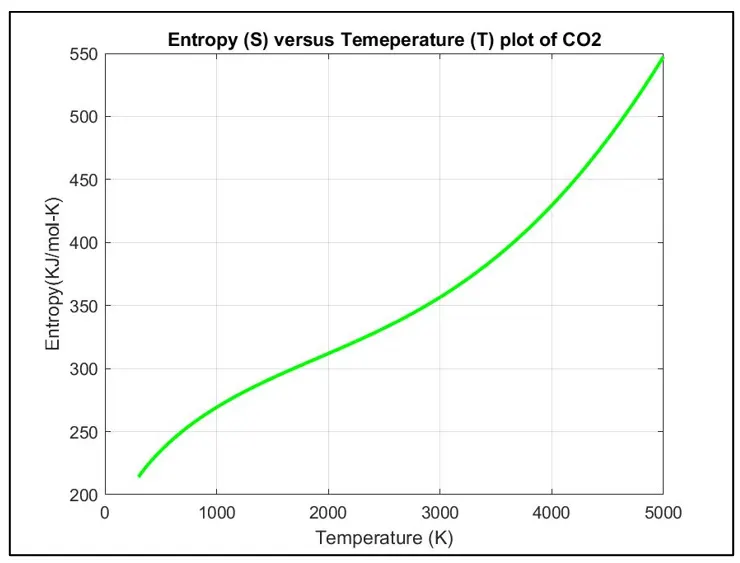
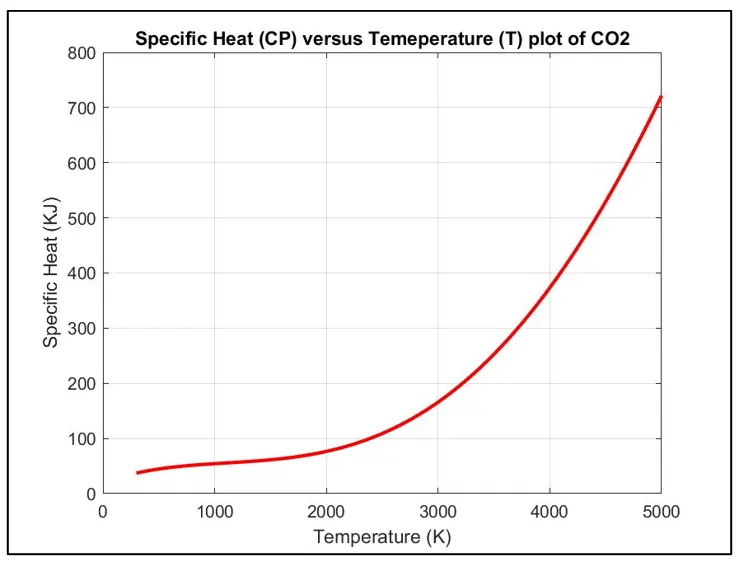
- Lastly, Plot the Cp, Enthalpy, and Entropy for the local temperature range specified for each species.
4 Body of the Content:
MATLAB (an abbreviation of "MATrix LABoratory") is a proprietary multi-paradigm programming language and numeric computing environment developed by MathWorks. MATLAB allows matrix manipulations, plotting of functions and data, implementation of algorithms, creation of user interfaces, and interfacing with programs written in other languages. Although MATLAB is intended primarily for numeric computing, an optional toolbox uses the MuPAD symbolic engine allowing access to symbolic computing abilities. An additional package, Simulink, adds graphical multi-domain simulation and model-based design for dynamic and embedded systems.
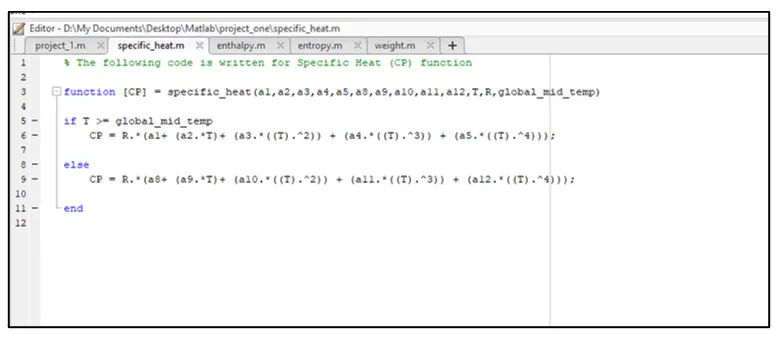
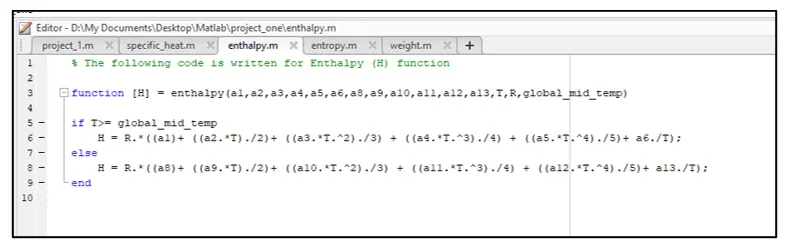
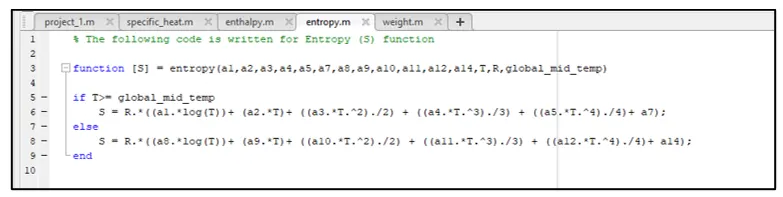
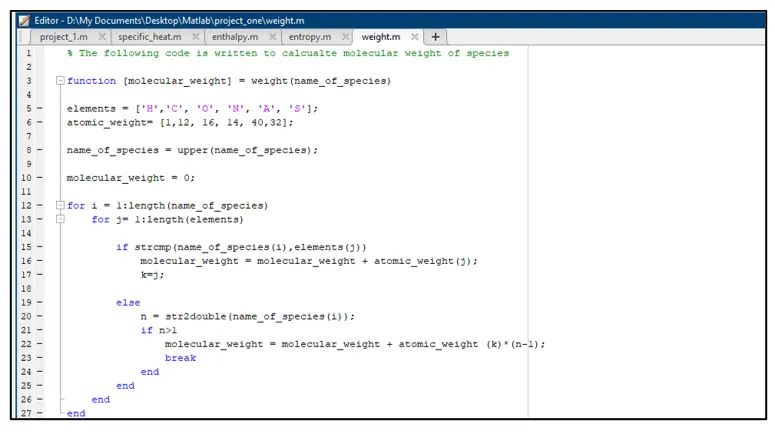
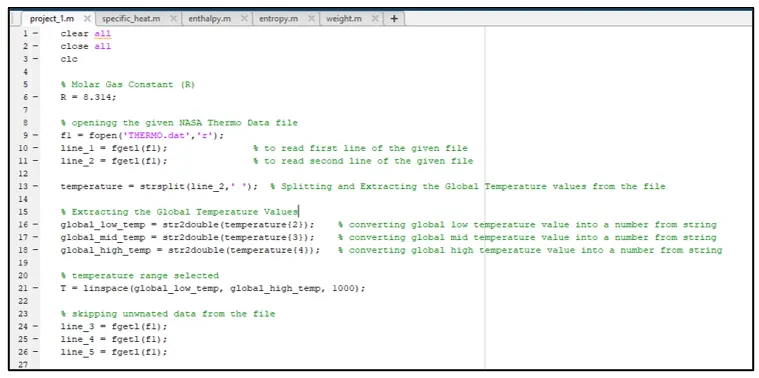
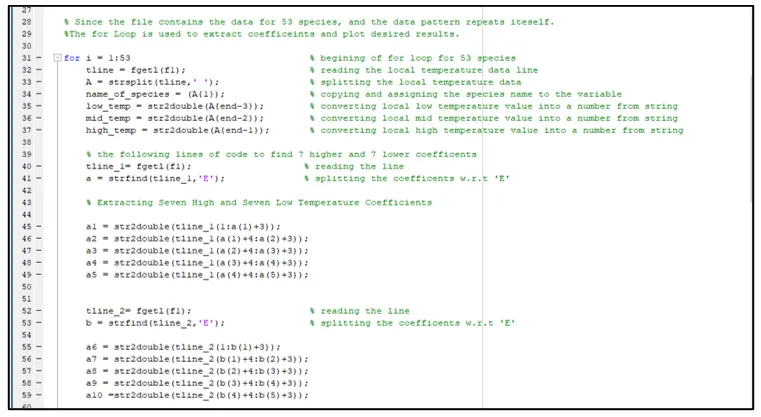
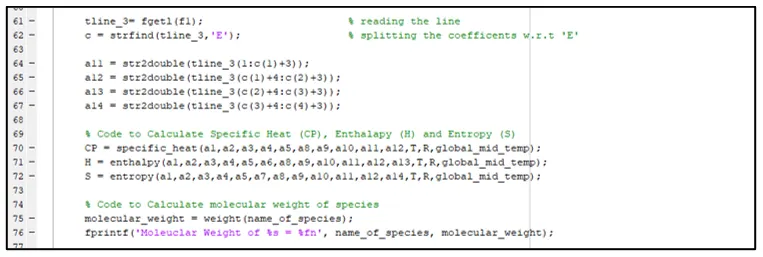
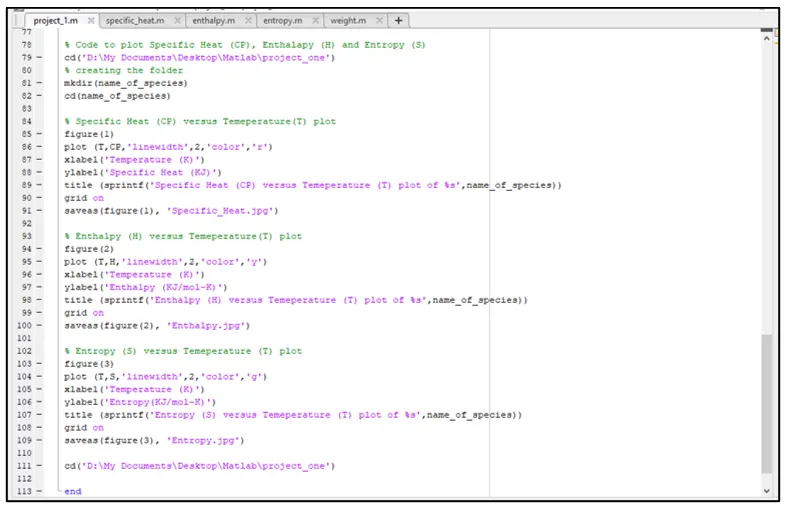
The code was written to fulfill the requirements of the Project 1 challenge and is attached in the following figures. In addition, the created plots from the written code are attached as well.
Specific Heat Function
Enthalpy Function
Entropy Function
Molecular Weight Function
Main Code
Results:
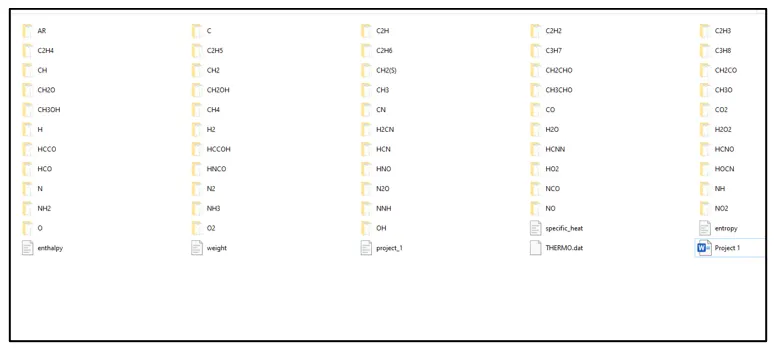
Plots for O2
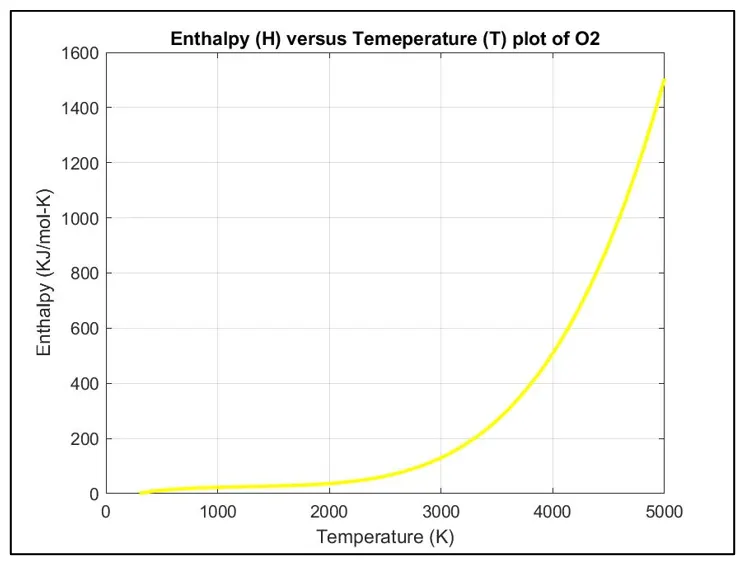
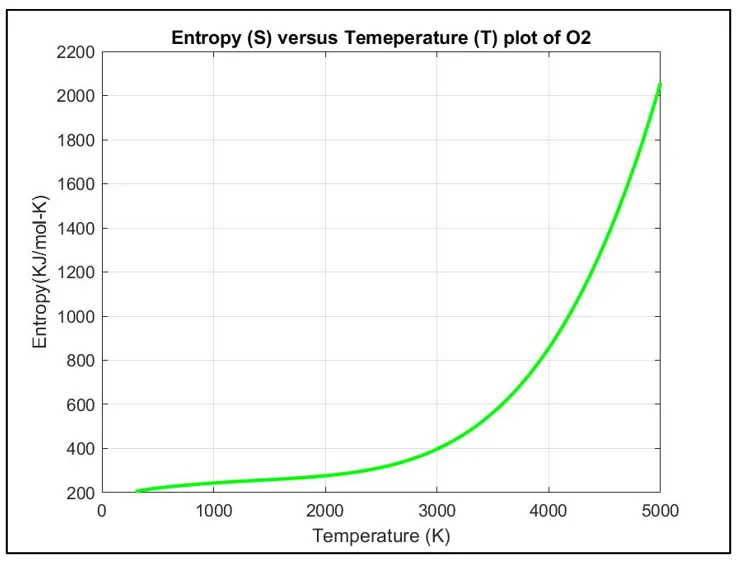
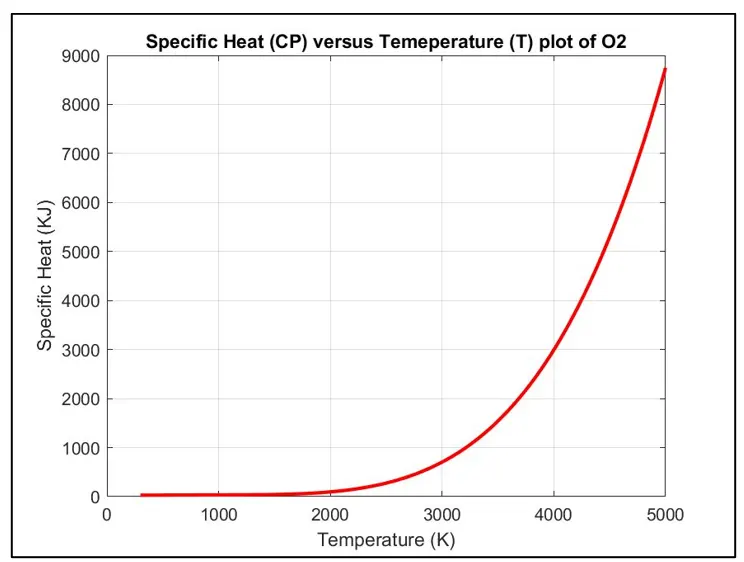
Plots for N2
Plots for CO2
5 Conclusion:
In conclusion, the main aim of the Project 1 challenge is to write a MATLAB program that can perform data analysis or parsing of the given NASA Thermo.dat file and plot the graphs as per the challenge requirements.
6 Appendix :
Main Code:
clear all
close all
clc

% Molar Gas Constant (R)
R = 8.314;

% openingg the given NASA Thermo Data file
f1 = fopen('THERMO.dat','r');
line_1 = fgetl(f1);               % to read first line of the given file
line_2 = fgetl(f1);               % to read second line of the given file

temperature = strsplit(line_2,' ');  % Splitting and Extracting the Global Temperature values from the file

% Extracting the Global Temperature Values
global_low_temp = str2double(temperature{2});    % converting global low temperature value into a number from string
global_mid_temp = str2double(temperature{3});    % converting global mid temperature value into a number from string
global_high_temp = str2double(temperature{4});   % converting global high temperature value into a number from string

% temperature range selected
T = linspace(global_low_temp, global_high_temp, 1000);

% skipping unwnated data from the file
line_3 = fgetl(f1);
line_4 = fgetl(f1);
line_5 = fgetl(f1);

% Since the file contains the data for 53 species, and the data pattern repeats iteself.
%The for Loop is used to extract coefficeints and plot desired results.

for i = 1:53                                % begining of for loop for 53 species
    tline = fgetl(f1);                      % reading the local temperature data line
    A = strsplit(tline,' ');                % splitting the local temperature data
    name_of_species = (A{1});               % copying and assigning the species name to the variable
    low_temp = str2double(A{end-3});        % converting local low temperature value into a number from string
    mid_temp = str2double(A{end-2});        % converting local mid temperature value into a number from string
    high_temp = str2double(A{end-1});       % converting local high temperature value into a number from string

    % the following lines of code to find 7 higher and 7 lower coefficents
    tline_1= fgetl(f1);                    % reading the line
    a = strfind(tline_1,'E');              % splitting the coefficents w.r.t 'E'

    % Extracting Seven High and Seven Low Temperature Coefficients

    a1 = str2double(tline_1(1:a(1)+3));
    a2 = str2double(tline_1(a(1)+4:a(2)+3));
    a3 = str2double(tline_1(a(2)+4:a(3)+3));
    a4 = str2double(tline_1(a(3)+4:a(4)+3));
    a5 = str2double(tline_1(a(4)+4:a(5)+3));


    tline_2= fgetl(f1);                     % reading the line
    b = strfind(tline_2,'E');               % splitting the coefficents w.r.t 'E'

    a6 = str2double(tline_2(1:b(1)+3));
    a7 = str2double(tline_2(b(1)+4:b(2)+3));
    a8 = str2double(tline_2(b(2)+4:b(3)+3));
    a9 = str2double(tline_2(b(3)+4:b(4)+3));
    a10 =str2double(tline_2(b(4)+4:b(5)+3));

    tline_3= fgetl(f1);                       % reading the line
    c = strfind(tline_3,'E');                 % splitting the coefficents w.r.t 'E'

    a11 = str2double(tline_3(1:c(1)+3));
    a12 = str2double(tline_3(c(1)+4:c(2)+3));
    a13 = str2double(tline_3(c(2)+4:c(3)+3));
    a14 = str2double(tline_3(c(3)+4:c(4)+3));

    % Code to Calculate Specific Heat (CP), Enthalapy (H) and Entropy (S)
    CP = specific_heat(a1,a2,a3,a4,a5,a8,a9,a10,a11,a12,T,R,global_mid_temp);
    H = enthalpy(a1,a2,a3,a4,a5,a6,a8,a9,a10,a11,a12,a13,T,R,global_mid_temp);
    S = entropy(a1,a2,a3,a4,a5,a7,a8,a9,a10,a11,a12,a14,T,R,global_mid_temp);

    % Code to Calculate molecular weight of species
    molecular_weight = weight(name_of_species);
    fprintf('Moleuclar Weight of %s = %fn', name_of_species, molecular_weight);

% Code to plot Specific Heat (CP), Enthalapy (H) and Entropy (S)
cd('D:My DocumentsDesktopMatlabproject_one')
% creating the folder
mkdir(name_of_species)
cd(name_of_species)

% Specific Heat (CP) versus Temeperature(T) plot
figure(1)
plot (T,CP,'linewidth',2,'color','r')
xlabel('Temperature (K)')
ylabel('Specific Heat (KJ)')
title (sprintf('Specific Heat (CP) versus Temeperature (T) plot of %s',name_of_species))
grid on
saveas(figure(1), 'Specific_Heat.jpg')

% Enthalpy (H) versus Temeperature(T) plot
figure(2)
plot (T,H,'linewidth',2,'color','y')
xlabel('Temperature (K)')
ylabel('Enthalpy (KJ/mol-K)')
title (sprintf('Enthalpy (H) versus Temeperature (T) plot of %s',name_of_species))
grid on
saveas(figure(2), 'Enthalpy.jpg')

% Entropy (S) versus Temeperature (T) plot
figure(3)
plot (T,S,'linewidth',2,'color','g')
xlabel('Temperature (K)')
ylabel('Entropy(KJ/mol-K)')
title (sprintf('Entropy (S) versus Temeperature (T) plot of %s',name_of_species))
grid on
saveas(figure(3), 'Entropy.jpg')

cd('D:My DocumentsDesktopMatlabproject_one')

end
Functions:
% The following code is written for Specific Heat (CP) function

function [CP] = specific_heat(a1,a2,a3,a4,a5,a8,a9,a10,a11,a12,T,R,global_mid_temp)

if T >= global_mid_temp
    CP = R.*(a1+ (a2.*T)+ (a3.*((T).^2)) + (a4.*((T).^3)) + (a5.*((T).^4)));

else
    CP = R.*(a8+ (a9.*T)+ (a10.*((T).^2)) + (a11.*((T).^3)) + (a12.*((T).^4)));

end
% The following code is written for Enthalpy (H) function

function [H] = enthalpy(a1,a2,a3,a4,a5,a6,a8,a9,a10,a11,a12,a13,T,R,global_mid_temp)

if T>= global_mid_temp
    H = R.*((a1)+ ((a2.*T)./2)+ ((a3.*T.^2)./3) + ((a4.*T.^3)./4) + ((a5.*T.^4)./5)+ a6./T);
else
    H = R.*((a8)+ ((a9.*T)./2)+ ((a10.*T.^2)./3) + ((a11.*T.^3)./4) + ((a12.*T.^4)./5)+ a13./T);
end
% The following code is written for Entropy (S) function

function [S] = entropy(a1,a2,a3,a4,a5,a7,a8,a9,a10,a11,a12,a14,T,R,global_mid_temp)

if T>= global_mid_temp
    S = R.*((a1.*log(T))+ (a2.*T)+ ((a3.*T.^2)./2) + ((a4.*T.^3)./3) + ((a5.*T.^4)./4)+ a7);
else
    S = R.*((a8.*log(T))+ (a9.*T)+ ((a10.*T.^2)./2) + ((a11.*T.^3)./3) + ((a12.*T.^4)./4)+ a14);
end
% The following code is written to calcualte molecular weight of species

function [molecular_weight] = weight(name_of_species)

elements = ['H','C', 'O', 'N', 'A', 'S'];
atomic_weight= [1,12, 16, 14, 40,32];

name_of_species = upper(name_of_species);

molecular_weight = 0;

for i = 1:length(name_of_species)
    for j= 1:length(elements)

        if strcmp(name_of_species(i),elements(j))
            molecular_weight = molecular_weight + atomic_weight(j);
            k=j;

        else
            n = str2double(name_of_species(i));
            if n>1
                molecular_weight = molecular_weight + atomic_weight (k)*(n-1);
                break
            end
        end
    end
end