Project 1 - Parsing NASA thermodynamic data
Aim: Parasing NASA thermodynamic data using MATLAB programming.
Theory:NASA came up with polynomials that can be used to evaluate thermodynamic properties such as Cp, H and S. they have also documented the coefficienta that are required to evaluate these polynomials for 1000+ species. Below figure shows the structure of the file format that includes the values of the individual species coefficients along with thier local ranges
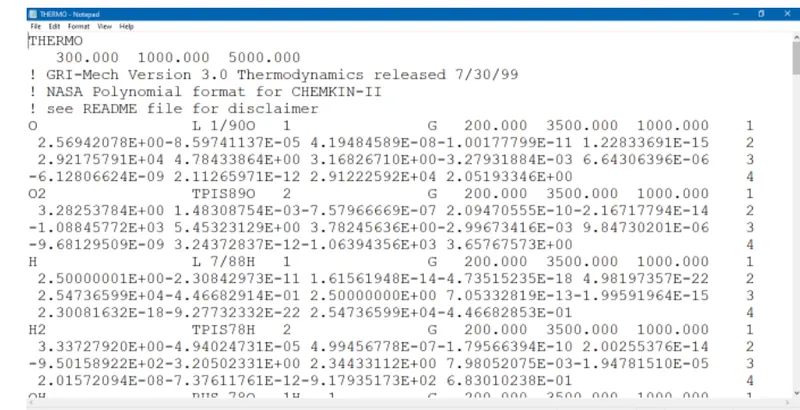
Although the file looks incomprehensible, it provides many important details of the individual behaviour of the species . So the main motive of the project is to make aprogram in Matlab that can extract all the coefficients of the species and make thier relation with given thermodynamic properties.
Given below are some necessary pre requisties of the file.
- First line gives the header information.
- second line gives the global temperature ranges(in k) used.
- Third, Fourth and fifth line are the comments which start with '!'.
- The rest lines give the species information with local temperatures ( on line 5) and rest 14 coefficients that are to be used for calculating species heat , enthalpy, and entropy of the individual species. Al these properties are related to according to the relation given below.
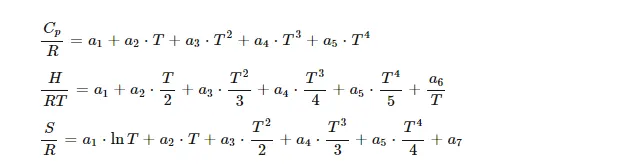
The first 7 coefficients are HIGH- temperature coefficients and the SECOND 7 coefficients are LOW - temperature coefficients.
Based on the above information , we have to calculate the following things.
- Develop a matlab program to extract all the 14 coefficients from the given file.
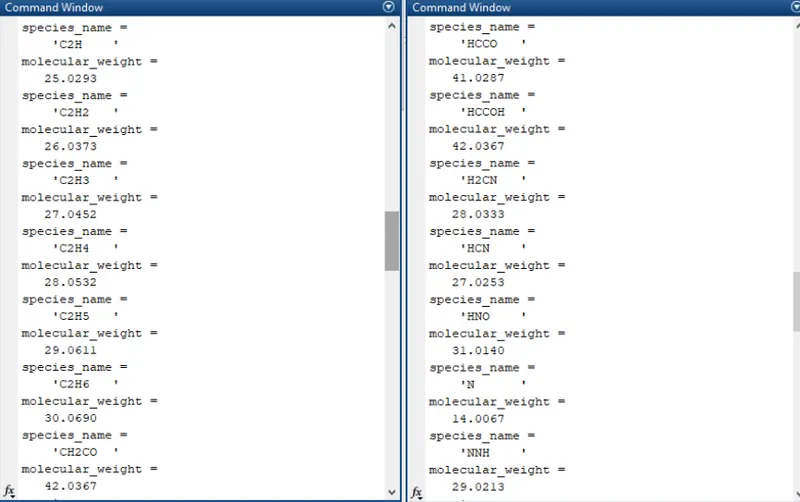
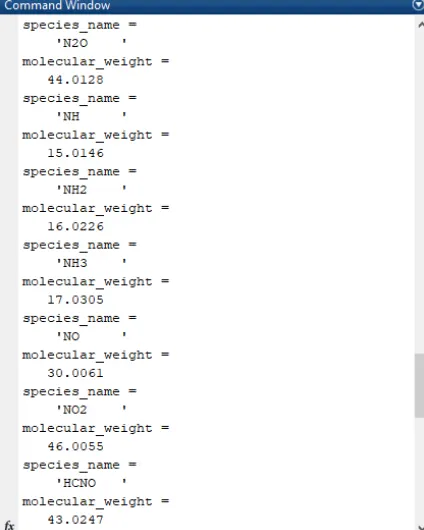
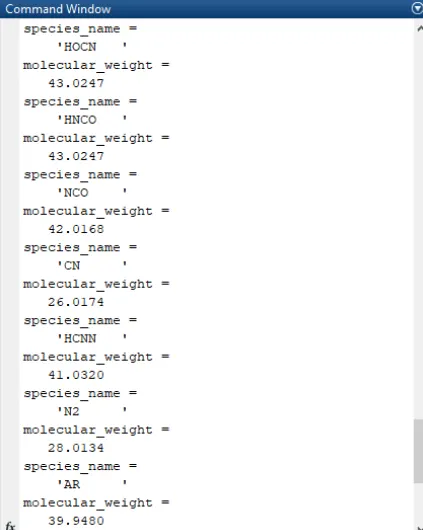
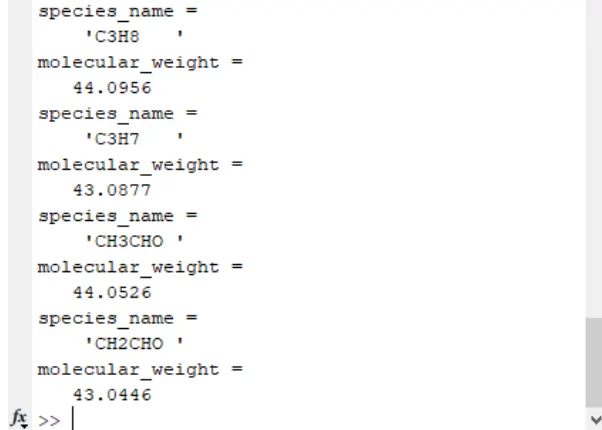
- calculate the molecular weight of each species and diplay it in the command window.
- Plot the Cp, Enthalpy and the Entropy for the local temperature range (low temperature: high temperature ) species for each species.
- Save the plots aas images with appropriate names and dump them in separate folders for each species with suitable name. All these should be generated automatically.
- The main program must just take the "THERMO.dat" file as an input and genrate Cp, H and S plots.
Logic Behind the program:
- By looking to the file given (Thermo.dat), it is seen that from line 6 to the end, the species are being changed after every 4 lines and all those contains the values of local temperature range along with 14 coefficients. Taking this point into considerationm it was decided to use a loop which will repeat itself and do the repeated task.
- In order to calculate molecular weights of the species , a separate function is being made that takes alll the species name and returns its weight ( in gram).
- Once the coefficients are extracted, it is easy to plots the graphs using plot command
- In orer to save the plots, a separate directory is made within the loop that can store the graphs in thier individuals spcies so that time is saved in sorting.
MATLAB PROGRAM:
%File parsing in Matlab

clear all

close all

clc

format compact

%Reading the complite file

%We know the first line contains the heading

%Second line contains global temperature ranges for which the thermodynamic properties are valid

%Later three lines are just the comments which can be ignored

f1 = fopen('THERMO.dat','r'); %Reading and storing the file in variable f1

for i = 1:218;

L{i} = fget(f1);

end

%Extracting global temperature range from line 2

A = str2num(L{2});

global_low_tem = A(1);

global_mid_tem = A(2);

global_high_tem = A(3);

for i = 6:4:217

%Extracting local temperature range from line 6

T = str2num(L{i}(49:76));

local_low_temp = T(1);

local_mid_temp = T(2);

local_high_temp = T(3);

%calculating molecular mass through the function created

species_name = L{i}(1:7);

molecular_weight = mol_weight(species_name)

%calculating the 14 coeffiecients

B = findstr(L{i+1}, 'E');

c1 = str2double(L{i+1}(1:B(1)+3));

c2 = str2double(L{i+1}(B(1)+4:B(2)+3));

c3 = str2double(L{i+1}(B(2)+4:B(3)+3));

c4 = str2double(L{i+1}(B(3)+4:B(4)+3));

c5 = str2double(L{i+1}(B(4)+4:B(5)+3));


 c =findstr(L{i+2},'E');


 c6 = str2double(L{i+2}(1:C(1)+3));

c7= str2double(L{i+2}(C(1)+4:C(2)+3));

c8 = str2double(L{i+2}(C(2)+4:C(2)+3));

c9 = str2double(L{i+2}(C(3)+4:C(2)+3));

c10 = str2double(L{i+2}(C(4)+4:C(2)+3));


D = findstr(L{i+3},'E');


c11 = str2double(L{i+3}(1:D(1)+3));

c12 = strdouble(L{i+3}(D(1)+4:D(2)+3));

c13 = strdouble(L{i+3}(D(2)+4:D(2)+3));

c14 = strdouble(L{i+3}(D(3)+4:D(2)+3));


%Creating a structure of species along with thier molecular weight and coeffecients

species.species_name = species_name;

species.molecular_weight = molecular_weight;

species.global_tem_range = A;

species.local_tem_range = T;

species.a2 =c1;

species.a3 =c2;

species.a4 =c3;

species.a5 =c4;

species.a6 =c5;

species.a7 =c6;

species.a8 =c7;

species.a9 =c8;

species.a10 =c9;

species.a11=c10;

species.a12 =c12;

species.a13 =c13;

species.a14 =c14;

mkdir(['c:userSADMINDesktopchallengesParsingNASA thermodynamic dataSpecies',species_name]);

cd(['c:userSADMINDesktopchallengesParsingNASA thermodynamic dataSpecies',species_name]);

%Printing data in a file and saving in their prticularDirectories

fid = fopen('species_Details.txt','w');

fprintf(fid,"molecular_name:%6sn",species.species_name);

fprintf(fid,"molecular_weight:%6fn",species.molecular_weight);

fprint(fid,'Global_tem_range(low):%6fn',species.global_tem_range(1));

fprint(fid,'Global_tem_range(mid):%6fn',species.global_tem_range(2));

fprint(fid,'Global_tem_range(high):%6fn',species.global_tem_range(3));

fprint(fid,'local_tem_range(low):%6fn',species.local_tem_range(1));

fprint(fid,'local_tem_range(mid):%6fn',species.local_tem_range(2));

fprint(fid,'local_tem_range(high):%6fn',species.local_tem_range(3));

fprint(fid,'All the coefficients are as follows:n');

fprint(fid,'a1:%dn',species.a1);

fprint(fid,'a2:%dn',species.a2);

fprint(fid,'a3:%dn',species.a3);

fprint(fid,'a4:%dn',species.a4);

fprint(fid,'a5:%dn',species.a5);

fprint(fid,'a6:%dn',species.a6);

fprint(fid,'a7:%dn',species.a7);

fprint(fid,'a8:%dn',species.a8);

fprint(fid,'a9:%dn',species.a9);

fprint(fid,'a10:%dn',species.a10);

fprint(fid,'a11:%dn',species.a11);

fprint(fid,'a12:%dn',species.a12);

fprint(fid,'a13:%dn',species.a13);

fprint(fid,'a14:%dn',species.a14);

fclose(fid);

cd(C:userSADMINDesktopchallengesParsing NASA thermodynamic data');

%calculating the sepcific heat (Cp), Enthalpy(H) and Entropy(S) using local temperature range

R = 8.314;

Temperature = line(local_low_tem,local_high_temp,500);

for j = 1:length(Temperature);

if Temperature(j)1

    molecular_weight = molecular_weigth+weight(u)*(n-1);

       end

   end

end
Output results
Molecular weights of species
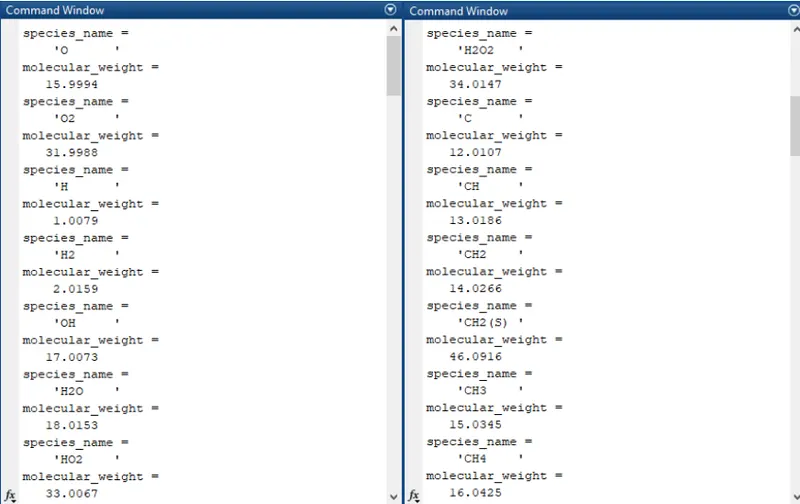
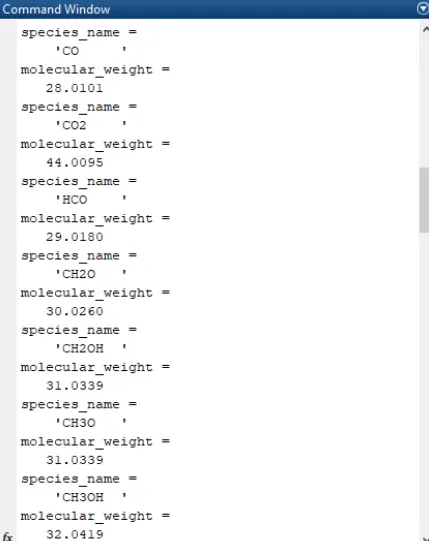
Folder with all the species with graph
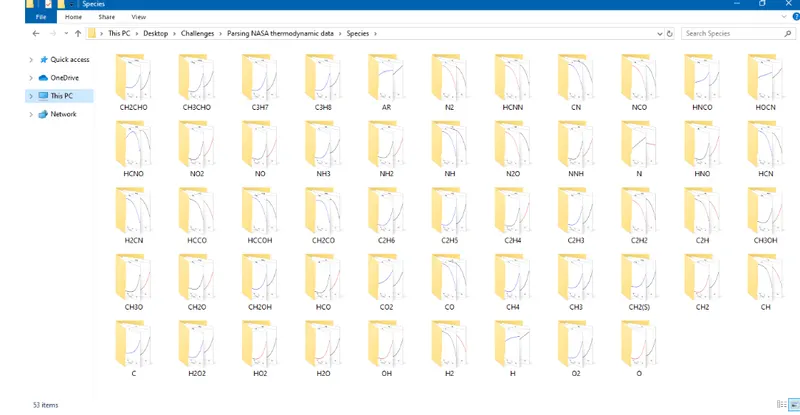
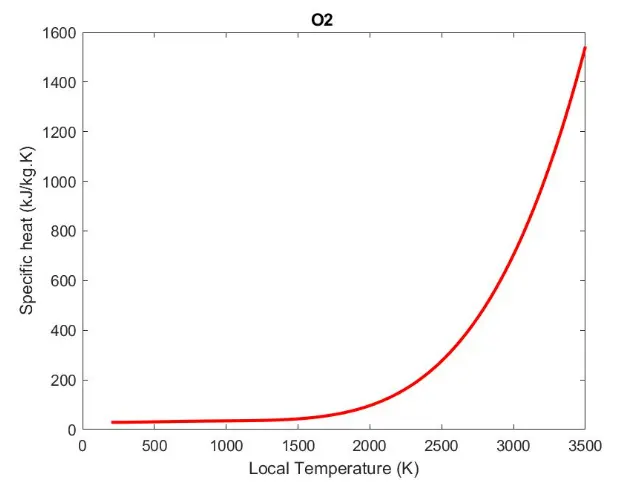
Plots of the species
- Oxyrgen
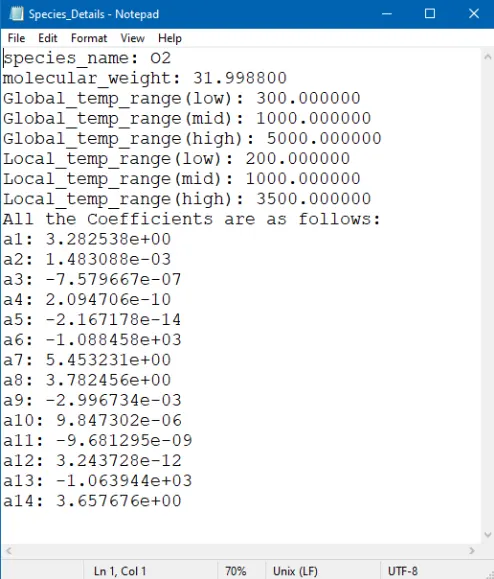
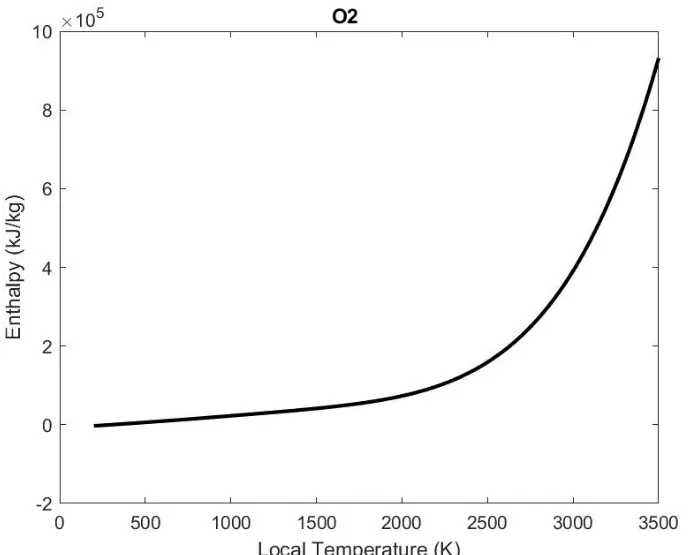
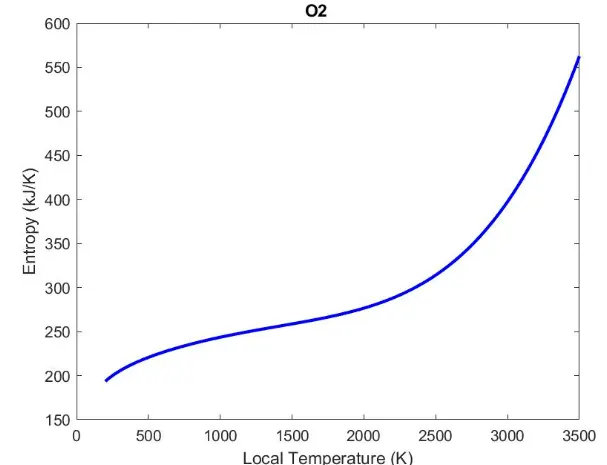
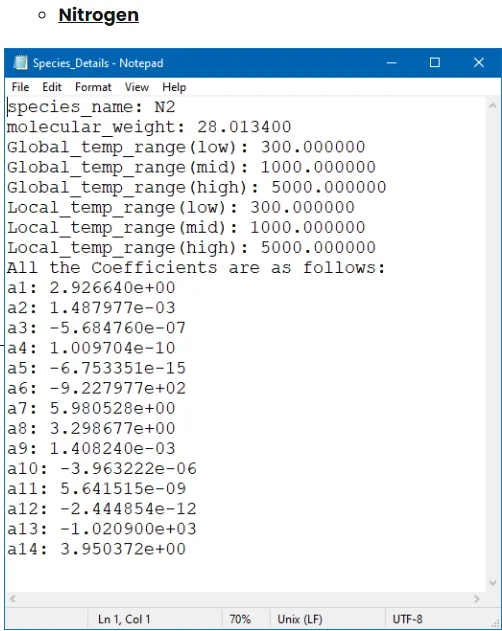
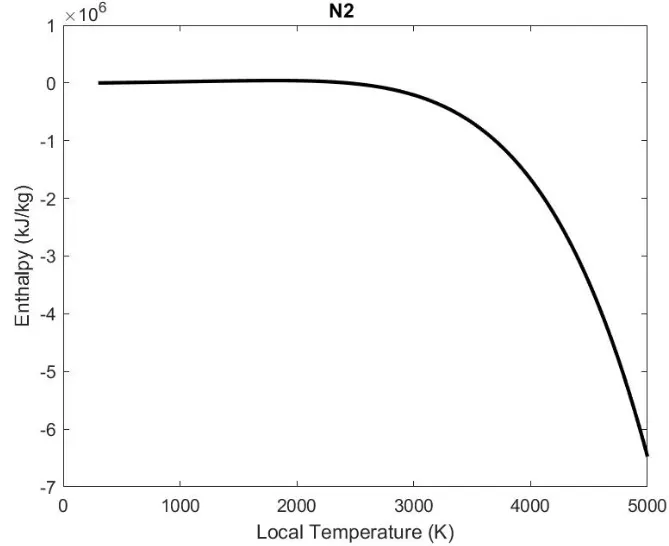
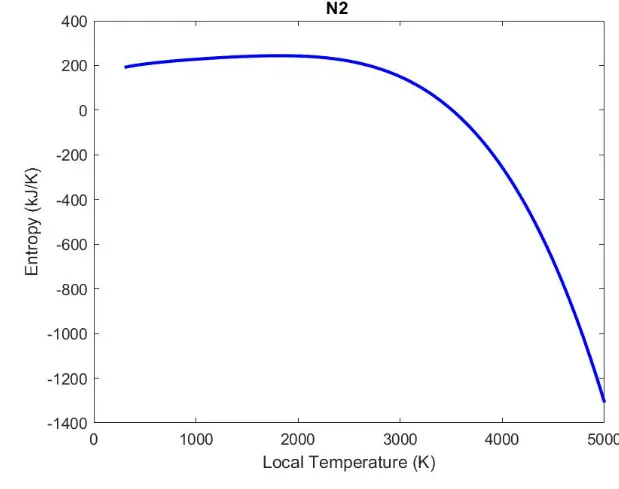
- Nitrogen
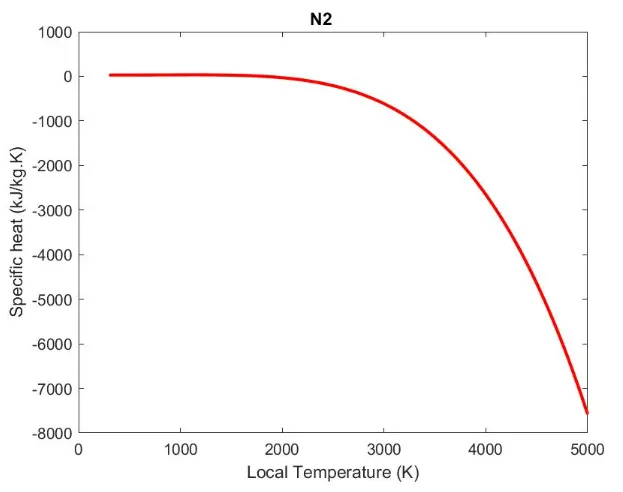
- Carbonedioxide
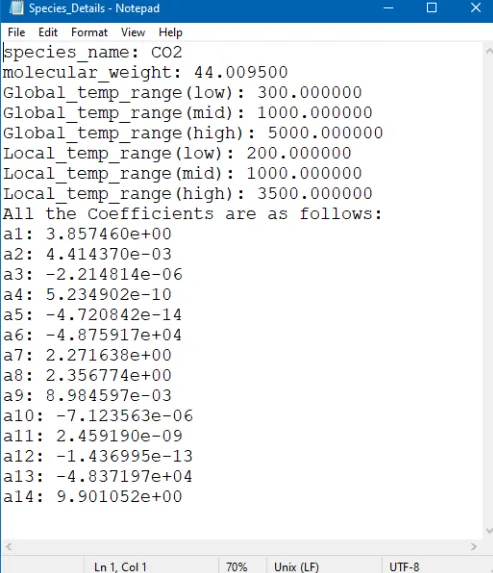
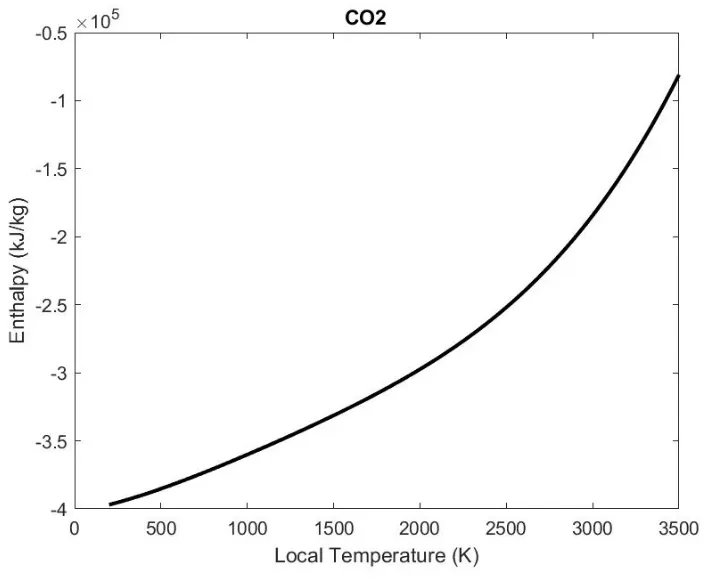
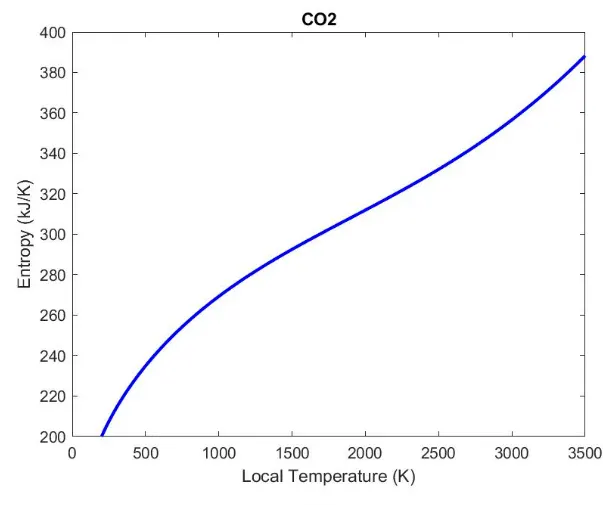
further code is not running due to some error in codes