Project 1 - Parsing NASA thermodynamic data
AIM :- To develop a code to parse the NASA thermodynamic data file to calculate the molecular weight of the species and to plot the cp, enthalpy, entropy for the local temperature range for O2, N2, Co2.
Definitions
File parsing: - Parsing a file means to split or other input into pieces of data that can easily store or manipulated so we are splitting a string into parts then recognizing the parts to convert it into something simpler than a string.
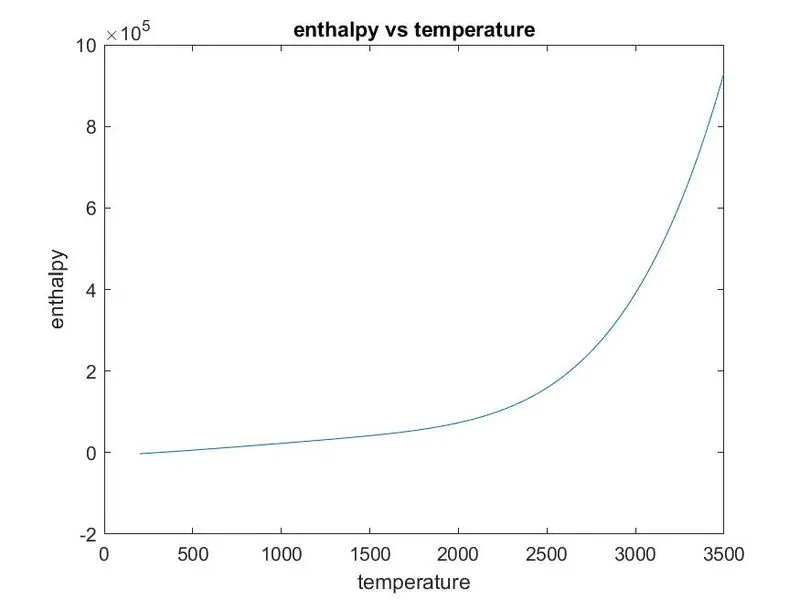
Enthalpy: - A thermodynamic quantity equivalent to the total heat content of a system it is equal to the internal energy of the system plus the product of pressure and volume.
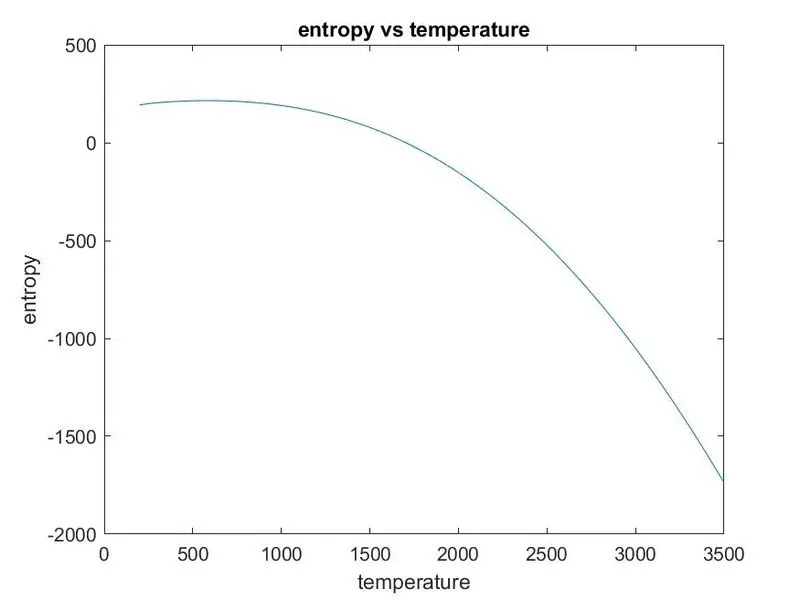
Entropy: - A thermodynamic quantity representing the unavailability of a system thermal energy for conversion into mechanical work, often interpreted as the degree of disorder of randomness in the system.
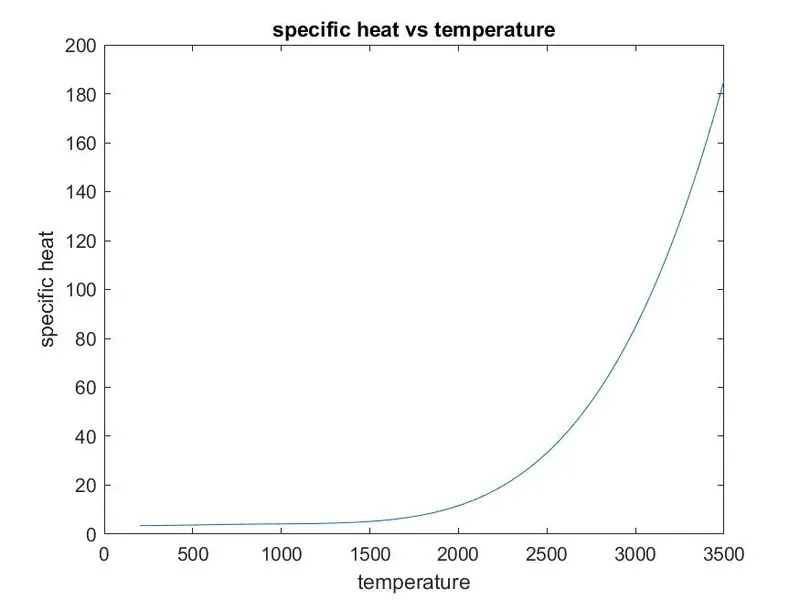
Specific Heat: - It is the amount of heat per unit mass required to raise the temperature by one degree Celsius.
Molecular Weight: - Molecular weight is the weight of a given molecule.
Equations:-
Cp/R = a1 + a2 T + a3 T^2 + a4 T^3 + a5 T^4
H/RT = a1 + a2 T/2 + a3 T^2 /3 + a4 T^3/4 + a5 T^4/5 + a6/T
S/R = a1 lnT + a2 T + a3 T^2/2 + a4 T^3/3 + a5 T^4/4 + a7
Where
Cp = Specific Heat
R = Gas Constant
H = enthalpy
S = Entropy
T = Temperature
FUNCTION CODE
Specific Heat Function Code
function [C_p] = specific_heat_calc(a1,a2,a3,a4,a5,a6,a7,a8,a9,a10,a11,a12,a13,a14,local_low_temp,local_mid_temp,local_high_temp,T)
if(T>local_mid_temp)
    C_p = (a1+(a2*T)+(a3*(T.^2))+(a4*(T.^3))+(a5*(T.^4)));
else
    C_p = (a8+(a9*T)+(a10*(T.^2))+(a11*(T.^3))+(a12*(T.^4)));
end
end
Enthalpy Function
function [h] = enthalpy_cal(a1,a2,a3,a4,a5,a6,a7,a8,a9,a10,a11,a12,a13,a14,local_low_temp,local_mid_temp,local_high_temp,T)
if (T>local_mid_temp)
    h = (a1*T+(a2*(T.*2)/2)+(a3*(T.^3)/3)+(a4*(T.^4)/4)+(a5*(T.^5)/5)+a6);
else
    h = (a8*T+(a9*(T.^2)/2)+(a10*(T.^3)/3)+(a11*(T.^4)/4)+(a12*(T.^5)/5)+a13);
end
end
Entropy Function
function [s] = entropy_calc(a1,a2,a3,a4,a5,a6,a7,a8,a9,a10,a11,a12,a13,a14,local_low_temp,local_mid_temp,local_high_temp,T)
if (T>local_mid_temp)
    s = (a1*log(T)+(a2*T)+(a3*(T.^2)/2)+(a4*(T.^3))+(a5*(T.^4)/4)+a7);
else
    s = (a8*log(T)+(a9*T)+(a10*(T.^2)/2)+(a11*(T.^3))+(a12*(T.^4)/4)+a14);
end
end
Molecular Weight
function [M] = molecular_weight(species_name)

Atomic_mass = [15.999,1.008,12.011,14.007,39.948];
Elements = ['O','H','C','N','A'];

Mol_wt = 0;
for i = 1:length(species_name)
    for j = 1:length(Elements)
        if strcmpi(species_name(i),Elements(j))
            Mol_wt = Mol_wt+Atomic_mass(j);
            z = j;
        end
    end
    var = str2double(species_name(i));
    if (var>1)
        Mol_wt = Mol_wt+(Atomic_mass(z)*(var-1));
    end
end
M = Mol_wt;
end
Main Code :-
% Nasa Thermodynamic File parsing
close all
clear all
clc

% gas constant
R = 8.314;
% reading first two lines
f1 = fopen('THERMO.dat','r')
tline1 = fgetl(f1)
tline2 = fgetl(f1)
temp = strsplit(tline2,' ')
global_low_temp = str2num(temp{2})
global_mid_temp = str2num(temp{3})
global_high_temp = str2num(temp{4})

%skipping next three line
for i = 1:3
    skippedlines = fgetl(f1);
end

for i = 1:53
    tline3 = fgetl(f1)
    S = strsplit(tline3,' ');
    species_name = S{1};
    A = strfind(tline3,'G');
    temp_values = tline3(A+4:length(tline3));
    B = strsplit(temp_values,' ');
    local_low_temp = str2double(B{1});
    local_mid_temp = str2double(B{3});
    local_high_temp = str2double(B{2});

    tline4 = fgetl(f1)
    f = strfind(tline4,'E');
    a1 = str2double(tline4(1:(f(1)+3)));
    a2 = str2double(tline4(f(1)+4:(f(2)+3)));
    a3 = str2double(tline4(f(2)+4:(f(3)+3)));
    a4 = str2double(tline4(f(3)+4:(f(4)+3)));
    a5 = str2double(tline4(f(4)+4:(f(5)+3)));

    tline5 = fgetl(f1);
    a6 = str2double(tline5(1:(f(1)+3)));
    a7 = str2double(tline5(f(1)+4:(f(2)+3)));
    a8 = str2double(tline5(f(2)+4:(f(3)+3)));
    a9 = str2double(tline5(f(3)+4:(f(4)+3)));
    a10 = str2double(tline5(f(4)+4:(f(5)+3)));

    tline6 = fgetl(f1);
    a11 = str2double(tline6(1:(f(1)+3)));
    a12 = str2double(tline6(f(1)+4:(f(2)+3)));
    a13 = str2double(tline6(f(2)+4:(f(3)+3)));
    a14 = str2double(tline6(f(3)+4:(f(4)+3)));

    T = linspace(local_low_temp,local_high_temp,100);

    [C_p] = R*specific_heat_calc(a1,a2,a3,a4,a5,a6,a7,a8,a9,a10,a11,a12,a13,a14,local_low_temp,local_mid_temp,local_high_temp,T);

    s = R*entropy_calc(a1,a2,a3,a4,a5,a6,a7,a8,a9,a10,a11,a12,a13,a14,local_low_temp,local_mid_temp,local_high_temp,T);

    h = R*enthalpy_cal(a1,a2,a3,a4,a5,a6,a7,a8,a9,a10,a11,a12,a13,a14,local_low_temp,local_mid_temp,local_high_temp,T);

    req_species = ["O2","N2","CO2"];

    if (species_name==req_species(1))||(species_name==req_species(2))||(species_name==req_species(3))
        mkdir(species_name);
        cd(species_name)

        figure(1)
        plot(T,C_p)
        title('specific heat vs temperature')
        xlabel('temperature')
        ylabel('specific heat')

        saveas( figure(1),'specific_heat','jpg')


        figure(2)
        plot(T,h)
        title('enthalpy vs temperature')
        xlabel('temperature')
        ylabel('enthalpy')

        saveas( figure(2),'enthalpy','jpg')

        figure(3)
        plot(T,s)
        title('entropy vs temperature')
        xlabel('temperature')
        ylabel('entropy')

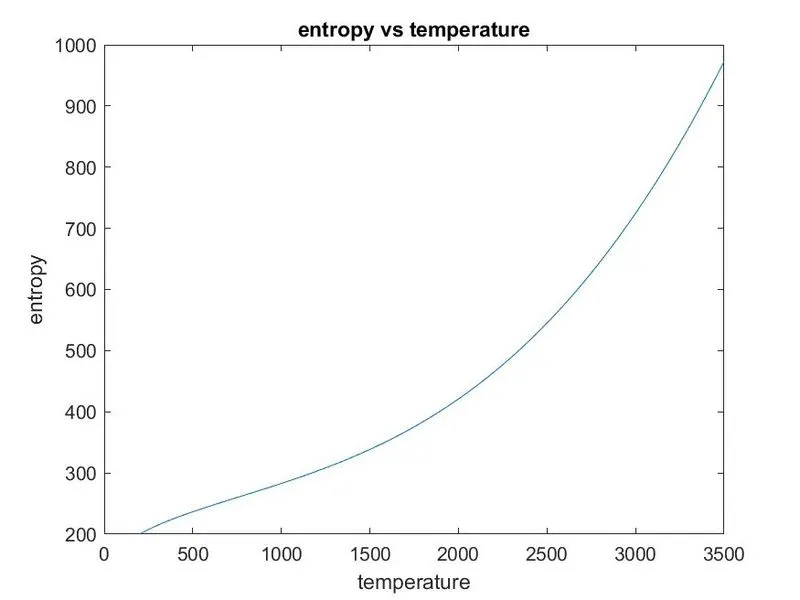
        saveas( figure(3),'entropy','jpg')

        cd ..
    end

    molecular_wt = molecular_weight(species_name);
    K = sprintf('%s Mol_wt = %f',species_name,molecular_wt);
    disp(K)
end
Code Explation:-
This Code is make for the nasa file parsing. In this code first open the "THERMO.dat" file using the fopen command in MATLAB. After that this data should be ready propely. I have use the fgetl command for the read data file.
Using the findstr and str2double and splitstr command the all program is make and the find the value of the species and graph is plot easily. For the species calculation I have created the function code for the every species and Molecular Weight also. So at the end molecular weight is also calculated.
Using the saveas command the all graph is save.
Result:-
Element O2 Graph Plot
Element N2 Graph Plot
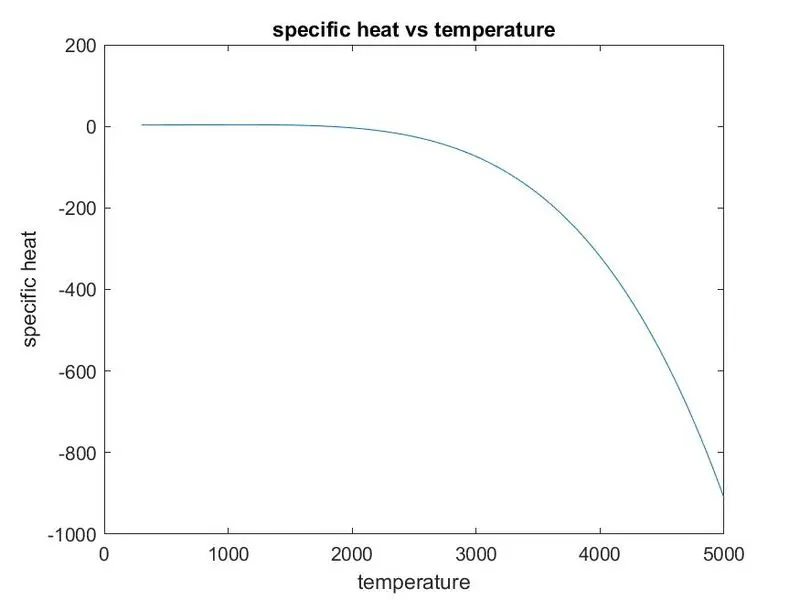
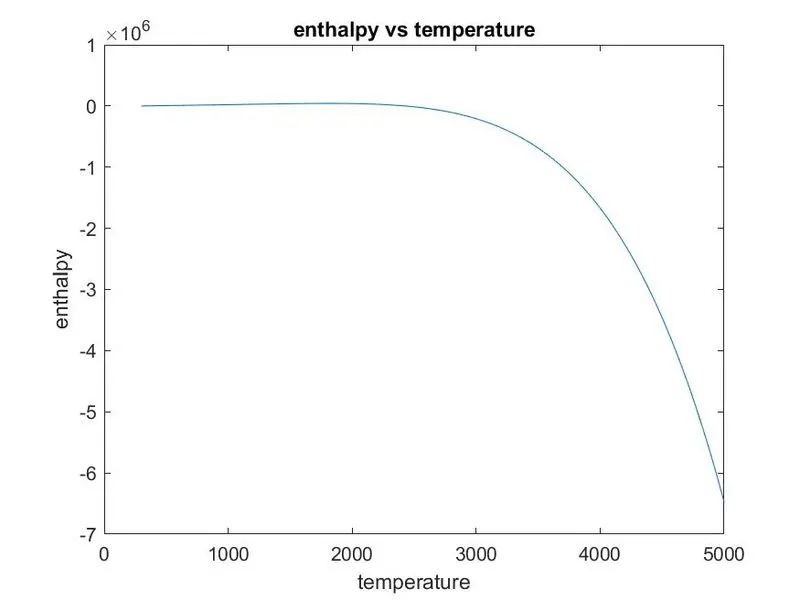
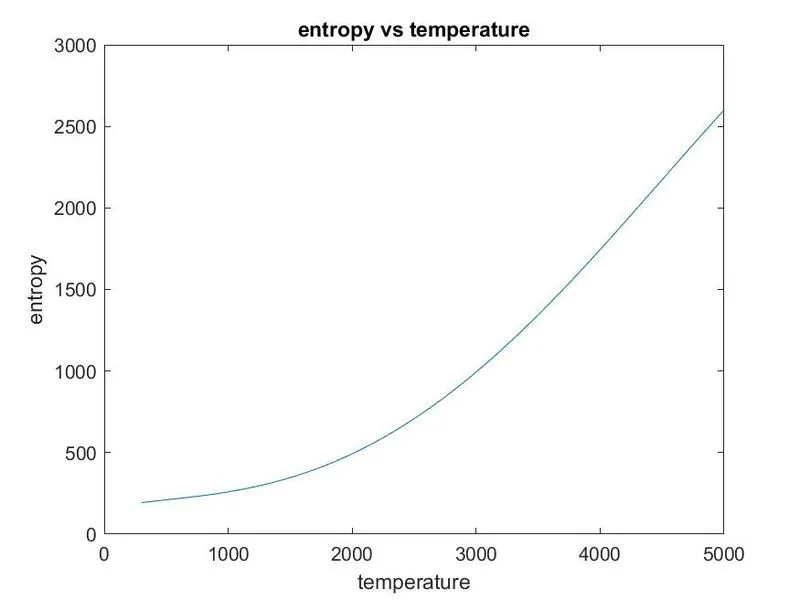
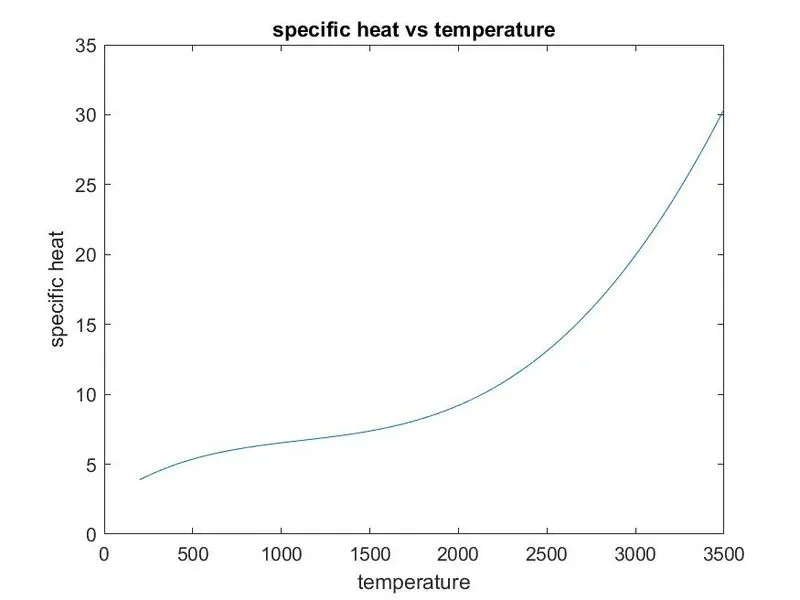
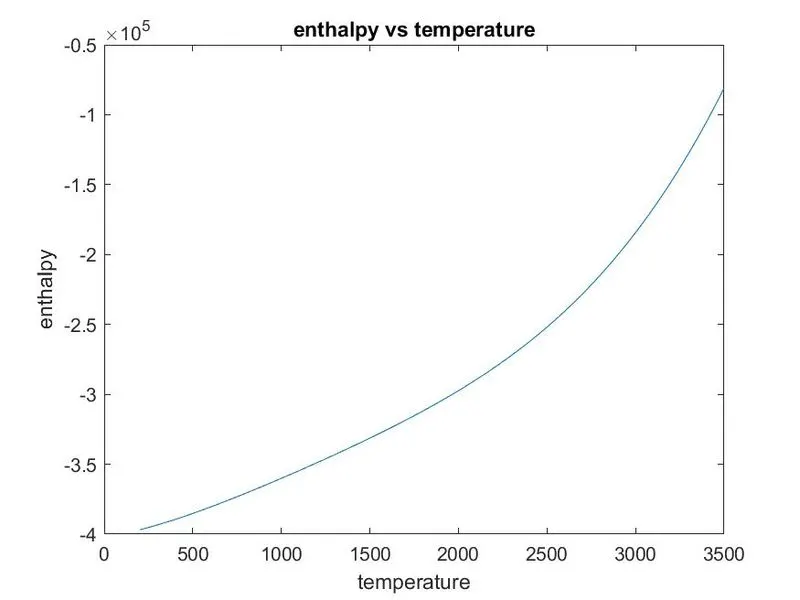
Element CO2 Graph Plot
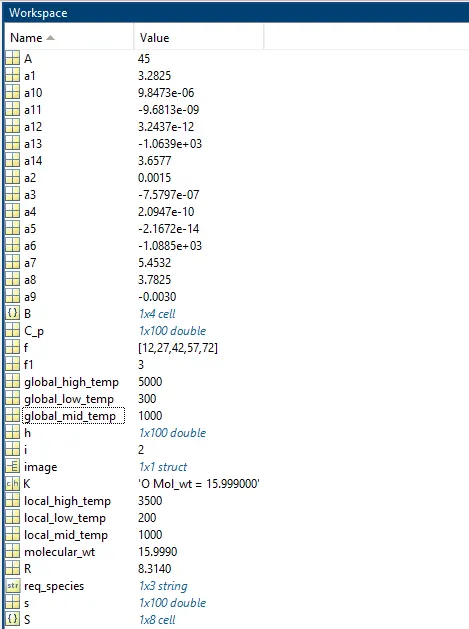
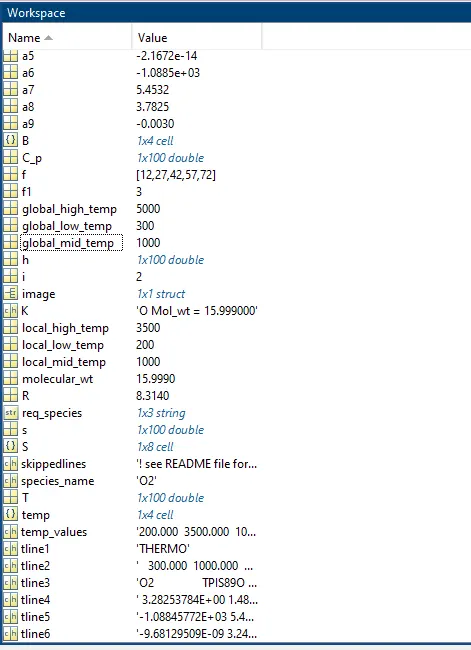
Work Space Pictures:-
Pictures of Species Folder:-

Conclusion:-
At the end the code all species graph is plot and the data is read. The all plot graph is also save in the folder using the program. Molecular weight is calculate easily using the program and function code.
All Progeam is run sucesfully and data is read.