Project 1 - Parsing NASA thermodynamic data
Objective
The objective of this challenge is to parse the data from a file 'THERMO.dat' and calculate specific heat, enthalpy, entropy and molecular weight.
For this project I've written two user-defined functions. One of the function 'thermo_properties' calculates the specific heat, enthalpy and entropy of the species. The other function 'molecular_weight' calculates molecular weight of the species. These functions will be called inside the main script. After that plotting is done inside the main script using the returned values of specific heat, enthalpy and entropy. The molecular weight will be printed as output in the command window.
Main Script
clear
close all
clc

thermo_data = fopen('THERMO.dat','r');      % opening file for reading and assigning the file to variable thermo_data
file_name = fgetl(thermo_data);             % reading line from the file and assigning it to the variable
temp_line = fgetl(thermo_data);             % reading line from the file and assigning it to the variable
temp = strsplit(temp_line,' ');             % splitting the string vector 'temp_line' into cells. 'Space' is the delimiter

global_low_temp = str2double(temp{2});      % converting the string to double values and assigning to the variables
global_medium_temp = str2double(temp{3});   % converting the string to double values and assigning to the variables
global_high_temp = str2double(temp{4});     % converting the string to double values and assigning to the variables

for i = 1:3                                                % initializing the for loop variable i to read next three lines
    eval(sprintf('Comment%d = fgetl(thermo_data);',i))     % using eval and sprintf to read the comments from the file and assigning the comments to variables
end                                                        % ending the for loop

for i = 1:53                                               % initializing the for loop variable i to read next 53 lines from the file.
     species_header = (strsplit(fgetl(thermo_data),' '));  % reading next line and splitting the string and then assigning cells to the variable
     species = species_header{1};                          % assgining the string from the first cell to the variable

     % converting the strings from the header line to double and assigning to the variable
     local_low_temp = str2double(species_header{end-3});
     local_mid_temp = str2double(species_header{end-1});
     local_high_temp = str2double(species_header{end-2});

     for j = 1:3                                            % initializing for loop variable j to read next three line
         eval(sprintf('line%d = fgetl(thermo_data);',j))    % using eval to execute string created using sprintf as code
         eval(sprintf('p%d = strfind(line%d,''E'');',j,j))  % using strfind function to get the location of character 'E' and assigning the indices to a variable
     end                                                    % end the loop


     % converting the coefficients from first three lines of the species to double and assigning to the variables.
     % a1 to a7 are high temperature coefficients and a8 to a14 are low temperature coefficients

     a1 = str2double(line1(1:p1(1)+3));
     a2 = str2double(line1(p1(1)+4:p1(2)+3));
     a3 = str2double(line1(p1(2)+4:p1(3)+3));
     a4 = str2double(line1(p1(3)+4:p1(4)+3));
     a5 = str2double(line1(p1(4)+4:p1(5)+3));
     a6 = str2double(line2(1:p2(1)+3));
     a7 = str2double(line2(p2(1)+4:p2(2)+3));
     a8 = str2double(line2(p2(2)+4:p2(3)+3));
     a9 = str2double(line2(p2(3)+4:p2(4)+3));
     a10 = str2double(line2(p2(4)+4:p2(5)+3));
     a11 = str2double(line3(1:p3(1)+3));
     a12 = str2double(line3(p3(1)+4:p3(2)+3));
     a13 = str2double(line3(p3(2)+4:p3(3)+3));
     a14 = str2double(line3(p3(3)+4:p3(4)+3));

     T = linspace(local_low_temp,local_high_temp,500);       % using linspace to create temperature array of 500 elements between local low temp and local high temp

     [cp,h,s] = thermo_properties(a1,a2,a3,a4,a5,a6,a7,a8,a9,a10,a11,a12,a13,a14,T,local_mid_temp);   % calling thermo_properties to calculate values specific heat, enthalpy and entropy

     mol_wt = molecular_weight(species);     % calling molecular_weight function to calculate molecular weight

     current_directory = pwd;           % assigning path to current directory to variable using pwd
     cd parsing_challenge               % changing current working directory to folder parsing_challenge
     mkdir(species)                     % creating new folder for species
     cd(species)                        % changing current working directory

     % plotting specific heat vs temperature graph
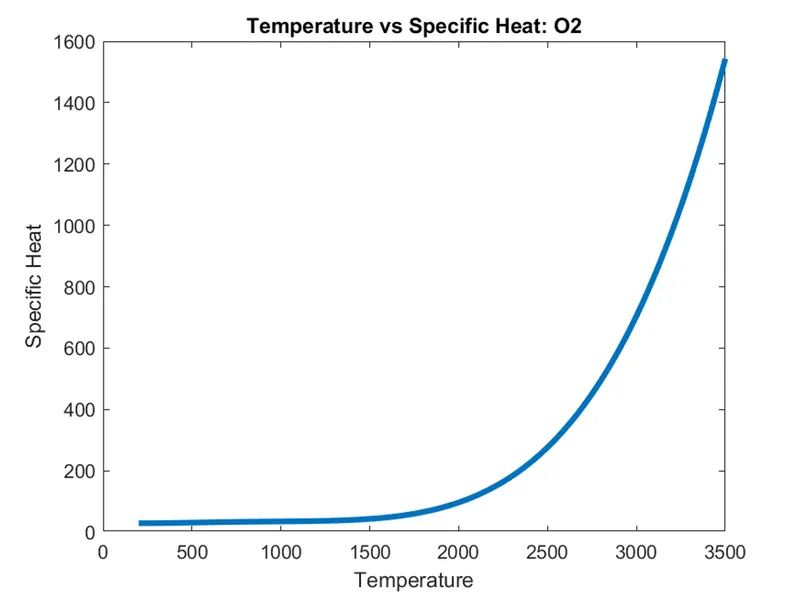
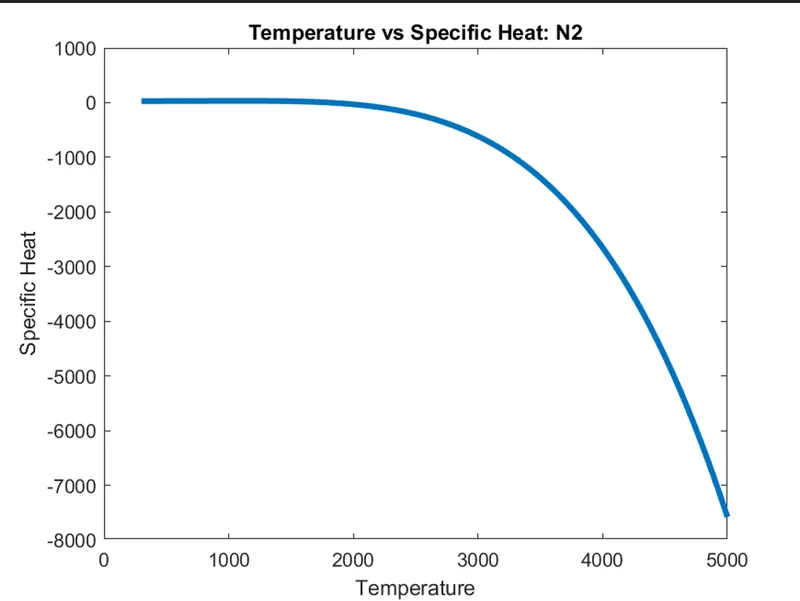
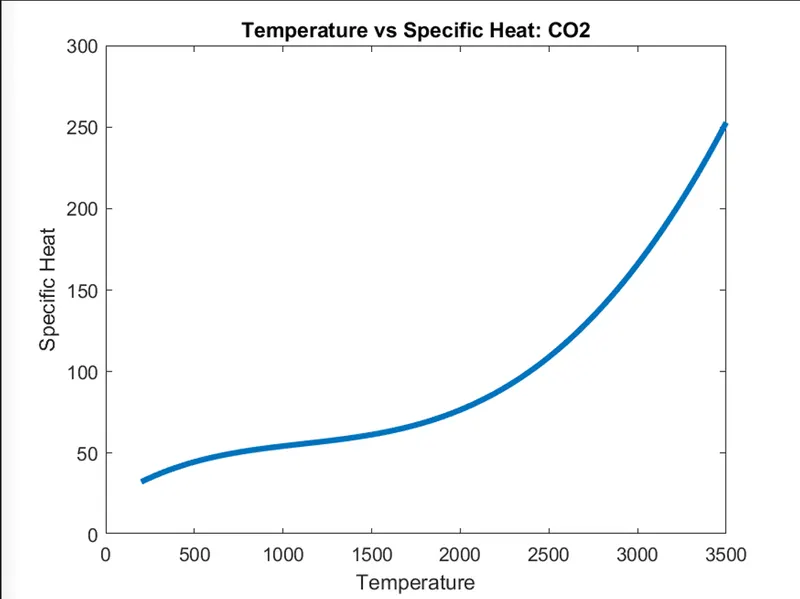
     figure(1)                                                    % first figure for the specific heat vs temperature graph
     plot(T,cp,'linewidth',3)                                     % plotting with default color and linewidth 3
     xlabel('Temperature')
     ylabel('Specific Heat')
     title(sprintf('Temperature vs Specific Heat: %s',species))   % using sprintf to create title for the first figure

     % plotting temperature vs enthalpy graph
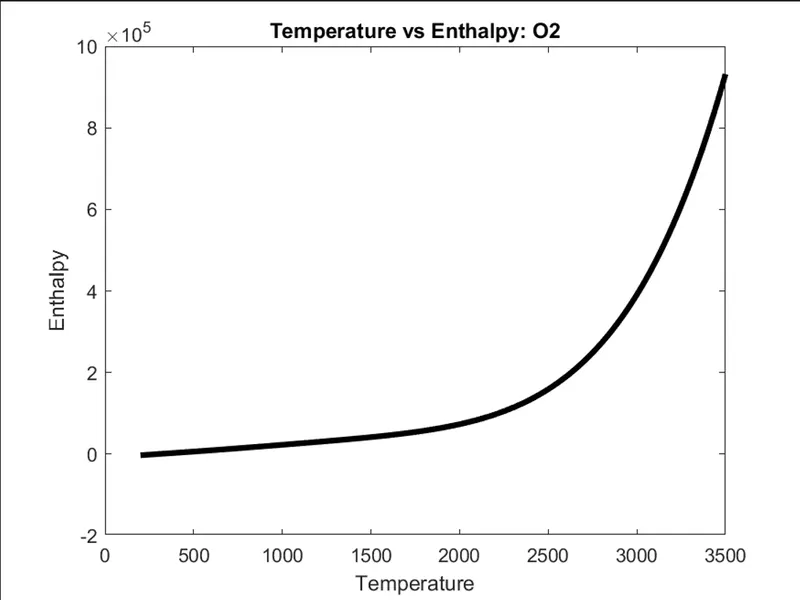
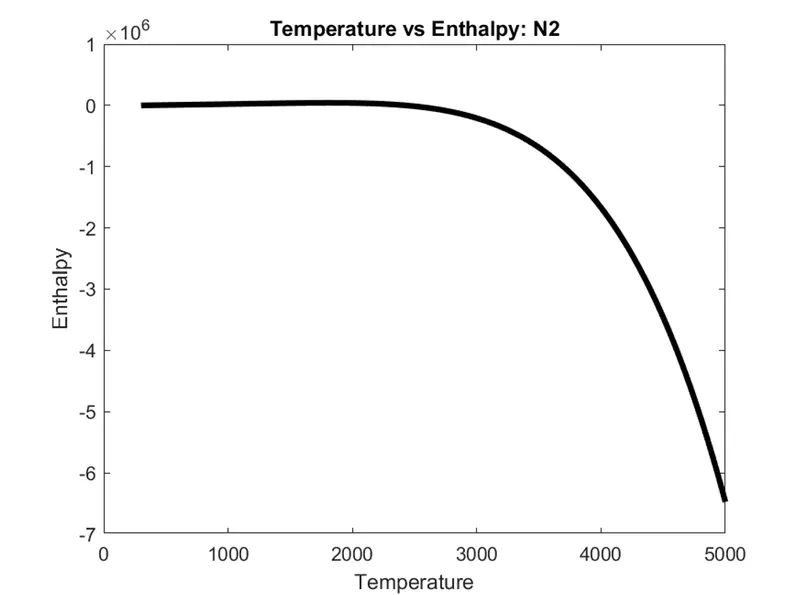
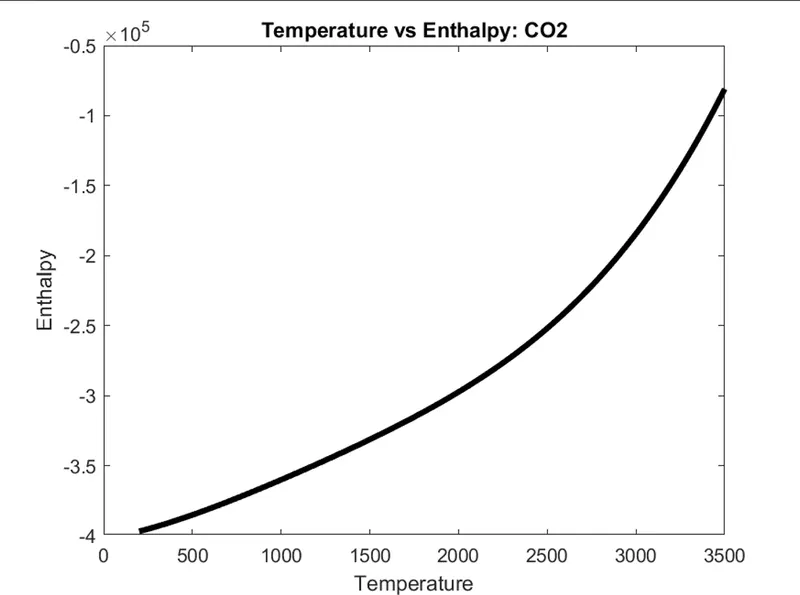
     figure(2)                                                    % second figure for the temperature vs enthalpy graph
     plot(T,h,'color','k','linewidth',3)                          % plotting with black color and linewidth 3
     xlabel('Temperature')
     ylabel('Enthalpy')
     title(sprintf('Temperature vs Enthalpy: %s',species))        % using sprintf to create title for the 2nd figure

     % plotting temperature vs entropy graph
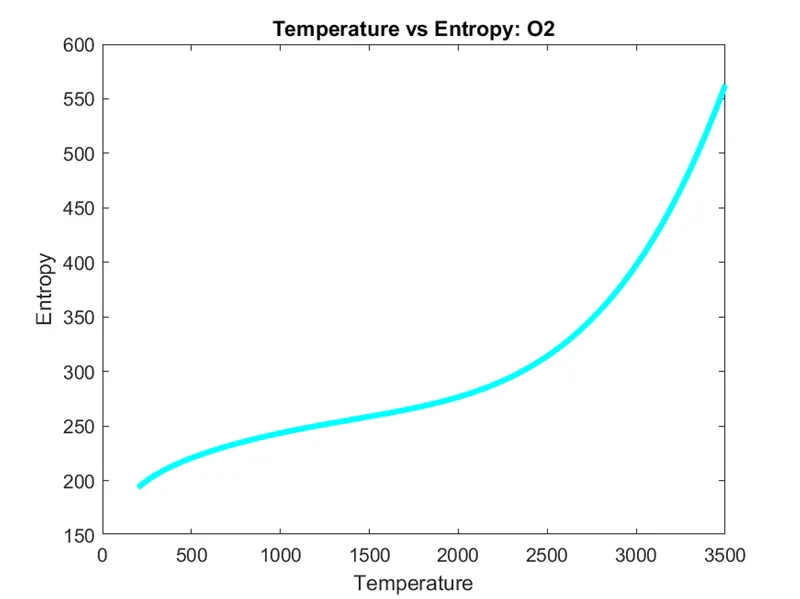
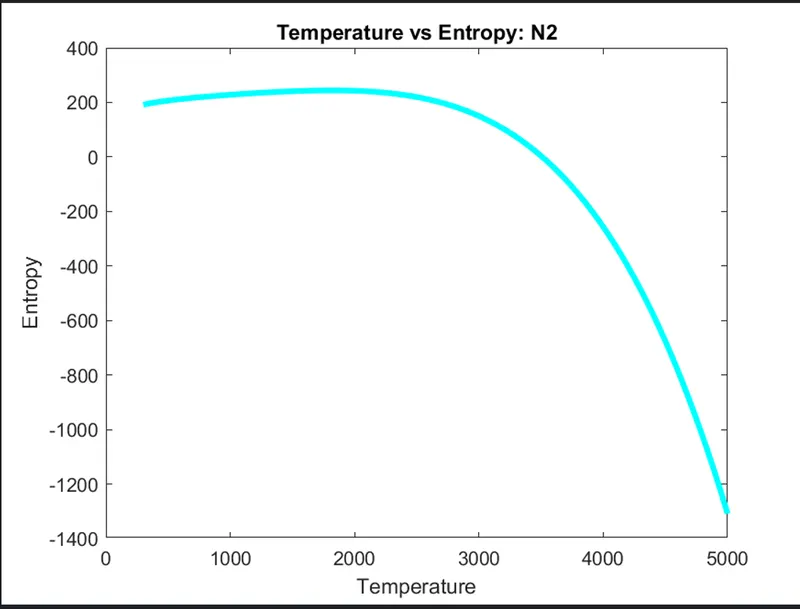
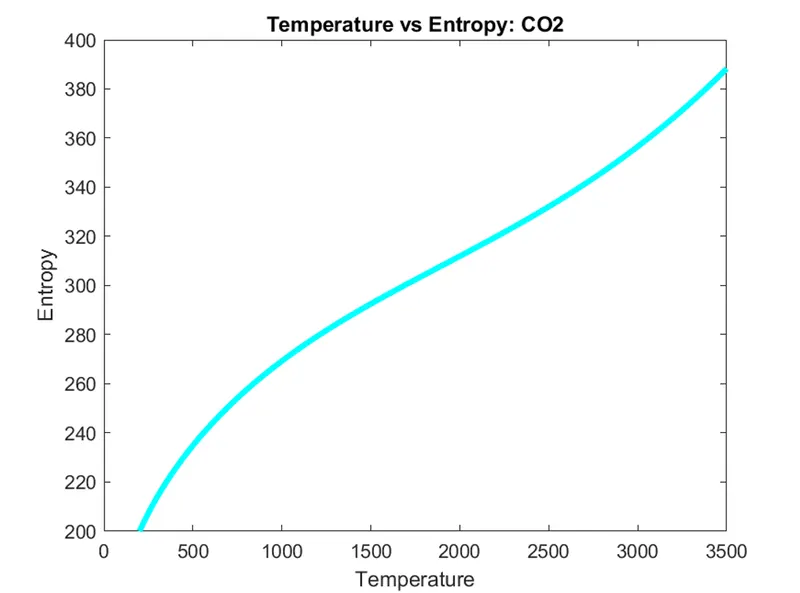
     figure(3)                                                    % third figure for temperature vs entropy graph
     plot(T,s,'color','c','linewidth',3)                          % plotting with cyan color and linewidth 3
     xlabel('Temperature')
     ylabel('Entropy')
     title(sprintf('Temperature vs Entropy: %s',species))         % using sprintf to create title for the 3rd figure

     saveas(1,'Specific_Heat.png')                                % saving the figure 1 as png file
     saveas(2,'Enthalpy.png')                                     % saving the figure 2 as png file
     saveas(3,'Entropy.png')                                      % saving the figure 3 as png file

     cd(current_directory)                                        % changing the current working directory initial directory

end                                                               % ending the loop

fclose(thermo_data);                                              % closing the file
User-defined Function 'thermo_properties'
function [cp, h, s] = thermo_properties(a1,a2,a3,a4,a5,a6,a7,a8,a9,a10,a11,a12,a13,a14,T,local_mid_temp)
R = 8.314;   % specifying the universal gas constant

if T > local_mid_temp                                                                % using if statement to specify conditions for high temp coefficient
    cp = R.*(a1 + a2.*T + a3.*T.^2 + a4.*T.^3 + a5.*T.^4);                           % calculating specific heat
    h = R.*T.*(a1 + a2.*T./2 + a3.*T.^2./3 + a4.*(T.^3)./4 + a5.*(T.^4)./5 + a6./T); % calculating enthalpy
    s = R.*(a1.*log(T) + a2.*T + a3.*T.^2./2 + a4.*T.^3./3 + a5.*T.^4./4 + a7);      % calculating entropy
else                                                                                 % low temperature coefficients
    cp = R.*(a8 + a9.*T + a10.*T.^2 + a11.*T.^3 + a12.*T.^4);                        % calculating specific heat
    h = R.*T.*(a8 + a9.*T./2 + a10.*T.^2./3 + a11.*T.^3./4 + a12.*T.^4./5 + a13./T); % calculating enthalpy
    s = R.*(a8.*log(T) + a9.*T + a10.*T.^2./2 + a11.*T.^3./3 + a12.*T.^4./4 + a14);  % calculating entropy
end
end
User-defined Funciton 'molecular_weight'
function [mol_wt] = molecular_weight(species)

elements = {'O','H','N','C','AR'};                                        % assigning the symbol of the elements to a cell array
atomic_wt = [15.999,1.00794,14.0067,12.0107,39.948];                      % assigning atomic weights of the corresponding elements
mol_wt = 0;                                                               % initializing variable mol_wt
for i = 1:length(species)                                                 % initializing for loop variable i
    atoms = str2double(species(i));                                       % converting the character from the string to double
    for j = 1:length(elements)                                            % initializing loop variable j
        if strcmpi(species(i),elements{j}(1))                             % using conditional if statement and using strcompi to compare the string characters
            mol_wt = (mol_wt + atomic_wt(j));                             % calculating molecular weight
            element_location = j;                                         % assigning the location of matched element to variable
        elseif ~isnan(atoms)                                              % using the elseif statement and ~isnan logical funciton to set the condition
            mol_wt = mol_wt + atomic_wt((element_location))*(atoms-1);    % calculating molecular weight
            break                                                         % using break statement to exit the loop
        end                                                               % ending the if-elseif statement
    end                                                                   % ending the for loop
end                                                                       % ending the for loop
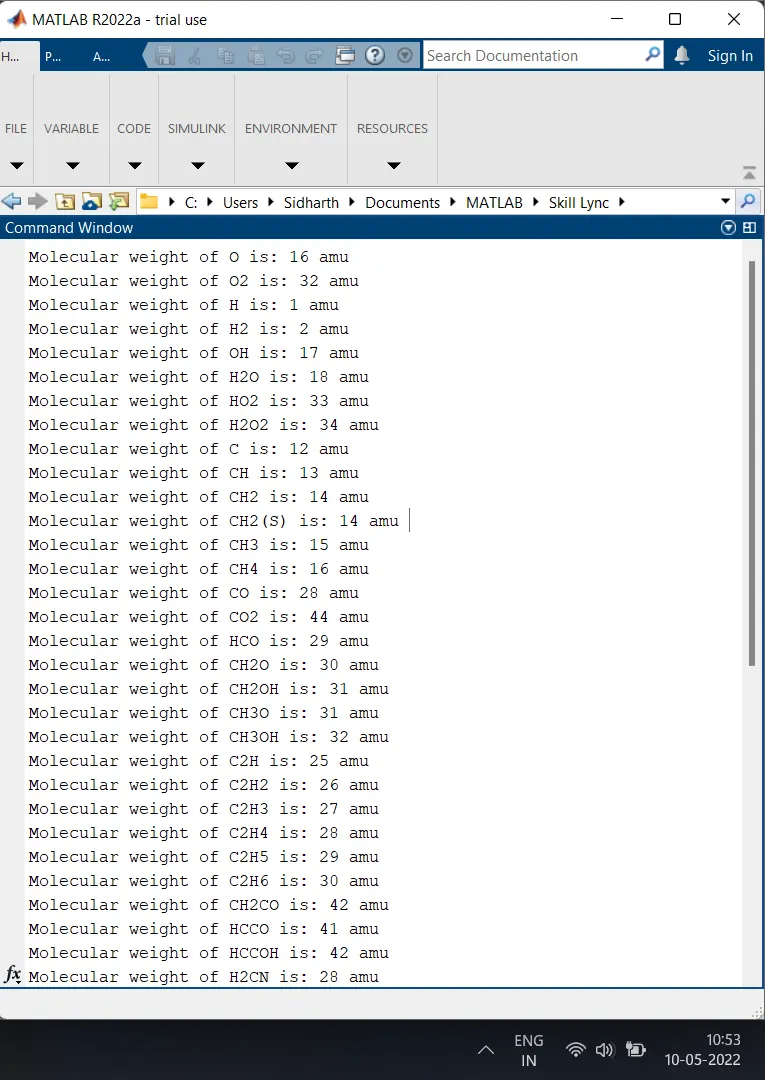
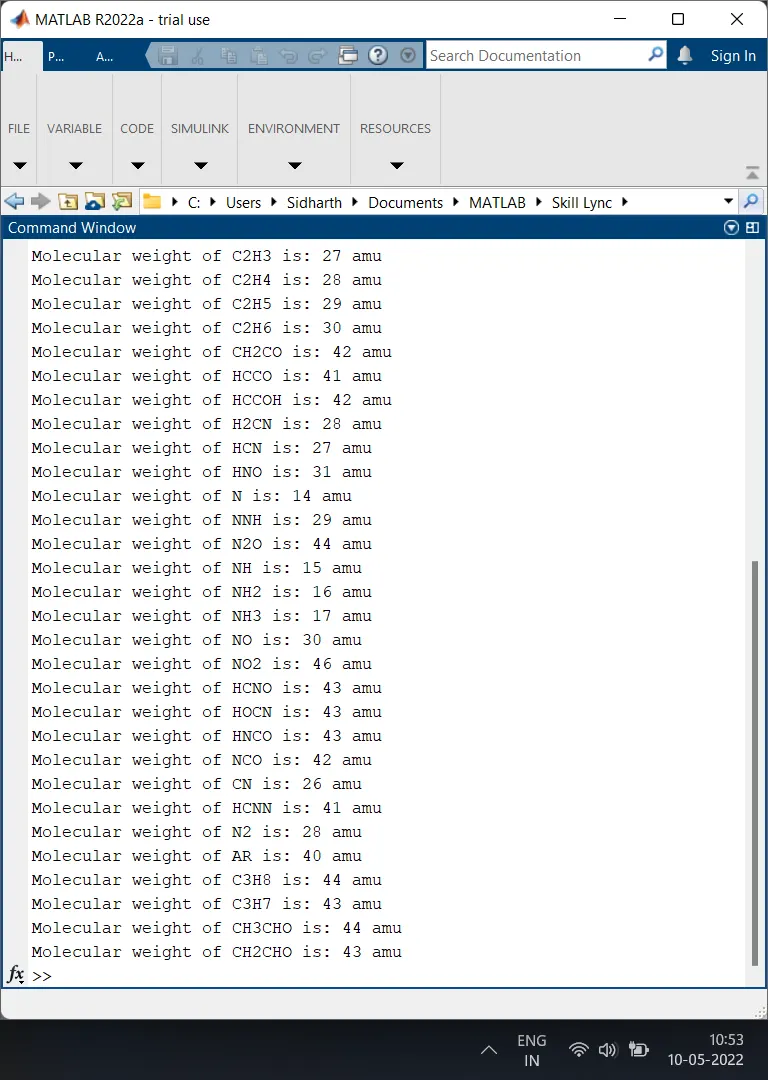
fprintf('Molecular weight of %s is: %.f amu \n',species,round(mol_wt))    % printing the molecular weight.
end
Explanation for the main script
First I've opened the file for reading using fopen command and assigned it to variable thermo_data. Then I've used fgetl function to read the first and second line from the file and these lines are assigned to variables. Then I've used strspilt function on the string array 'temp_line' to split the string at delimeter 'space'. This will give a cell array. Now to convert the temperature values from character type to number I've used function str2double. The location of the cells in the cell array is provided using braces{}. Then the converted values are assigned to the variables. After this I've used for loop to read the next three lines which are comments. I've used fgetl, eval and sprintf functions inside the loop to read the lines and assign them to the variables. sprintf function writes the formatted data to string and eval function will execute the string or character as regular code.
Following are the outputs returned after executing the program
Screenshots of the plots
Screenshots of the command window
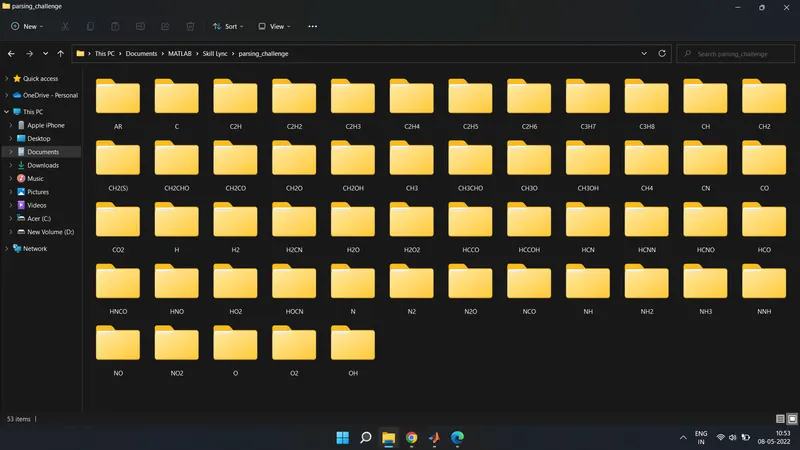
Screenshot of speceis folder