Project 1 - Parsing NASA thermodynamic data
AIM: - To write a code in matlab to parse nasa thermodynamic data file and then calculate thermodynamic properties of various gas species.
- Write a function that extracts the 14 coefficients and calculate the enthalpy, entropy and specific heat for all the species in the data file.
- Calculate the molecular weight of each species and display it in the command window.
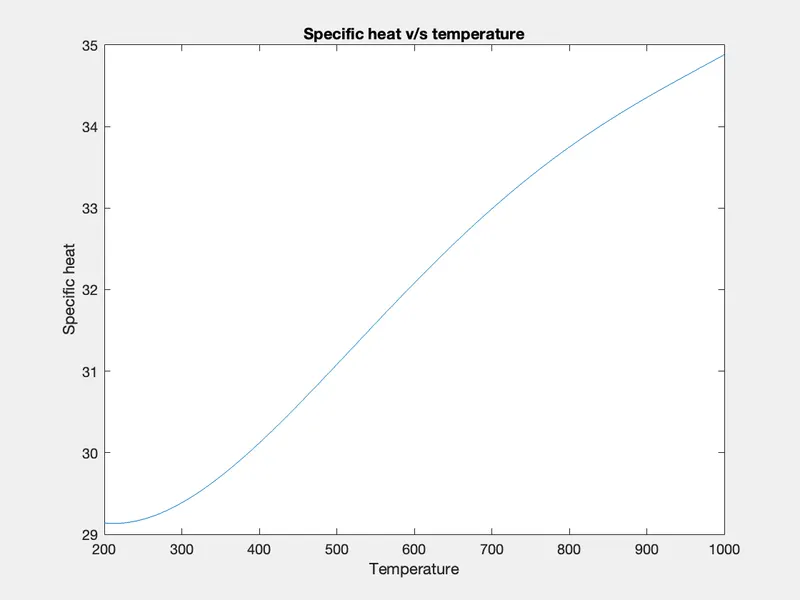
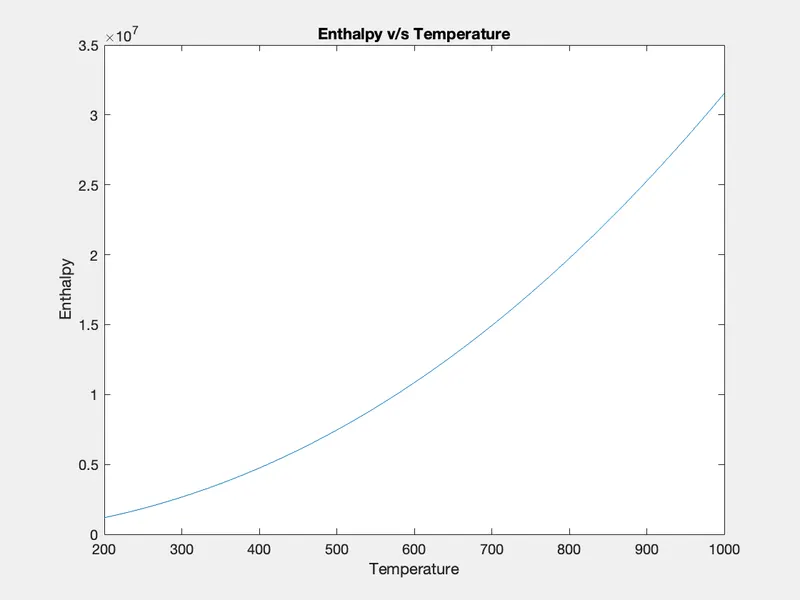
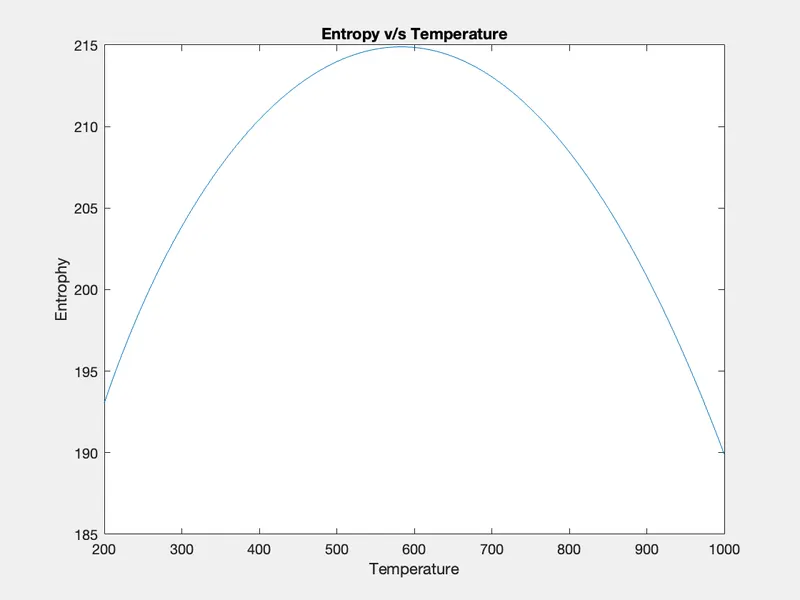
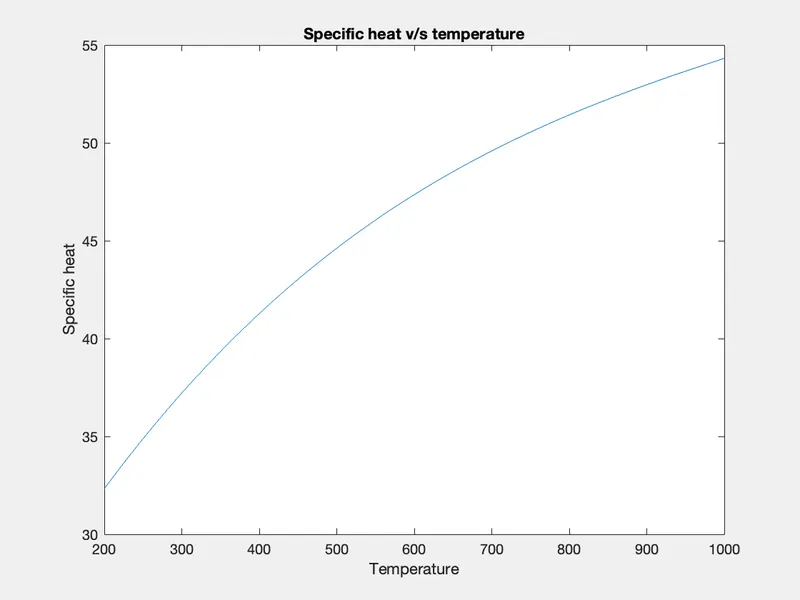
- Plot the Cp, enthalpy and Entropy for the local temperature range species for each species.
- Saving the plots as images with appropriate names and dump them in separate folders for each species with suitable name.
File Parsing: -
In general, the term "parsing" means reading an m-file (script or function) and translating it into an internal code that it stores in memory. It is this "parsed" file in memory that is actually run when you execute the code.
`C_p/R=a1+a2T+a3T^2+a4T^3+a5T^4`
`H/(RT)=a1+(a2T)/2+(a3T^2)/3+(a4T^3)/4+(a5T^4)/5+a6/T`
`S/R=a1lnT+a2T+(a3T^2)/2+(a4T^3)/3+(a5T^4)/4+a7`
where: -
T = local temperature
b1 – b2 = high temperature coefficient
b8 – b14 = low temperature coefficient
R = Gas constant = 8.314
PROGRAM: -
Specific Heat
function[C_p] =specific_heat(a1,a2,a3,a4,a5,a8,a9,a10,a11,a12,local_mid_temp,T,R)
if (T>local_mid_temp)
C_p = R*(a1+(a2*T) + (a3*(T.^2))+(a4*(T.^3))+(a5*(T.^4)));
else
    C_p=R*(a8+(a9*T)+(a10*(T.^2))+(a11*(T.^3))+(a12*(T.^4)));
end
Ethalpy
function[H]=enthalpy(a1,a2,a3,a4,a5,a6,a8,a9,a10,a11,a12,a13,local_mid_temp,T,R)
if (T>local_mid_temp)
    H = (a1*T+(a2*(T.^2/2))+(a3*(T.^3))+(a4*(T.^4/4)+(a5*(T.^5)/5)+a6)).*T*R;
else
    H = (a8*T+(a9*(T.^2)/2)+(a10*(T.^3)/3)+(a11*(T.^4)/4)+(a12*(T.^5)/5)+(a13./T)).*T*R;
end
Entropy
function [S] = entropy(a1,a2,a3,a4,a5,a7,a8,a9,a10,a11,a12,a14,local_mid_temp,T,R)
if (T>local_mid_temp)
    S = R*(a1*log(T)+(a2*T)+(a3*(T.^2)/2)+(a4*(T.^3))+(a5*(T.^4)/4)+a7);
else
    S = R*(a8*log(T)+(a9*T)+(a10*(T.^2)/2)+(a11*(T.^3))+(a12*(T.^4)/4)+a14);
end
Molecular weight
function[M] = molecular_wt(species_name)
atomic_mass = [15.999,1.008,12.011,14.007,39.948];
elements = ['o','H','C','N','A'];
mol_wt = 0;
for i = 1:length(species_name)
for j = 1:length(elements)
if strcmp(species_name(i),elements(j))
mol_wt = mol_wt+atomic_mass(j);
z=j;
end
end
t = str2double(species_name);
if (t>1)
mol_wt = mol_wt + (atomic_mass(z)*(t-1));
end
end
M = mol_wt;
endclose all
clear
clc
f1 = fopen('THERMO.dat','r');
fgetl(f1)
tline2 = fgetl(f1);
% X = temperatures
X = strsplit(tline2,' ');
global_low_temp = str2double(X{2});
global_mid_temp = str2double(X{3});
global_high_temp= str2double(X{4});
for i = 3:5
A = fgetl(f1);
end
for i = 1:53
tline6 = fgetl(f1);
S = strsplit(tline6);
species_name= S{1};
A = strfind(tline6,'G');
temp_value = tline6(A+4:length(tline6));
B = strsplit(temp_value,' ');
local_low_temp = str2double(B{1});
local_mid_temp = str2double(B{2});
local_high_temp= str2double(B{3});
tline7 = fgetl(f1);
B = strfind(tline7,'E');
a1 = str2double(tline7(1:B(1)+3));
a2 = str2double(tline7(B(1)+4:B(2)+3));
a3 = str2double(tline7(B(2)+4:B(3)+3));
a4 = str2double(tline7(B(3)+4:B(4)+3));
a5 = str2double(tline7(B(4)+4:B(5)+3));
tline8 = fgetl(f1);
C =strfind(tline8,'E');
a6 = str2double(tline8(1:C(1)+3));
a7 = str2double(tline8(C(1)+4:C(2)+3));
a8 = str2double(tline8(C(2)+4:C(3)+3));
a9 = str2double(tline8(C(3)+4:C(4)+3));
a10 = str2double(tline8(C(4)+4:C(5)+3));
tline9 = fgetl(f1);
D = strfind(tline9,'E');
a11 = str2double(tline9(1:D(1)+3));
a12 = str2double(tline9(D(1)+4:D(2)+3));
a13 = str2double(tline9(D(2)+4:D(3)+3));
a14 = str2double(tline9(D(3)+4:D(4)+3));
% R = universal gas constant
R = 8.314;
T = linspace(local_low_temp,local_high_temp,100);
C_p = specific_heat(a1,a2,a3,a4,a5,a8,a9,a10,a11,a12,local_mid_temp,T,R);
H = enthalpy(a1,a2,a3,a4,a5,a6,a8,a9,a10,a11,a12,a13,local_mid_temp,T,R);
S = entropy(a1,a2,a3,a4,a5,a7,a8,a9,a10,a11,a12,a14,local_mid_temp,T,R);
req_species = ["O2","N2","CO2"];
mkdir(['G:O/',species_name])
C_p(species_name)
figure(1)
plot(T,C_p)
title('Specific heat v/s temperature')
xlabel('Temperature')
ylabel('Specific heat')
image=getframe(gcf);
imwrite(image.cdata,'t vs C_p.png')
saveas(1,'specific heat','jpg')
figure(2)
plot(T,H)
title('Enthalpy v/s Temperature')
xlabel('Temperature')
ylabel('Enthalpy')
image=getframe(gcf);
imwrite(image.cdata,'t vs H.png')
saveas(2,'Enthalpy','jpg')
figure(3)
plot(T,S)
title('Entropy v/s Temperature')
xlabel('Temperature')
ylabel('Entrophy')
image=getframe(gcf);
imwrite(image.cdata,'t vs S.png')
saveas(3,'Entropy','jpg')
[M]= molecular_wt(species_name);
K=sprintf('%s mol_wt=%f',species_name,M);
disp(K)
endplots for O2: -
specific heat and temperature
Enthalpy and temperature
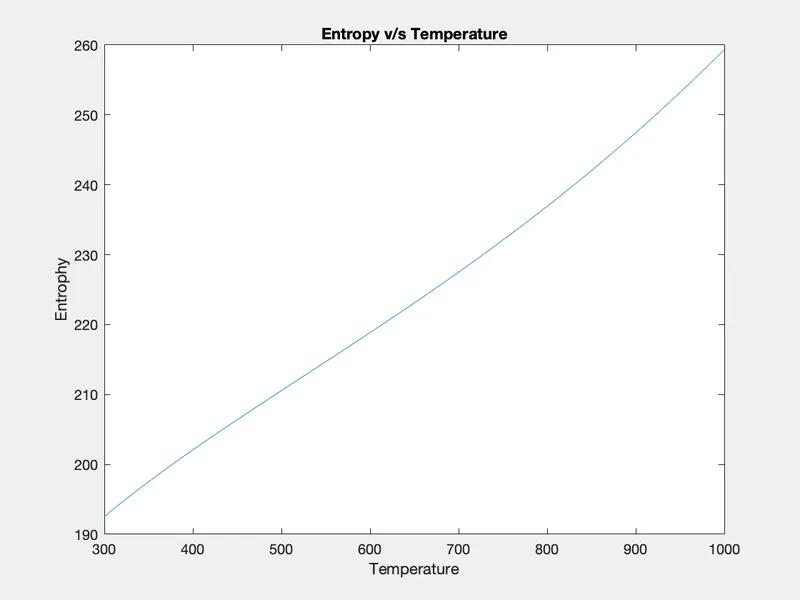
entropy and temperatue.
plots for CO2
specific heat and temperature
enthalpy and temperature
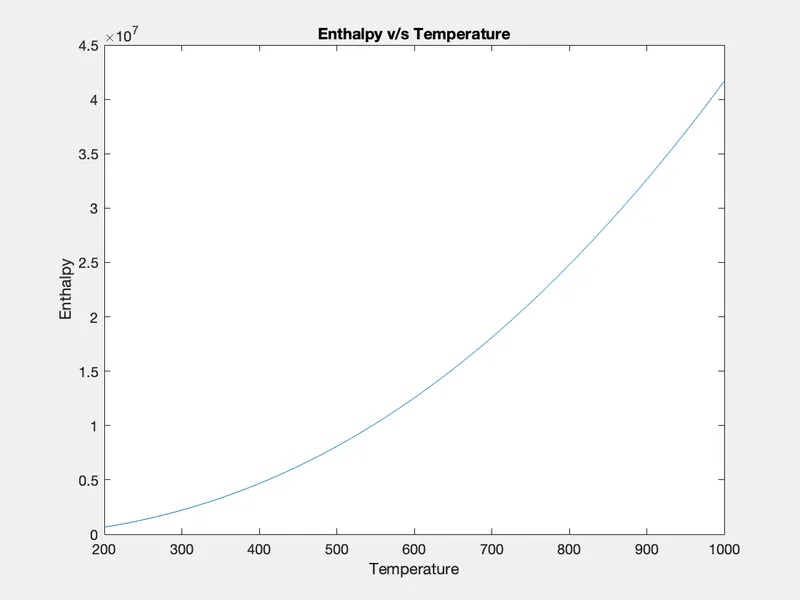
Entrophy and Temperature
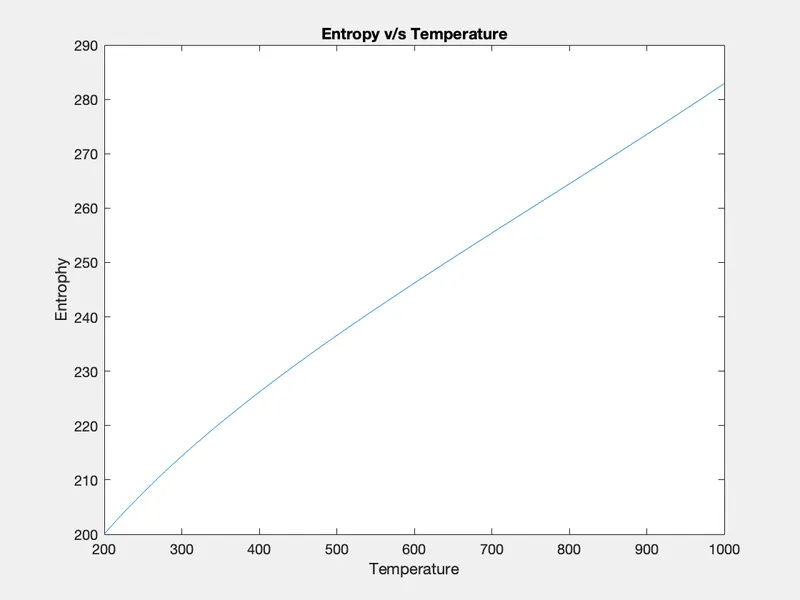
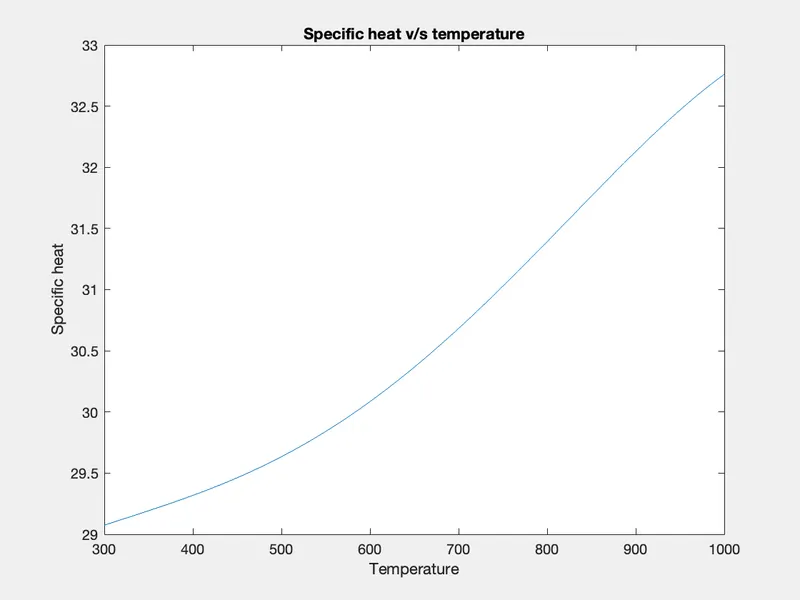
plots for N2
specific heat and temperature
enthalpy and temperature
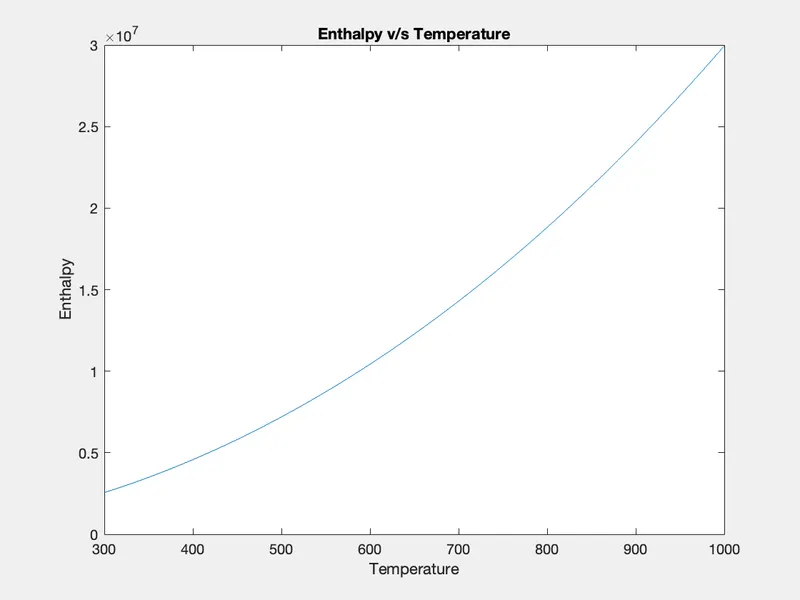
Entropy and Temperature
Molecular Weight
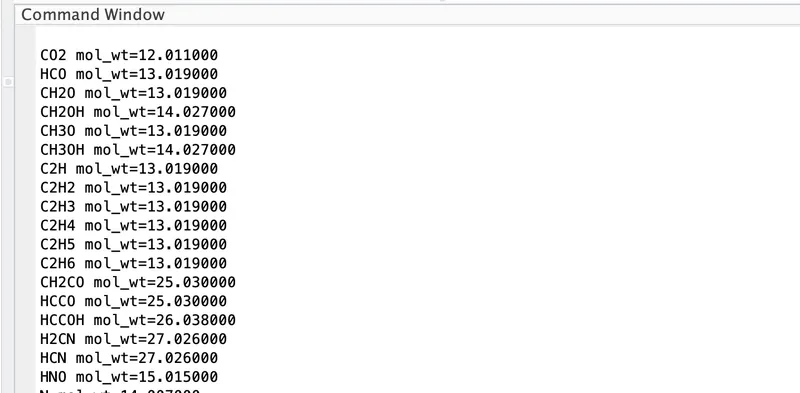
photo of species