Project 1 - Parsing NASA thermodynamic data
AIM
To calculate specific heat ,enthalpy ,entropy and molecular weight for all species given in nasa thermodynamic data file using matlab.
OBJECTIVE:
1.To calculate specific heat , entropy, enthalpy and molecular weight for all species .
2.To create a directory and store all species.
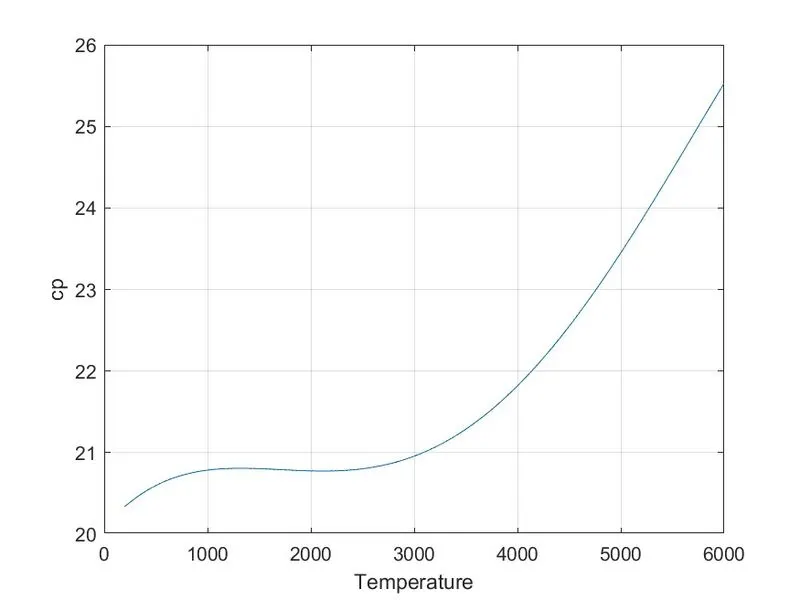
3.Plot for all species and stored in a particular file .
INTRODUCTION
From the given thermodynamic file ,we need to read the external file and import all species coefficients and temperature values to the program to calculate cp, s, h by using the respective formula.The specific heat is the amount of heat per unit mass required to raise the temperature by 1 degree celsius. Enthalpy the sum of internal energy and the product of the pressure and volume of a thermodynamic system . Entropy the measure of a system's thermal energy per unit temperature that is unavailable for doing useful work . The formula for specific heat , entropy , and entthalpy are given below.
clear all
close all
clc
f1 = fopen('Thermo.dat','r')
fgetl(f1)
fgetl(f1)
fgetl(f1)
fgetl(f1)
fgetl(f1)
for j = 1:53
tline = fgetl(f1)
A = strsplit(tline,' ')
sp = A{1}
llt = str2num(A{end-3})
lht= str2num(A{end-2})
lmt= str2num(A{end-1})
tline = fgetl(f1)
pos = findstr(tline,'E')
a1 = str2num(tline(1:pos(1)+3)
a2 = str2num(tline(pos(1)+4:pos(2)+3))
a3 = str2num(tline(pos(2)+4:pos(3)+3))
a4 = str2num(tline(pos(3)+4:pos(4)+3))
a5 = str2num(tline(pos(4)+4:pos(5)+3))
tline = fgetl(f1)
a6 = str2num(tline(1:pos(1)+3)
a7 = str2num(tline(pos(1)+4:pos(2)+3))
a8 = str2num(tline(pos(2)+4:pos(3)+3))
a9= str2num(tline(pos(3)+4:pos(4)+3))
a10 = str2num(tline(pos(4)+4:pos(5)+3))
tline = fgetl(f1)
a11 = str2num(tline(1:pos(1)+3)
a12 = str2num(tline(pos(1)+4:pos(2)+3))
a13 = str2num(tline(pos(2)+4:pos(3)+3))
a14= str2num(tline(pos(3)+4:pos(4)+3))
T = linspace(llt,lht,500);
R = 8.314
cp = specificheat(a1,a2,a3,a4,a5,a8,a9,a10,a11,a12,lmt,T,R);
H = Enthalpy (a1,a2,a3,a4,a5,a6,a8,a9,a10,a11,a12,a13,lmt,T,R);
S = Entropy(a1,a2,a3,a4,a5,a7,a8,a9,a10,a11,a12,a14,lmt,T,R);
function[cp] = specific_heat(a1,a2,a3,a4,a5,a8,a9,a10,a11,a12,lmt,T,R);
% Finding specific heat with low and high temperature variables
if T<=lmt
cp = (a8+(a9*T)+(a10*T.^2)+(a11*T.^3)+(a12*T.^4))*R;
else
cp = (a1+(a2*T)+(a3*T.^2)+(a4*T.^3)+(a5*T.^4))*R
end
end
function[s] = Entropy(a1,a2,a3,a4,a5,a7,a8,a9,a10,a11,a12,a14,lmt,T,R);
if T<=lmt
S = (a8*log(T)+(a9*T)+(a10*log(T)+(a11*T.^3/3)+(a12*T.^4/4)+(a14)*R;
else
S = (a1*log(T)+(a2*T)+(a3*t.^2/2)+(a4*T.^3/3)+(a5*T.^4/4)+(a7))*R;
end
end
function [H] = Enthalpy (a1,a2,a3,a4,a5,a6,a8,a9,a10,a11,a12,a13,lmt,T,R);
if T<= lmt
H = (a8+(a9*T/2)+(a10*T.^2/3)+(a11*T.^3/4)+(a12*T.^4/5)+(a13./T))*R.*T
else
H = (a1+(a2*T/2)+(a3*T.^2/3)+(a4*T.^3/4)+(a5T.^4/5)+(a6./T))*R.*T
end
end
figure(1)
plot(t,cp)
xlabel('Temperature')
ylabel('specific_heat')
grid on
figure(2)
plot(T,H)
xlabel('Temperature')
ylabel('Enthalpy')
grid on
figura(3)
plot(T,S)
xlabel('Temperature')
ylabel('Entropy')
mkdir(sp)
saveas(1,'specificheat','jpg')
saveas(2,'Enthalpy','jpg')
saveas(3,'Entropy','jpg')
cd..
end
% To calculate molecular weight
elements = {'H','C','O','N','A','S'};
atomic_weight = [1,12,16,14,39,32];
molecular_weight=0;

 for k=1:length(species)
     for l=1:length(elements)
         if strcmp(species(k),elements(l))
             molecular_weight = molecular_weight+atomic_weight(l);
             position=l;
         end
     end
       n = str2double(species(k));
       if(n>1)
             molecular_weight = molecular_weight+(atomic_weight(position)*(n-1));
 end
end

                                    CARBON SPECIES
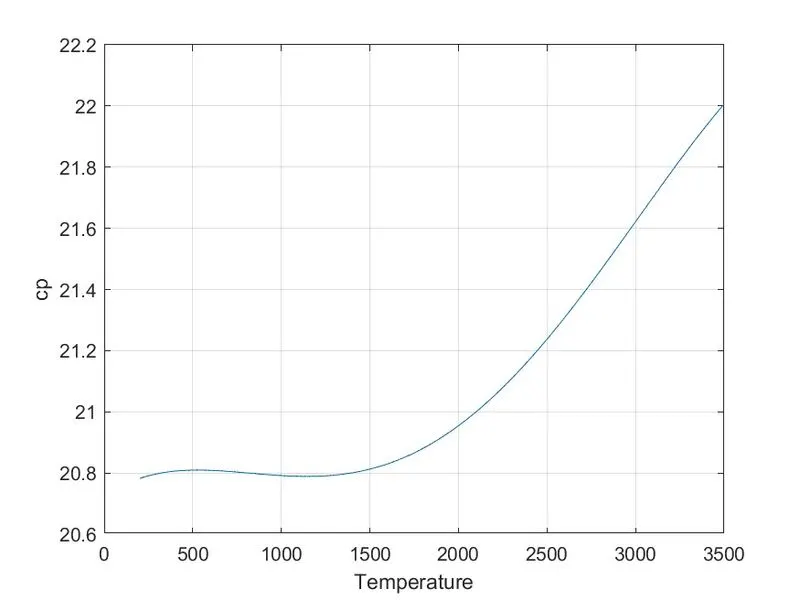
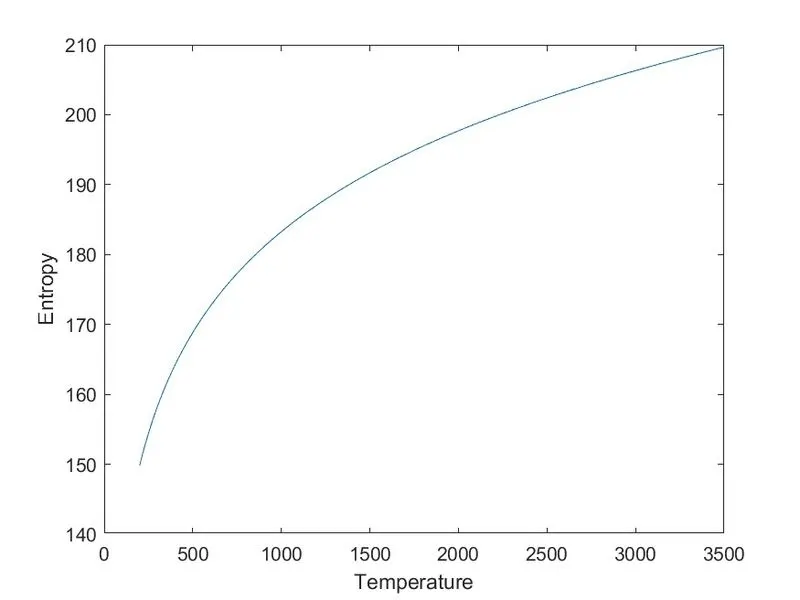
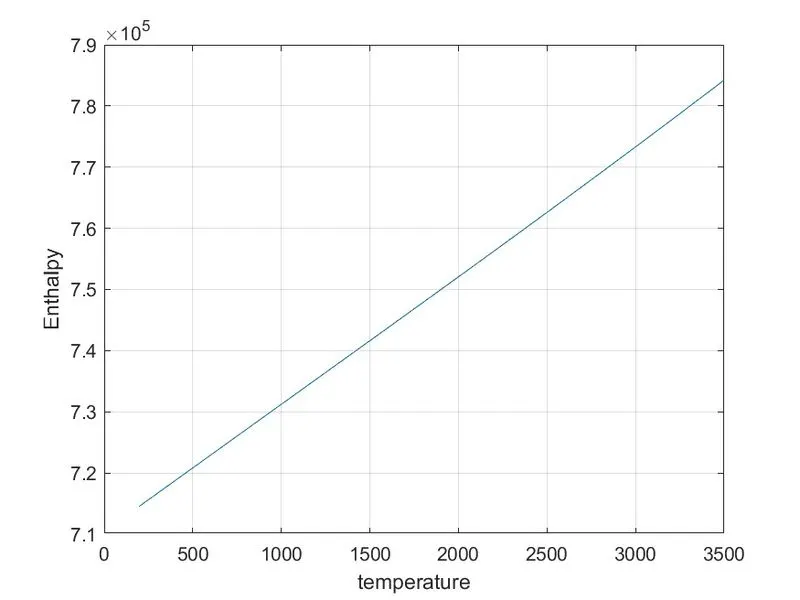
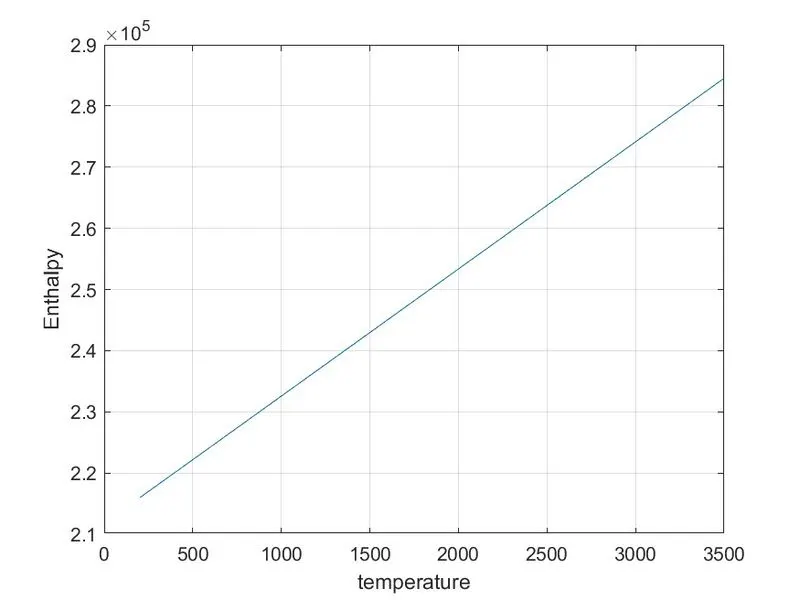
HYDROGEN SPECIES
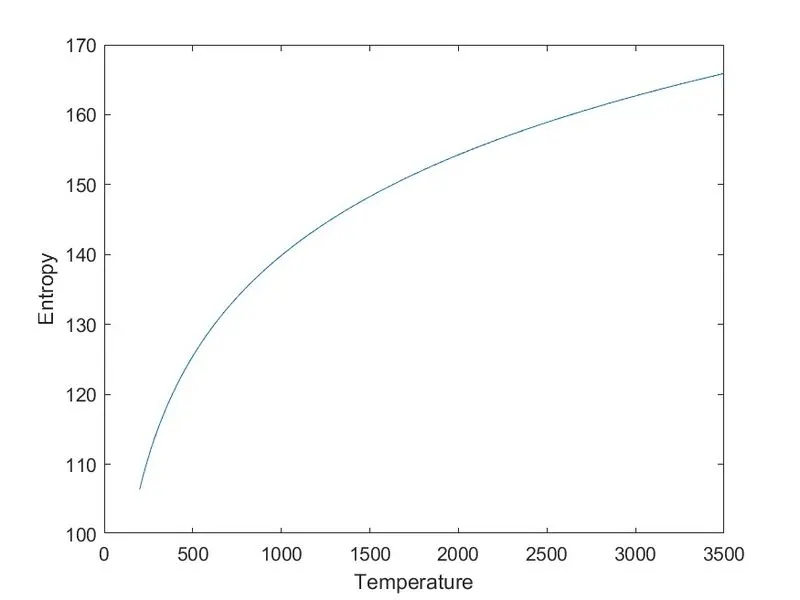
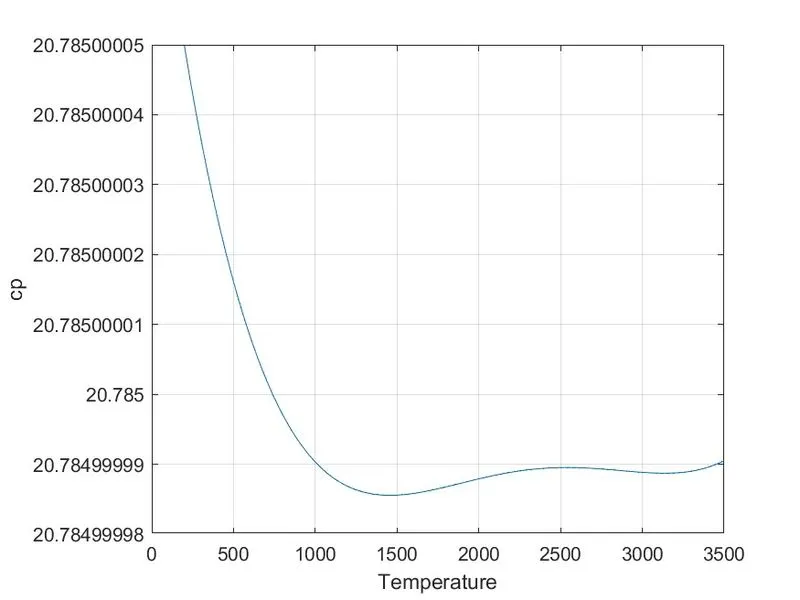
NITOGEN SPECIES
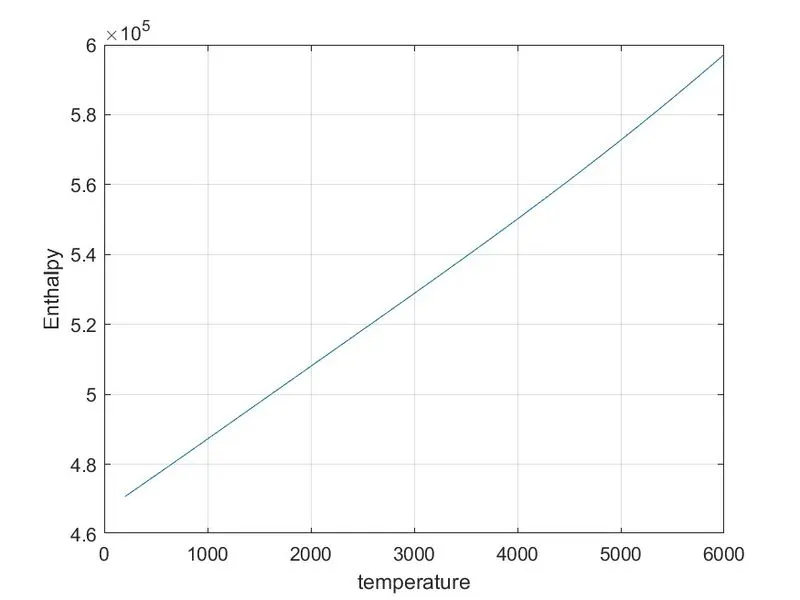
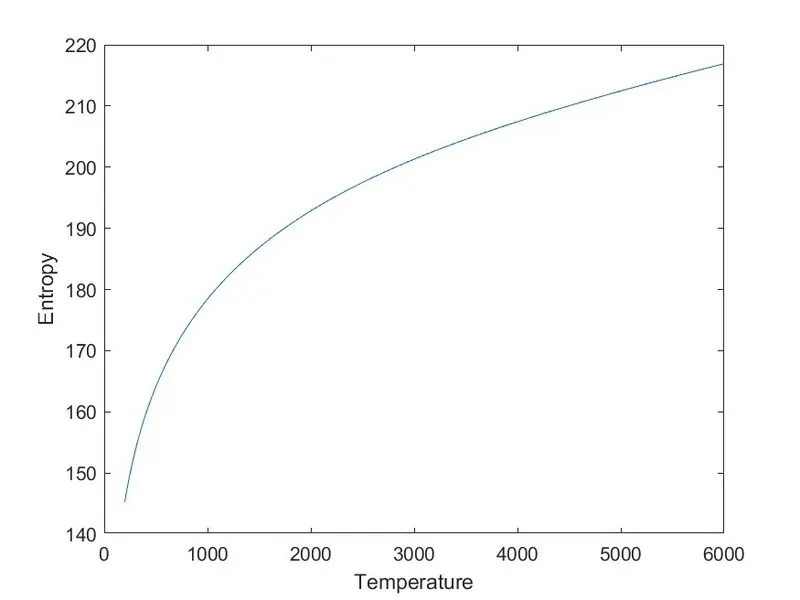
CONCLUSION
1. Plots are obtained for all species and stored in particular folder.
2. Specific heat ,entropy, enthalpy are calculated by using formula and by condition 1st seven coefficients are high temperature and seven coefficients are low temperature.
LEAVE A COMMENT
Thanks for choosing to leave a comment. Please keep in mind that all comments are moderated according to our comment policy. your email address will not be published. Let's have a personal and meaningful conversation.