Project 1 - Parsing NASA thermodynamic data
PARSING NASA THERMODYNAMIC DATA
File parsing is one of the important term which is offenly used to import the data of the given file in our programm.By the file parsing we can actually call the desire data of already exixted file in our program by just using the command FGETl.this commands helps a lot in importing the various data through a file which is stored in the same foldere as our programm.
For getting the data from THERMO.dat file we have to use the command
fgetl(f1)
fgetl command calls the data from the given file
below fig shows the output of the programm for various species.There are total 53 speciesfor all thoes species we have to excecute the code, and for all thoes species we have to plot the graphs.
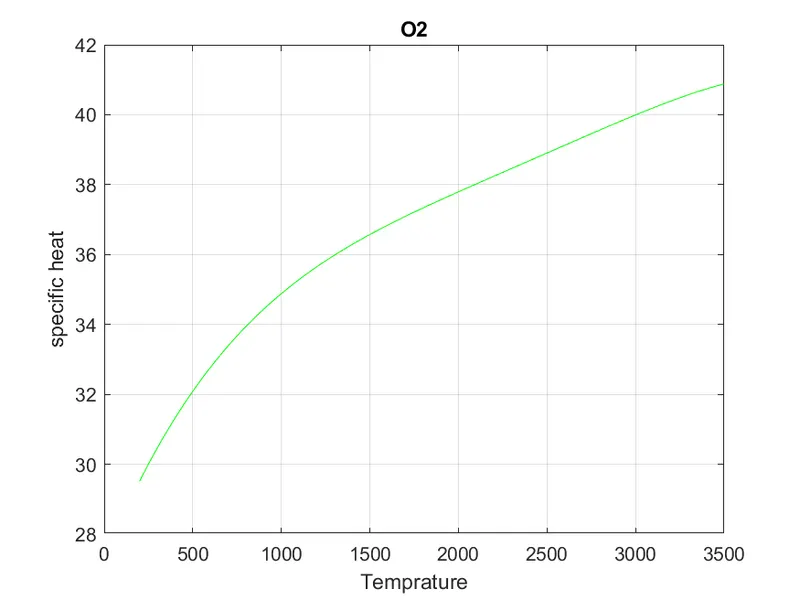
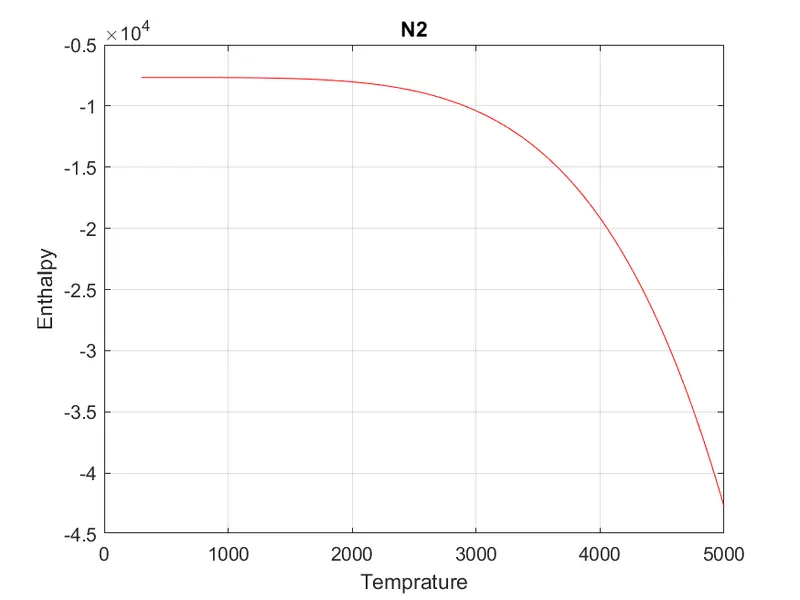
fig=O2(cp vs T) fig= N2(H vs T)
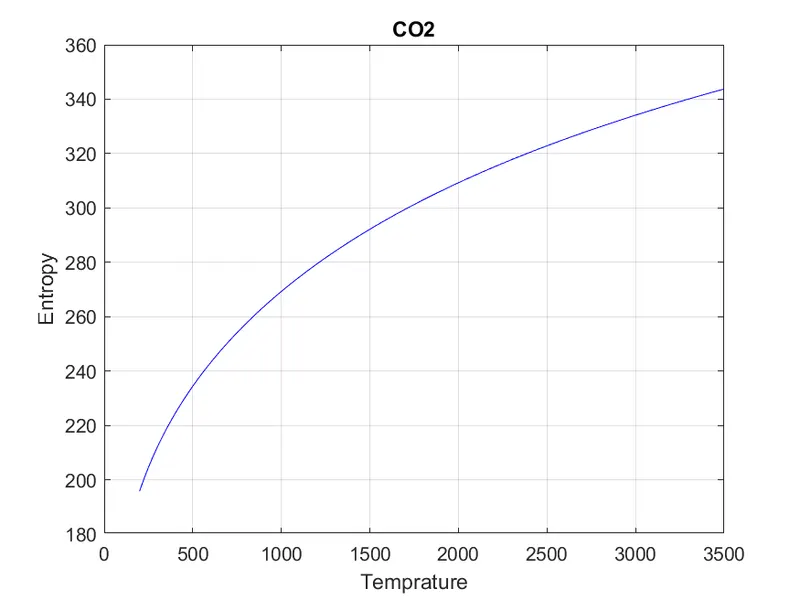
fig=CO2(S vs T)
Following is the code for Nasa file parsing.
 clear all
close all
clc

f1=fopen('THERMO.dat','r');
for i=1:5
    a=fgetl(f1);
end
for i=1:53

header=fgetl(f1);
a=strsplit(header,' ');
species_name=a{1};

llt=str2double(a{end-3});
lht=str2double(a{end-2});
lmt=str2double(a{end-1});

linel=fgetl(f1);
e1=strfind(linel,'E');
a1=str2double(linel(1:e1(1)+3));
a2=str2double(linel(e1(1)+4:e1(2)+3));
a3=str2double(linel(e1(2)+4:e1(3)+3));
a4=str2double(linel(e1(3)+4:e1(4)+3));
a5=str2double(linel(e1(4)+4:e1(5)+3));

   % finding coefficients
%line 2
line2=fgetl(f1);
e2=strfind(line2,'E');
a6=str2double(line2(1:e2(1)+3));
a7=str2double(line2(e2(1)+4:e2(2)+3));
a8=str2double(line2(e2(2)+4:e2(3)+3));
a9=str2double(line2(e2(3)+4:e2(4)+3));
a10=str2double(line2(e2(4)+4:e2(5)+3));


%higher coefficients

line3=fgetl(f1);
e3=strfind(line3,'E');
a11=str2double(line3(1:e3(1)+3));
a12=str2double(line3(e3(1)+4:e3(2)+3));
a13=str2double(line3(e3(2)+4:e3(3)+3));
a14=str2double(line3(e3(3)+4:e3(4)+3));

R=8.314;
   T=linspace(llt,lht,500);
cp=specific_heat(a1,a2,a3,a4,a5,a8,a9,a10,a11,a12,T,lmt,R);

H=enthalpy(a1,a2,a3,a4,a5,a6,a8,a9,a10,a11,a12,a13,lmt,R,T);


S=entropy(a1,a2,a3,a4,a5,a7,a8,a9,a10,a11,a12,a14,lmt,T,R);


% plotting the graphs

figure(1);
plot(T,cp,'Color','g');
grid on;
title(species_name);
xlabel('Temprature');
ylabel('specific heat');


figure(2);

plot(T,H,'Color','r');
grid on;
title(species_name);
xlabel('Temprature');
ylabel('Enthalpy');


figure(3)
plot(T,S,'Color','b')
grid on;
title(species_name);
xlabel('Temprature');
ylabel('Entropy');


atoms=['O','H','C','N','A'];
atomic_weight=[16 1 12 14 28];
MW=0;
for i=1:length(species_name)
    for j= 1:length(atoms)
    if strcmp(species_name(i),atoms(j))
        MW=MW+atomic_weight(j);
        dt=j;
    end
    end
    n=str2num(species_name(i));
    if n>1
        MW=MW+(atomic_weight(dt).*(n-1));
    end
end

sprintf('Molecular weight of %s:%f u',species_name,MW)


mkdir(species_name)
cd (species_name)

saveas(figure(1),'cp vs Temp.png')
saveas(figure(2),'H vs Temp.png')
saveas(figure(3),'S vs Temp.png')
cd ..
end
There are lots inputs which are required to run the code for nasa file parsing.
T=temprature
R=universal gas constant(8.314 j/mole*k)
CP= specific heat
H= enthalpy
S=entopy
Below fig shows the NASA file data.
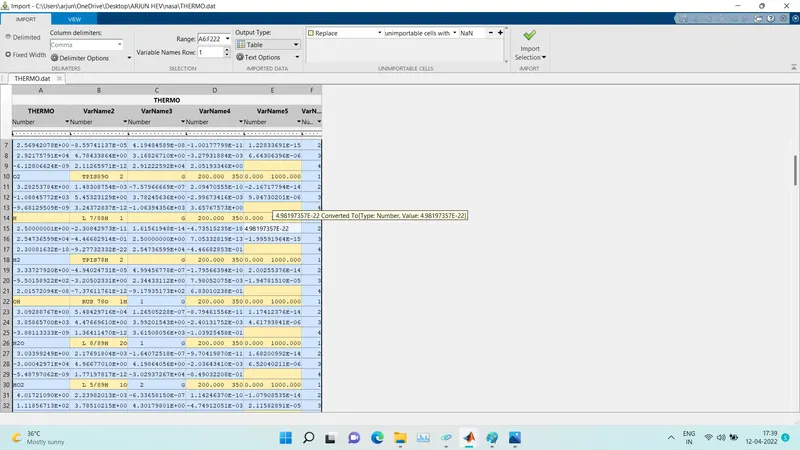
fig=NASA flle
Below image indicates the output of multiple species.
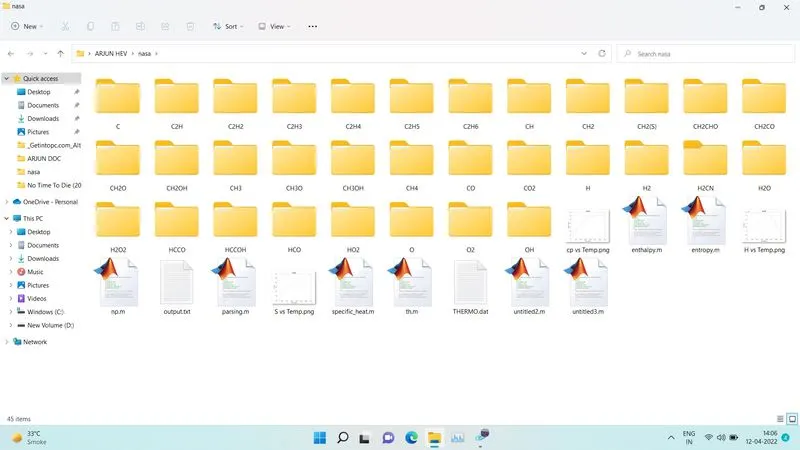
fig=output of programm for all species in all folders
REPORT
PARSING NASA THERMODYNAMIC DATA
File parsing is one of the important term which is offenly used to import the data of the given file in our programm.By the file parsing we can actually call the desire data of already exixted file in our program by just using the command FGETl.this commands helps a lot in importing the various data through a file which is stored in the same foldere as our programm.
there are multiple species for which we have to get output.and fprall thoes outputs we have to run programm in for loop. For loop is used for obtaining the output of no of species or anything which is for number of times .So there are total 53 species and we created for loop.
for i= 1:53
end
This command helps us to to get input for 53 species in single programm. we dont have to create seperate 53 programms.
So there are total 14 variables a1 to a14 .so we have to create function for obtaining the values of cp H and S.
so for that we have created funcyion which carries this 14 variabes and temprature and R(universal gas cont)
we have to obtain the values for below values with the help of formule shown in fig.
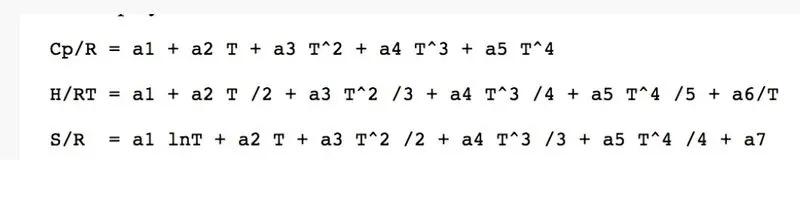
fig=formule for CP H S
for obtaining the values we had to create 3 functions, which are attached.
Function for CP
function [cp]=specific_heat(a1,a2,a3,a4,a5,a8,a9,a10,a11,a12,T,lmt,R)
if T
function for H
function [H]= enthalpy(a1,a2,a3,a4,a5,a6,a8,a9,a10,a11,a12,a13,lmt,R,T)
%finding enthalpy with low temp and variables
if T<=lmt
    H=(a8+(a9*T/2)+(a10*(T.^2)/3)+(a11*(T.^3)/4)+(a12*(T.^4)/5)+(a13./T))*R.*T;
else
    H=(a1+(a2*T/2)+(a3*T.^2)/3)+(a4*(T.^3)/4)+(a5*(T.^4)/5+(a6./T))*R.*T;
end
end
function for S
function[S]=entropy(a1,a2,a3,a4,a5,a7,a8,a9,a10,a11,a12,a14,lmt,T,R)
%finding entropy with low and temp variables
if T<=lmt
    S=((a8*log(T))+(a9*T)+(a10*(T.^2)/2)+(a11*(T.^3)/3)+(a12*(T.^4)/4)+a14)*R;
else
    S=((a1*log(T))+(a2*T)+(a3*(T.^2)/2)+(a4*(T.^3)/3)+(a5*(T.^4)/4)+a7)*R;
end
end
By these all function we have obtaied the values of CP H and S.
so while running the programme we have faced a lot of difficulties .we have got lots of error while running the programme.
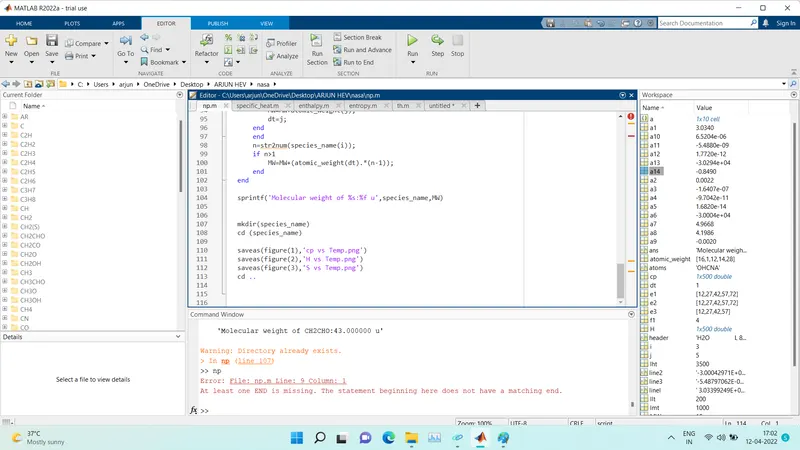
fig=error
we have also face the error due to improper array inputs .
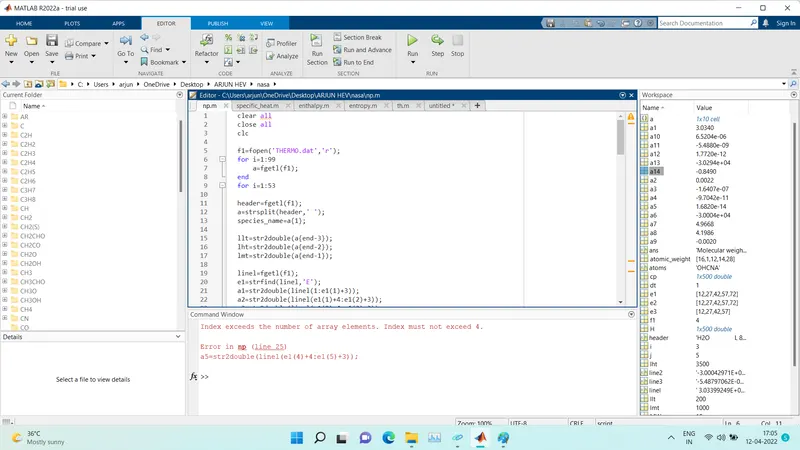
To overcome thoes errors we have gone through basic commands and observe what kind of mistakes we have done in typing the code. These all errors were due to iproper use of for loop and array .in for loop we didnt given the end command in the proper position,and while using the array we have exceeded the limts of the array.
like suppose we are creating for loop
for i= 1:53
daya=();
end
end so here we used the end commnd multiple times.
also about array we have exceeded the array value, like
a=[1 2 3 4 5]
fgetl(8)
errpr.
so here we exceeded the array value whoes limit is just upto 5 values and we have given input command for 8 th value.
Then after all thoes errors got resolved and moving on forward we got output for 53 species.
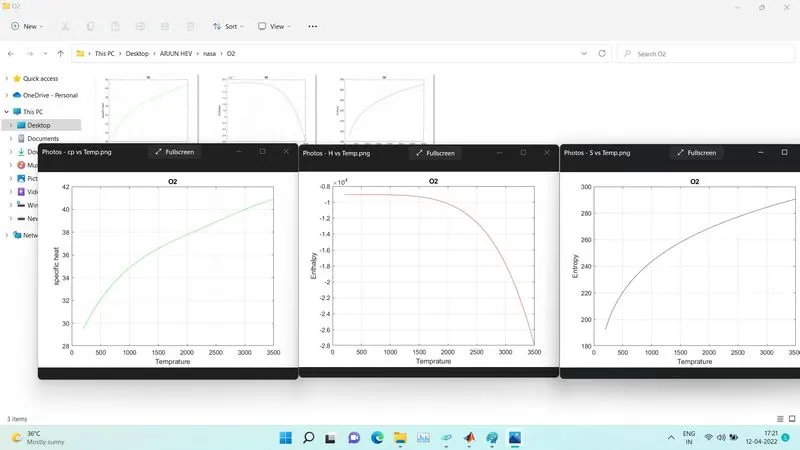
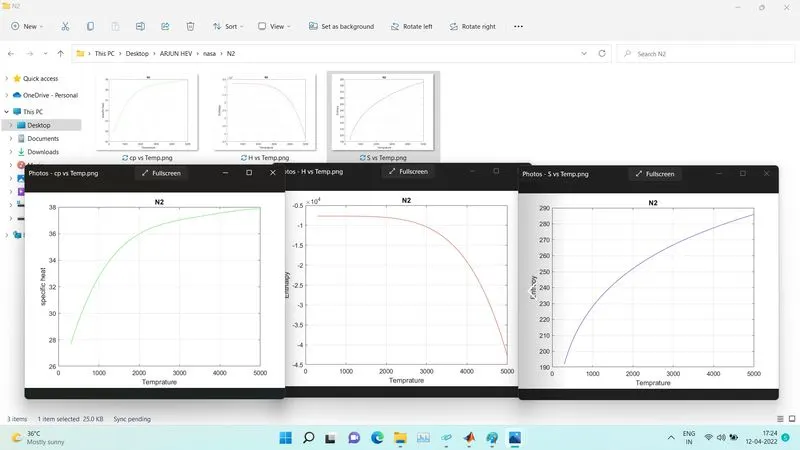
And for output of O2,CO2 and N2 we have got the outputs plots,which are shown below.
output for O2
Output for N2
plots for CO2
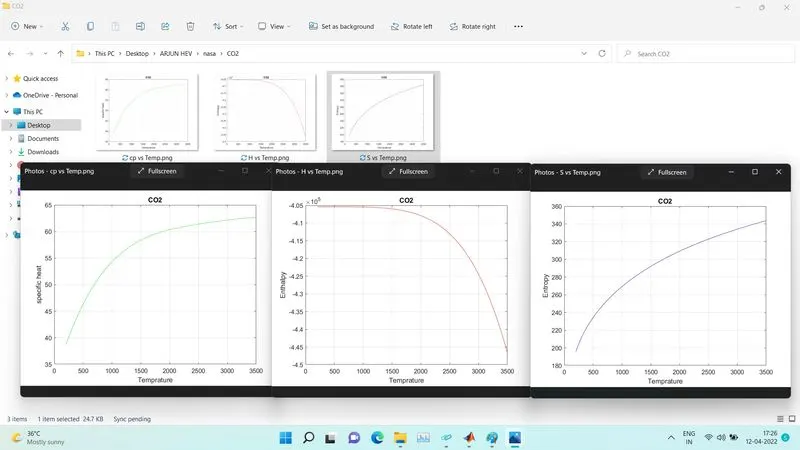
So these are the outputs for the O2,N2,and CO2
so for getting the data from the external file which is stored in the same folder as our programme we can actually use this cammand fgetl and followed by this command we can actually get the as much lines as given in the file for miltiple or for single time.
So parsing of file is very important aspect as it is very lenghty process to type all the data we want,so by parsing the file we can actually call thoes lines of that file without wrinting the whole data, we just have to call thoes lines by using proper commands of MATLAB.