Project 1 - Parsing NASA thermodynamic data
AIM:To write the matlab code to parse the NASA Thermodynamic data file and calculate the specific heat,enthalpy and entropy
for all the species in data file.
OBJECTIVE:
- Write a function that extracts the 14 coefficients and calculate the specific heat,enthalpy and entropy for all the species in data file.
- Calculate the molecular weight of each species and display it in the command window
- Plot the specific heat,enthalpy,entropy for the local temperature range specific for each species.
- Screenshot of the window where all the folders are saved.
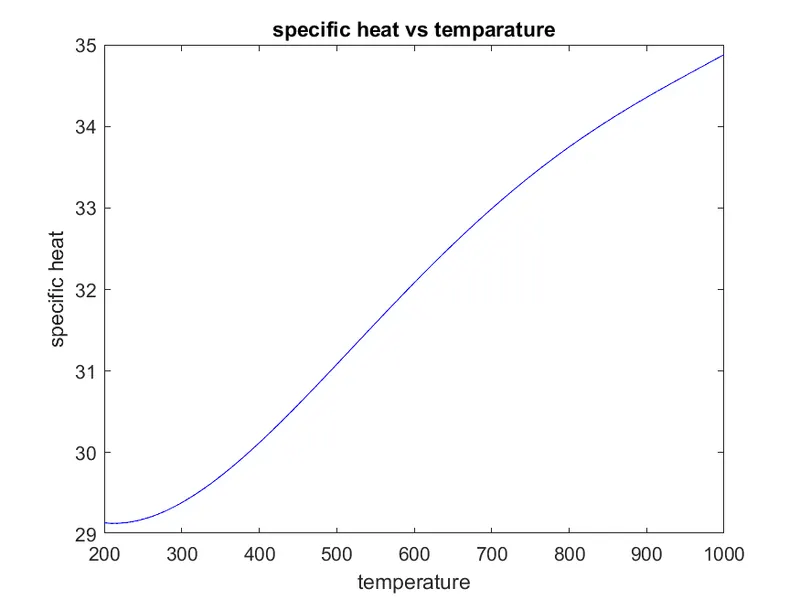
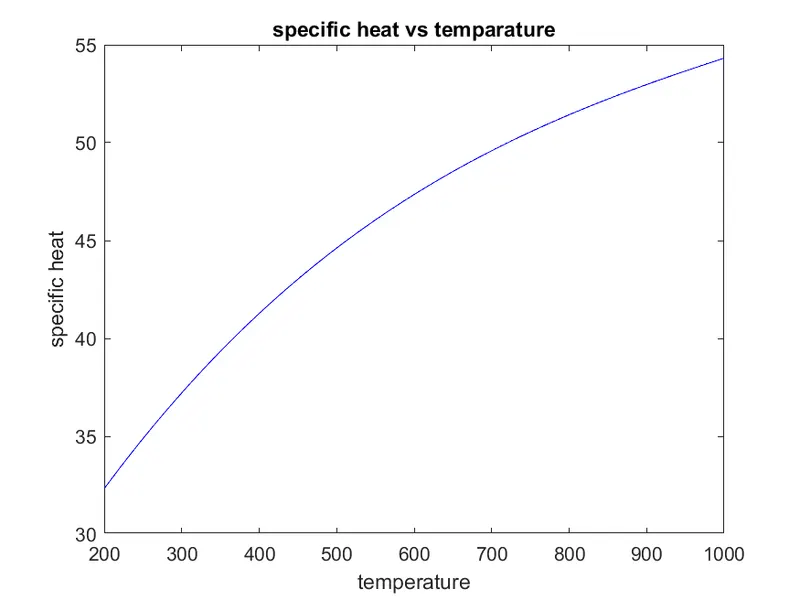
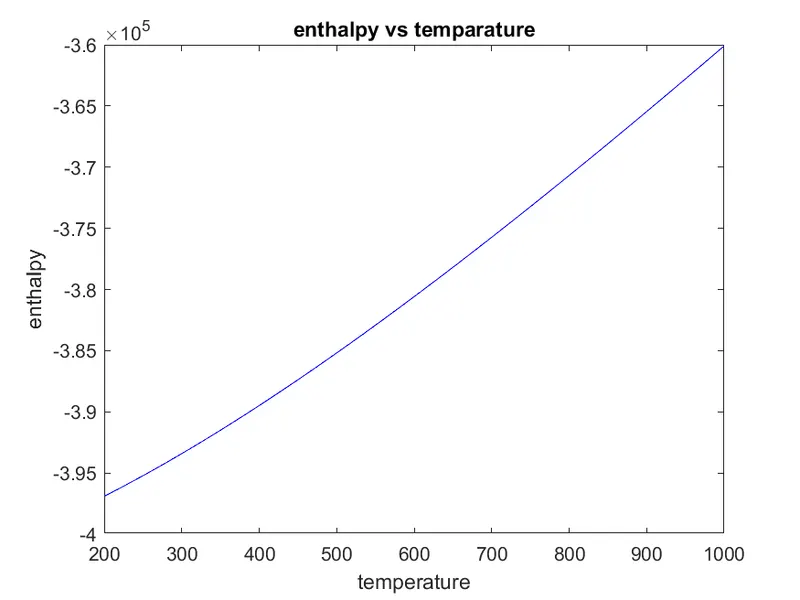
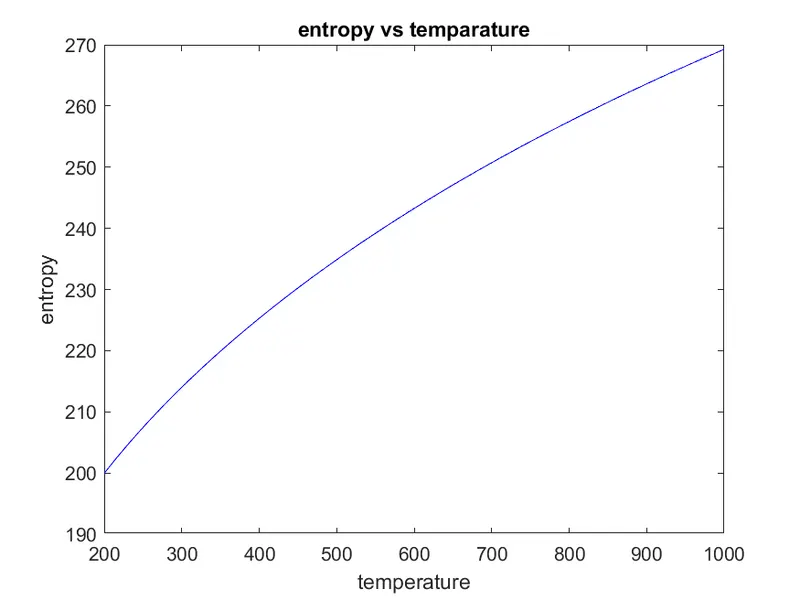
- Plots for o2,N2 and Co2 species.
THEORY:
NASA came up with polynomials that can be used to evaluate thermodynamic properties such as Cp,H and S.They have also documented the coefficients that are required to evaluate these polynomials for 1000 species.
The formula using for the calculation of specific heat(Cp),enthalpy(h),entropy(s) are as follows

- a1,a2,a3,a4,a5,a6,a7 are the coeffcients
- T is temperature in kelvin.
- R is universal gas constant.
- Cp is an specific heat
- H is an enthalpy
- S is an entropy
MATLAB CODE:
%program for file parsing
clear all
close all
clc
%getting the data file
f1=fopen('THERMO.dat','r');
skippedlines=fgetl(f1)
%reading header information
tline=fgetl(f1);
A=strsplit(tline,' ');
global_low_temp=str2num(A{2})
global_mid_temp=str2num(A{3})
global_high_temp=str2num(A{4})
%skipping next 3 lines
for i=1:3
    skippedlines=fgetl(f1);
end
%reading species
for i=1:53
    line1=fgetl(f1)
    [name,local_temp]=strtok(line1,'G')
     species_name=strtok(name)
     temp=strsplit(local_temp)
    local_low_temp=str2double(temp{2});
    local_mid_temp=str2double(temp{3});
    local_high_temp=str2double(temp{4});
T= linspace(local_low_temp,local_high_temp,800)
    tline_1=fgetl(f1);
    tline_2=fgetl(f1);
    tline_3=fgetl(f1);


    a=findstr(tline_1,'E');
    b=findstr(tline_2,'E');
    c=findstr(tline_3,'E');
%A is for high temperature coefficient
%B is for low temperature coefficient
    a1=tline_1(1:a(1)+3);
    A1=str2num(a1)

    a2=tline_1(a(1)+4:a(2)+3);
    A2=str2num(a2)

    a3=tline_1(a(2)+4:a(3)+3);
    A3=str2num(a3)

    a4=tline_1(a(3)+4:a(4)+3);
    A4=str2num(a4)

    a5=tline_1(a(4)+4:a(5)+3);
    A5=str2num(a5)

    b1=tline_2(1:b(1)+3);
    A6=str2num(b1)

    b2=tline_2(b(1)+4:b(2)+3);
    A7=str2num(b2)

    b3=tline_2(b(2)+4:b(3)+3);
    B1=str2num(b3)

    b4=tline_2(b(3)+4:b(4)+3);
    B2=str2num(b4)

    b5=tline_2(b(4)+4:b(5)+3);
    B3=str2num(b5)

    c1=tline_3(1:c(1)+3)
    B4=str2num(c1)

     c2=tline_3(c(1)+4:c(2)+3)
    B5=str2num(c2)

     c3=tline_3(c(2)+4:c(3)+3)
    B6=str2num(c3)

    c4=tline_3(c(3)+4:c(4)+3)
    B7=str2num(c4)

    %defining universal gas constant
     R=8.314;
     %calculating specific heat
     Cp=specific_heat(A1,A2,A3,A4,A5,B1,B2,B3,B4,B5,R,T,local_mid_temp)

  %calculating enthalpy
     H=enthalpy(A1,A2,A3,A4,A5,A6,B1,B2,B3,B4,B5,B6,R,T,local_mid_temp)
%calculating entropy
     S=entropy(A1,A2,A3,A4,A5,A7,B1,B2,B3,B4,B5,B7,R,T,local_mid_temp)

 %molecular weight calculation
  atoms=['H','C','O','N','R','S'];
  atomic_weight=[1 12 16 14 40 32];
  MW=0;
  for i=1:length(species_name)
      for j=1:length(atoms)

          if strcmp(species_name(i),atoms(j))
              MW=MW+atomic_weight(j);
              dt=j;
          end
      end
      n = str2double(species_name(i))
      if n>1
          MW=MW+(atomic_weight(dt).*(n-1));
      end
  end
  fprintf('molecular weight of %s:%f',species_name,MW)
  disp(' ')
  mkdir(species_name)
  cd(species_name)
   figure(1)
plot(T,Cp,'Color','b')
title('specific heat vs temparature')
xlabel('temperature')
ylabel('specific heat')
saveas(gcf,'temperature vs specific heat.png')


figure(2)
plot(T,H,'Color','b');
title('enthalpy vs temparature')
xlabel('temperature')
ylabel('enthalpy')
saveas(gcf,'temperature vs enthalpy.png')

figure(3)
plot(T,S,'Color','b')
title('entropy vs temparature')
xlabel('temperature')
ylabel('entropy')
saveas(gcf,'temperature vs entropy.png')
cd(pwd)
cd ..
end
EXPLANATION FOR THE MATLAB CODE:
- In the program we read the (THERMO.dat) and then leave the first line,then we take the global temperature varients.
- fgetl command is used to get the file from the input data.
- strsplit command is used to split the lines in the species data.
- Then the next three lines are irrelevent so we skipped three lines,then local temperature variants are taken.
- we have taken all the species in for loop i:53 and the local temperature values are taken.
- The species first line contains the species name and local temperatures and next three lines contains the coefficients.
- a,b and c values are get from the findstr command.
- 'A' coefficients as the above local_mid_temp.
- 'B' coefficients as the below local_mid_temp.
- To calculate the specific heat,enthalpy and entropy we have the call the function of specific heat,enthalpy,and entropy.
- The input values are taken for the atoms,atomic weight and the molecular weight.
- for loop is used for the iteration,if condition is used to satisfy the condition and then calculate the value for the molecular weight.
- To assign the high and low temperature coefficients each and every local temperature is compared with local mid temperature.
- The values of molecular weight get to be printed using fprintf command.
- 'mkdir' command is used to create the folder to save the values of the different species.
- using the given formula we have calculated the values of specific heat,enthalpy and entropy.
- for plotting we need a set of temprature hence the local species temperature are splitted into 800 points by using 'linspace' command
- x labels and y labels are used for the plotting the values of (temperature vs specific heat),(temperature vs enthalpy) and (temperature vs entropy).
- for saving the the plots 'cd' command is used.
- saveas command is used to save the figure image of specific heat,enthalpy and entropy.
- To close the file 'fclose' command is used.
ERROR I GOT:
1.)
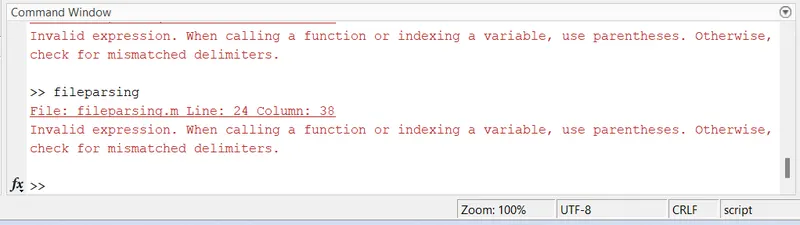
In this line i have missed an parenthesis to end the function,i have corrected this error by putting bracket.
2.)
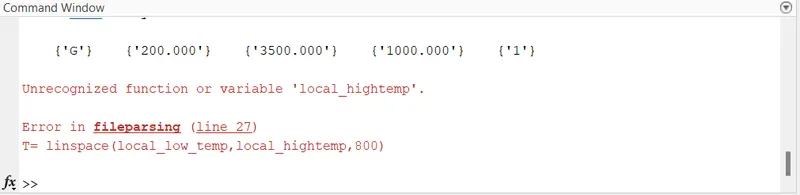
In this error i have (_)symbol between the high and the temp then i corrected the mistakes by local_high_temp
3.)
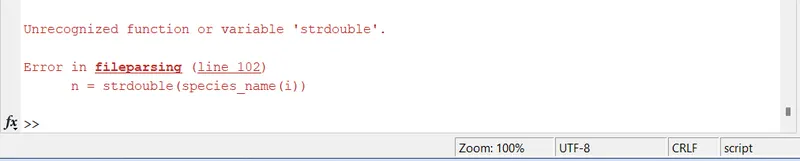
In this line i have typed this as strdouble and then corrected by typing as str2double.
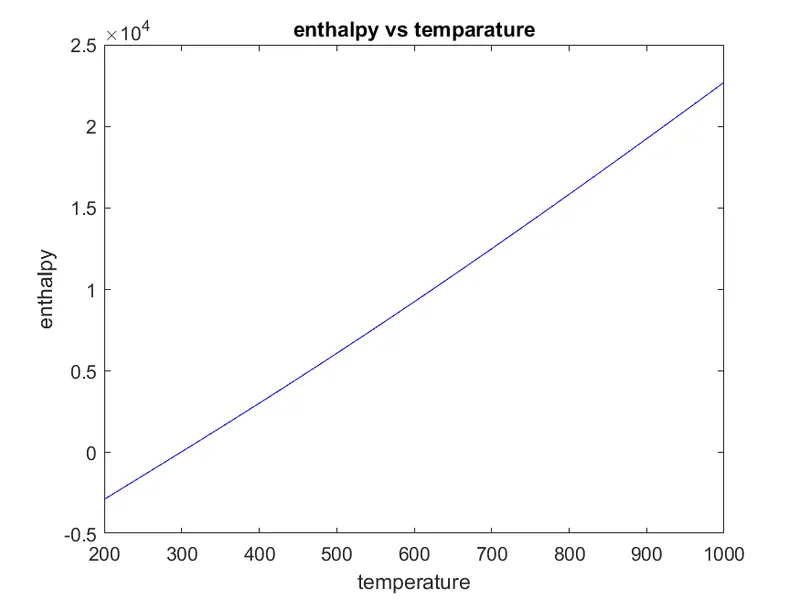
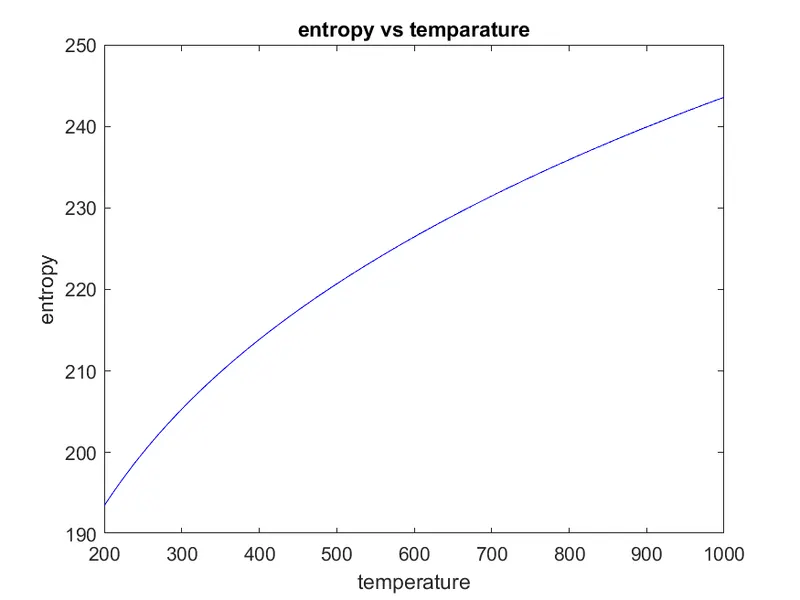
PLOTS FOR O2:
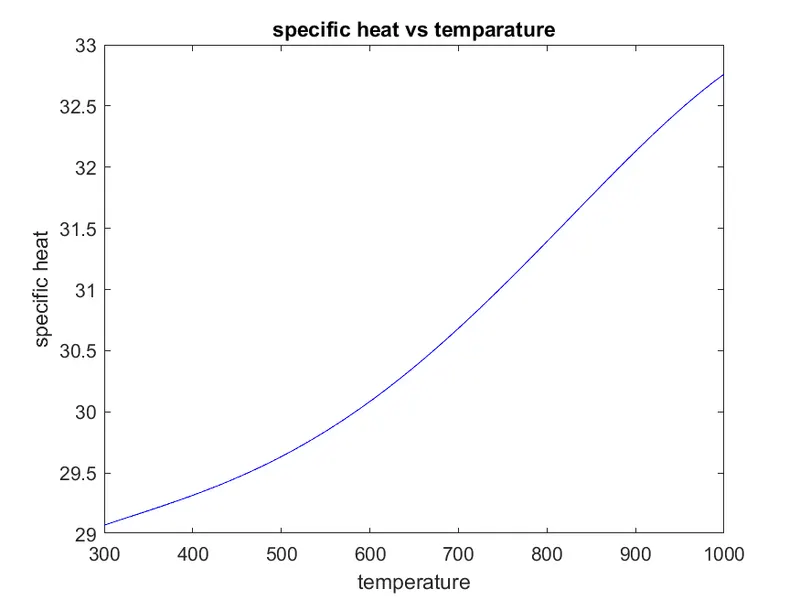
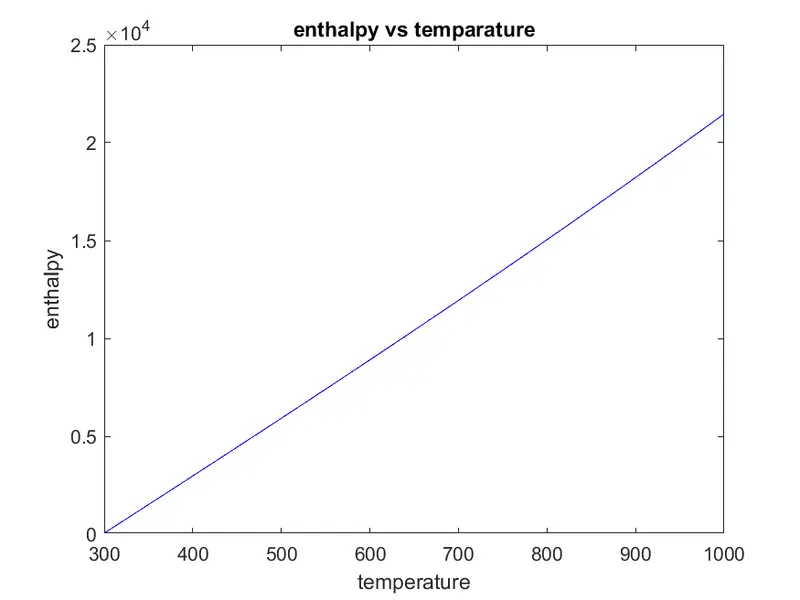
PLOTS FOR N2:
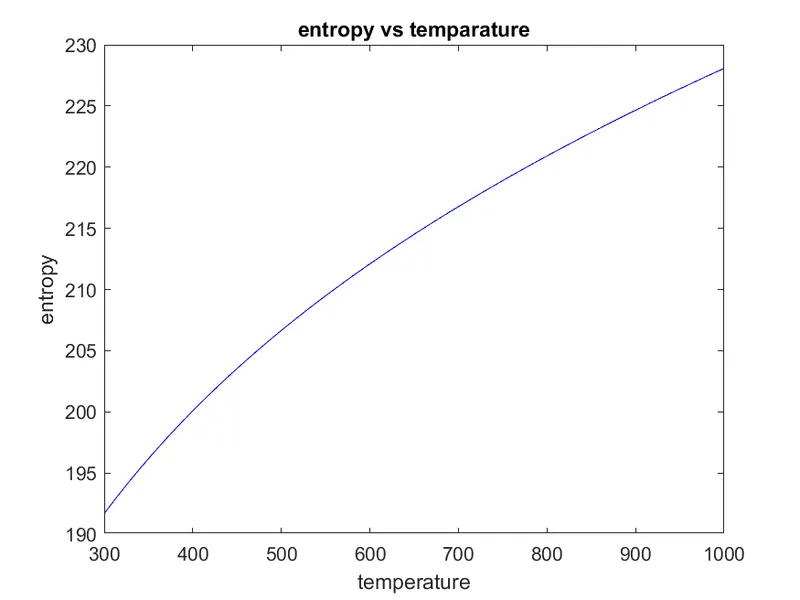
PLOTS FOR CO2:
RESULTS:
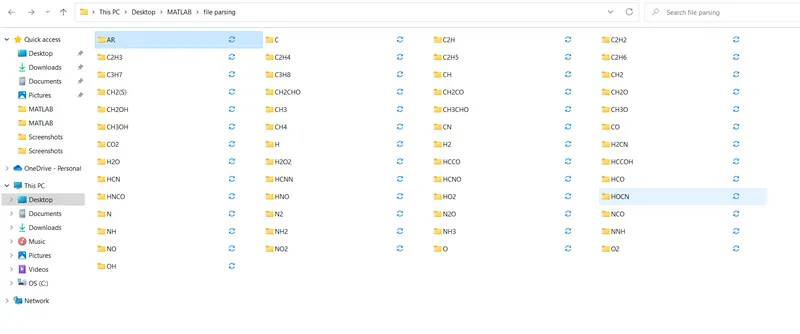
Hence we have parsed the NASA thermodynamic file. calculated the values of molecular weight for each species.The plots for the O2,N2,and CO2 are done and shown.the screenshot of the various species are saved in desktop and folders are created.
REFERENCES: