Project 1 - Parsing NASA thermodynamic data
Aim: To write a function that extracts the 14 co-efficients, calculates and plots the enthalpy, entropy and specific heats for all the species in the data file and also displays the molecular weight of the species.
Introduction:
Parsing is the process of converting formatted text into a data structure. A data structure type can be any suitable representation of the information engraved in the source text. Parsing a file means reading in a data stredam of some sort and building an in memory model of the semantic content of that data. This aims at facilitating perfoming some kind of transformation on the data.
Parser analyses the source text against the defined format.
- If source text does not match against format, errors are thrown or returned.
- If matches, then “data structure” is returned.
Types of Parsers: Top Down & Bottom Down
Procedure:
- To read the data from the THERMO.dat file by opening it and settting to it read.
- Extract the coefficients line by line.
- To create functions of specific heat, enthalpy and entropy as given in the challenge.
- Above step can be done by using a for loop i.e. for 1:53 for all the species
- Creating a directory named SPECIESNAME and saving all the plots generated into the particular species folder.
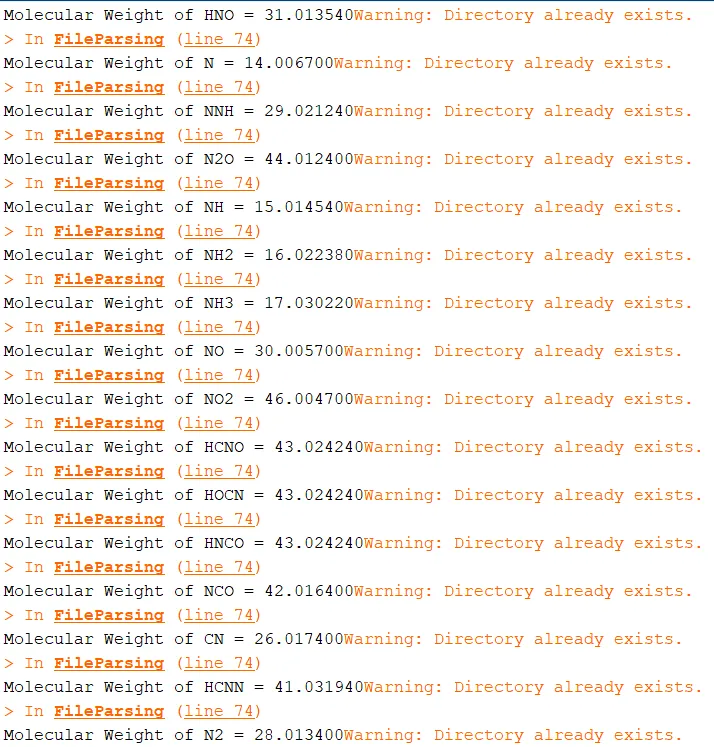
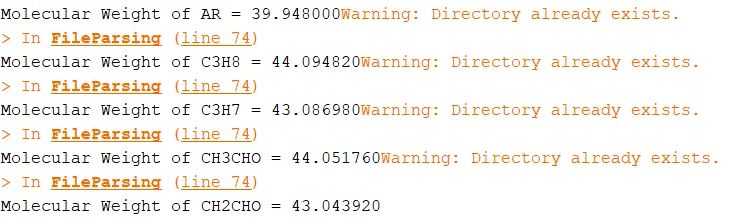
- Now, creating a fucntion for molecular weight to display the values.
- Close the Data file.
CODE:
MAIN PROGRAM:
%Important commands
clear all
close all
clc

%Let us first open the given data and read the file.
f1 = fopen('thermo.dat','r');

%The following below is used to display the first five lines
for i = 1:5
a = fgetl(f1);
end

%Code below is used to create the plots and display molecular weight of the
%species given in the data file.
for i = 1:53 %since there are 53 total elements
header = fgetl(f1); %Getting the first line of thhe data file
a = strsplit(header,' '); %Splitting the header
speciesname = a{1}; %The first portion of the header is the name of the species
species = speciesname;

llt = str2double(a{end-3}); %Local low temperature
lmt = str2double(a{end-1}); %Local medium temperature
lht = str2double(a{end-2}); %Local high temperature

T = linspace(llt,lht,500);  %Creating 500 equal intervals between glt and ght
R = 8.3145; %Universal Gas Constant in J/mol-K

line1 = fgetl(f1); %getting the fisrt line of species
e1 = strfind(line1,'E'); %To find the position of E
%After finding the position of E, getting the values of coefficients.
a1 = str2double(line1(1:e1(1)+3)); %a1 is (from 1st position to the posiiton of E) +3
a2 = str2double(line1(e1(1)+4:e1(2)+3));
a3 = str2double(line1(e1(2)+4:e1(3)+3));
a4 = str2double(line1(e1(3)+4:e1(4)+3));
a5 = str2double(line1(e1(4)+4:e1(5)+3));

line2 = fgetl(f1); %Getting the second line of the species
e2 = strfind(line2,'E');
a6 = str2double(line2(1:e2(1)+3));
a7 = str2double(line2(e2(1)+4:e2(2)+3));
a8 = str2double(line2(e2(2)+4:e2(3)+3));
a9 = str2double(line2(e2(3)+4:e2(4)+3));
a10 = str2double(line2(e2(4)+4:e2(5)+3));

line3 = fgetl(f1); %Getting the second line of the species
e3 = strfind(line3,'E');
a11 = str2double(line3(1:e3(1)+3));
a12 = str2double(line3(e3(1)+4:e3(2)+3));
a13 = str2double(line3(e3(2)+4:e3(3)+3));
a14 = str2double(line3(e3(3)+4:e3(4)+3));

Cp = specific_heat(a1,a2,a3,a4,a5,a8,a9,a10,a11,a12,T,lmt,R); %Function for specific heat
figure(1)
plot(T,Cp,'linewidth',2,'color','r'); %Plotting Temperature vs Cp
title(speciesname,'Specific Heat vs Temperature'); %Creating a title
xlabel('Temperature'); %Naming X Axis
ylabel('Specific Heat'); %Naming Y Axis

H = enthalpy(a1,a2,a3,a4,a5,a6,a8,a9,a10,a11,a12,a13,T,lmt,R);  %Function for Enthalpy
figure(2)
plot(T,H,'linewidth',2,'color','b');
title(speciesname,'Enthalpy vs Temperature');
xlabel('Temperature');
ylabel('Enthalpy');

S = entropy(a1,a2,a3,a4,a5,a7,a8,a9,a10,a11,a12,a14,T,lmt,R);  %Function for Entropy
figure(3)
plot(T,S,'linewidth',2,'color','g');
title(speciesname,'Entropy vs Temperature');
xlabel('Temperature');
ylabel('Entropy');

mkdir(speciesname); % creating a directory for each species
cd(speciesname); %Entering into the directory

%Saving all three figures created above into their own directory
saveas(1,'SpecificHeat.jpg');
saveas(2,'Enthalpy.jpg');
saveas(3,'Entropy.jpg');
cd .. %exiting the created directory

MW = molecular_weight(species); %To display the molecular weights of the given species

end

fclose(f1) %Closing the opened data file
FUNCTIONS for Specific Heat, Enthalpy, Entropy and Molecular Weight:
Specific Heat
%Creating a function for specific heat to calculate the value.
function [Cp] = specific_heat(a1,a2,a3,a4,a5,a8,a9,a10,a11,a12,T,lmt,R) %listing all the variables present in the formulae.
if (T < lmt) %If Temperature is less than local medium temperature above is executed else the below.
    Cp = (a8 + a9*T + a10*T.^2 + a11*T.^3 + a12*T.^4 )*R;
else
    Cp = (a1 + a2*T + a3*T.^2 + a4*T.^3 + a5*T.^4 )*R;
end
end
Enthalpy
%Creating a function for enthalpy to calculate the value.
function [H] = enthalpy(a1,a2,a3,a4,a5,a6,a8,a9,a10,a11,a12,a13,T,lmt,R);
if (T < lmt)
    H = R*T.*(a8 + ((a9*T)/2) + ((a10*T.^2)/3) + ((a11*T.^3)/4) + ((a12*T.^4)/5) + (a13./T));
else
    H = R*T.*(a1 + ((a2*T)/2) + ((a3*T.^2)/3) + ((a4*T.^3)/4) + ((a5*T.^4)/5) + (a6./T));
end
end
Entropy
%Creating a function for entropy to calculate the value.
function [S] = entropy(a1,a2,a3,a4,a5,a7,a8,a9,a10,a11,a12,a14,T,lmt,R);

if (T < lmt)
    S = R*(a8*log(T) + ((a9*T)) + ((a10*T.^2)/2) + ((a11*T.^3)/3) + ((a12*T.^4)/4) + a14);
else
    S = R*(a1*log(T) + ((a2*T)) + ((a3*(T).^2)/2) + ((a4*(T).^3)/3) + ((a5*(T).^4)/4) + a7);
end
end
Molecular Weight
%Creating a function to calculate the molecular weights of the species.
function MW = molecular_weight(species)

    atomic_names = ['H', 'C' , 'O' , 'N' , 'Ar']; %Atomic names present in the data sheet.
    atomic_weights = [1.00784, 12.0107, 15.999, 14.0067, 39.948]; %Atomic weights wrt their names.
    MW = 0; %Initial value of MolecularWeight = 0

        for i = 1:length(species) %1 to total number of species
            for j = 1:length(atomic_names) %total length of atomic names
                if species(i) == atomic_names(j) %to check if the atomic name matches with species from data sheet
                   MW = MW + atomic_weights(j);
                   position = j;
                end
            end
            n = str2double(species(i)); %Extracting the number present in the species name
                if n >= 1
                   MW = MW + atomic_weights(position) * (n-1); %adding the weight of the species
                end
        end
fprintf('Molecular Weight of %s = %f',species,MW) %To display the molecular weights

end
OUTPUT Obtained:
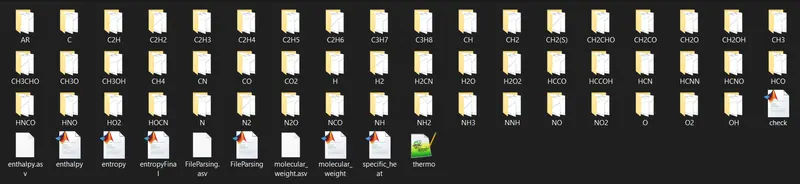
1. Below is the folder created for each and every species.
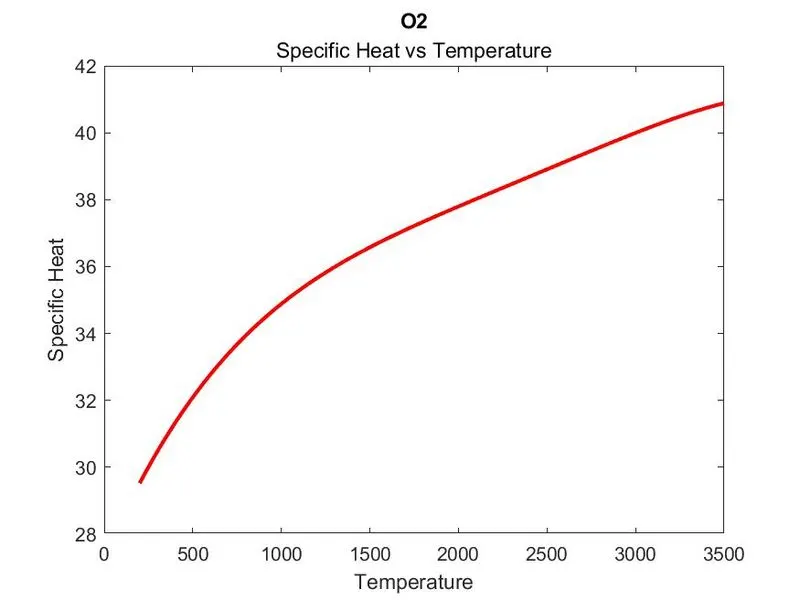
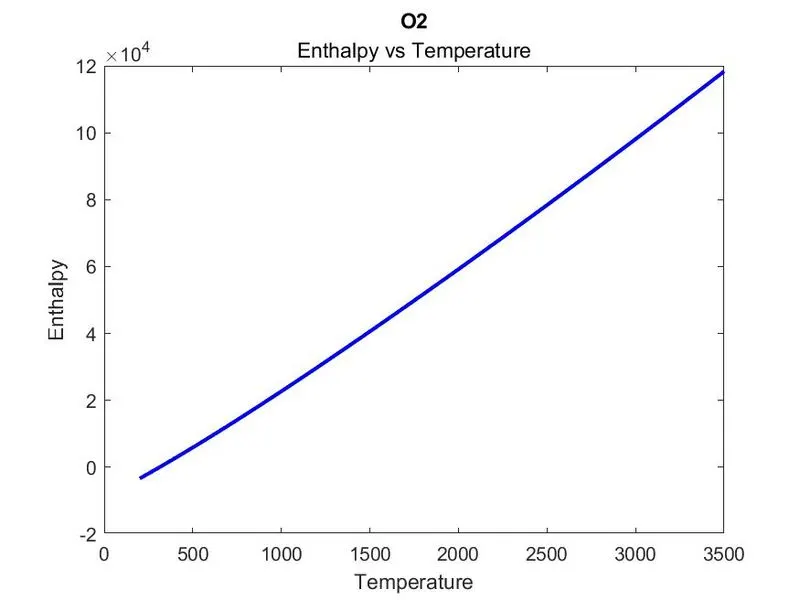
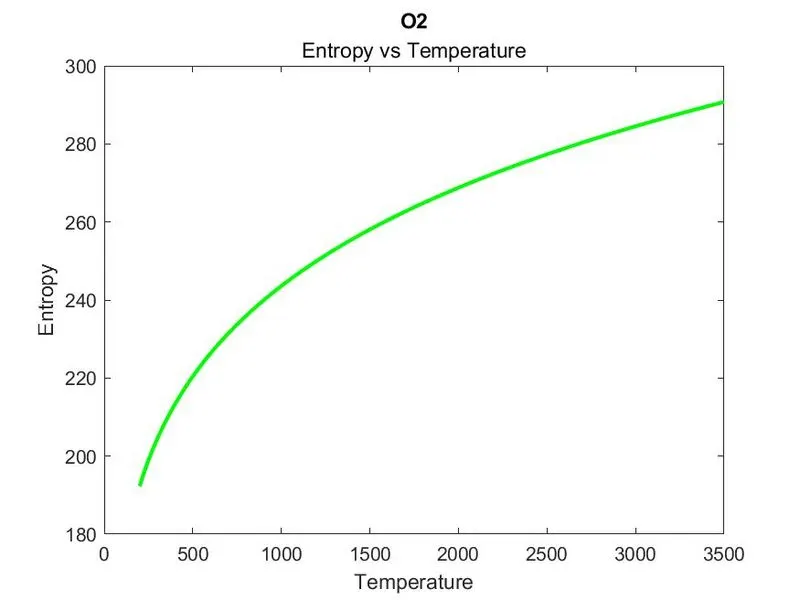
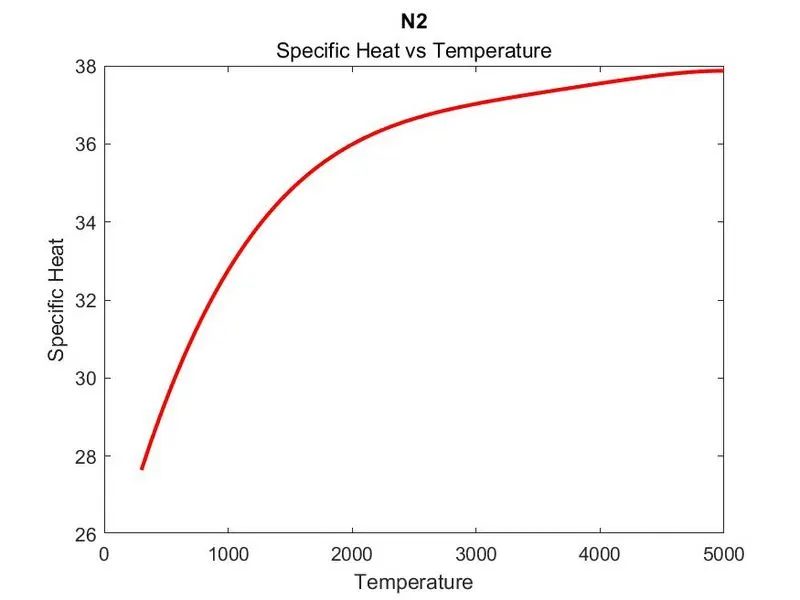
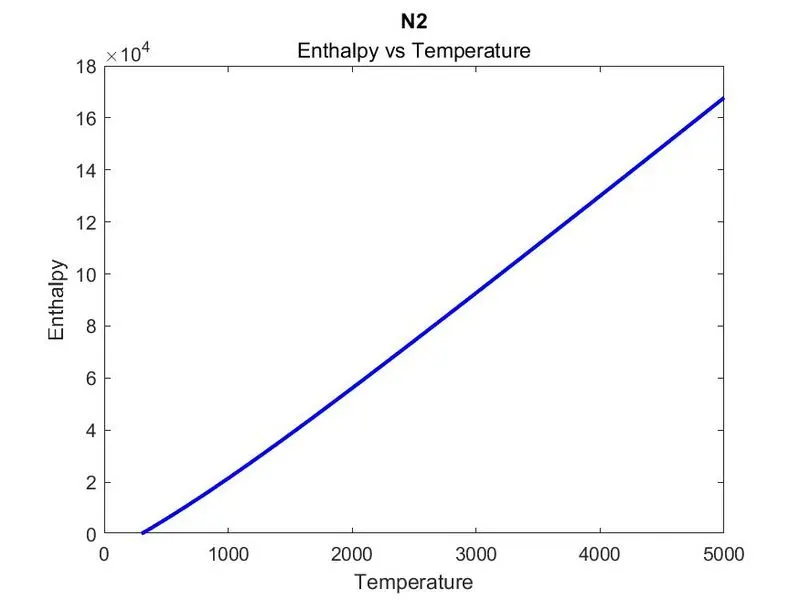
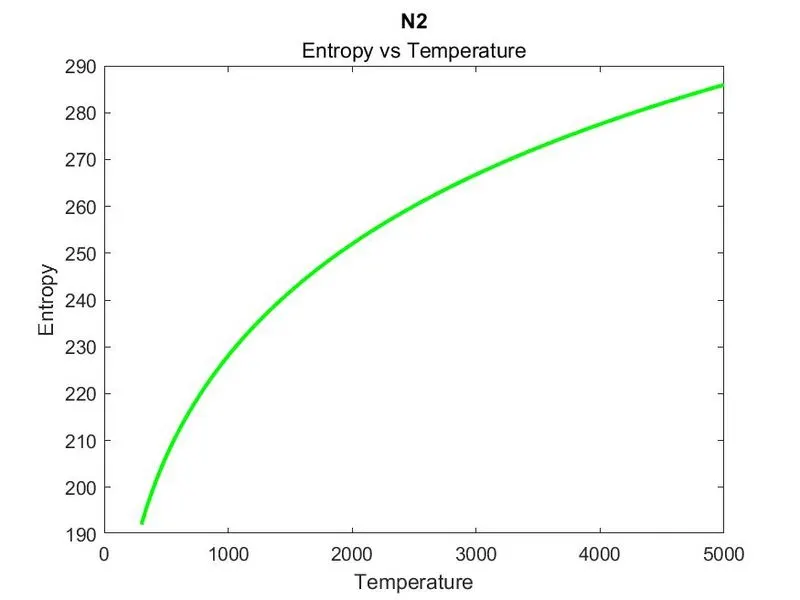
2. Results of O2, N2, CO2:
OXYGEN:
NITROGEN:
CARBON DIOXIDE:
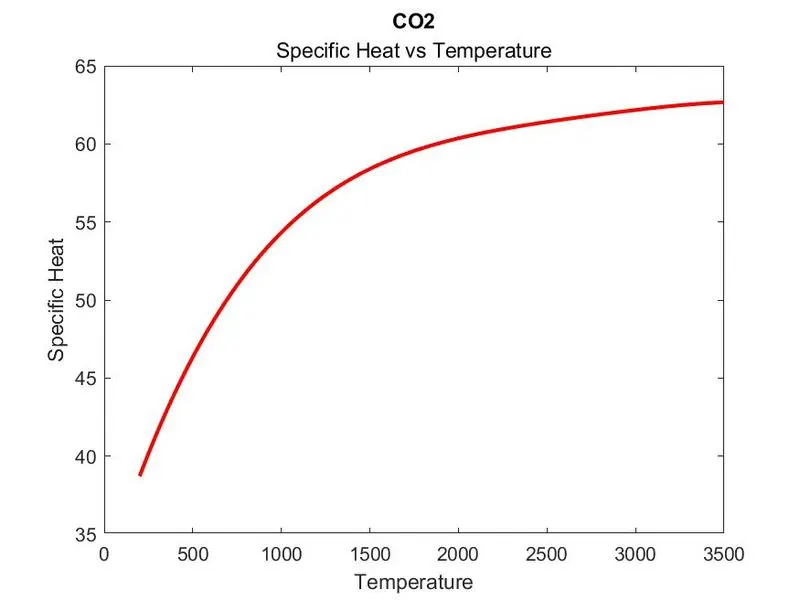
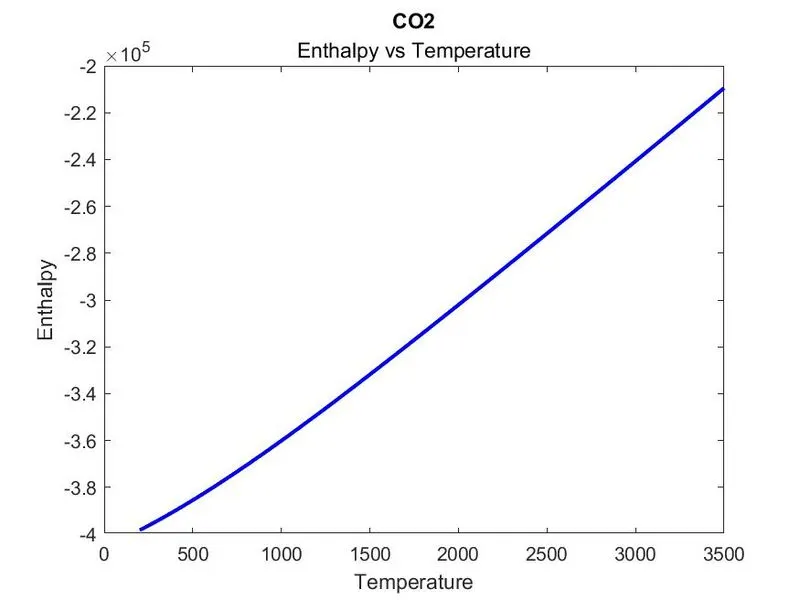
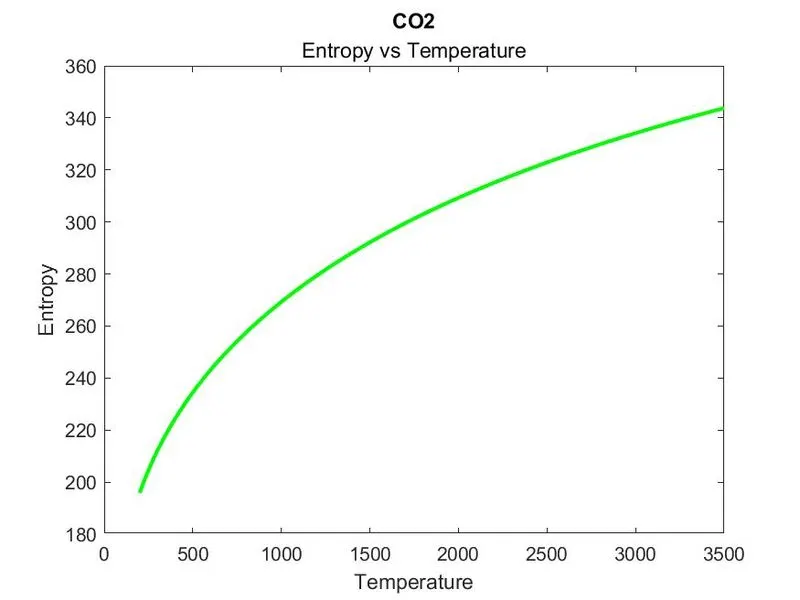
Molecular Weights of all species:
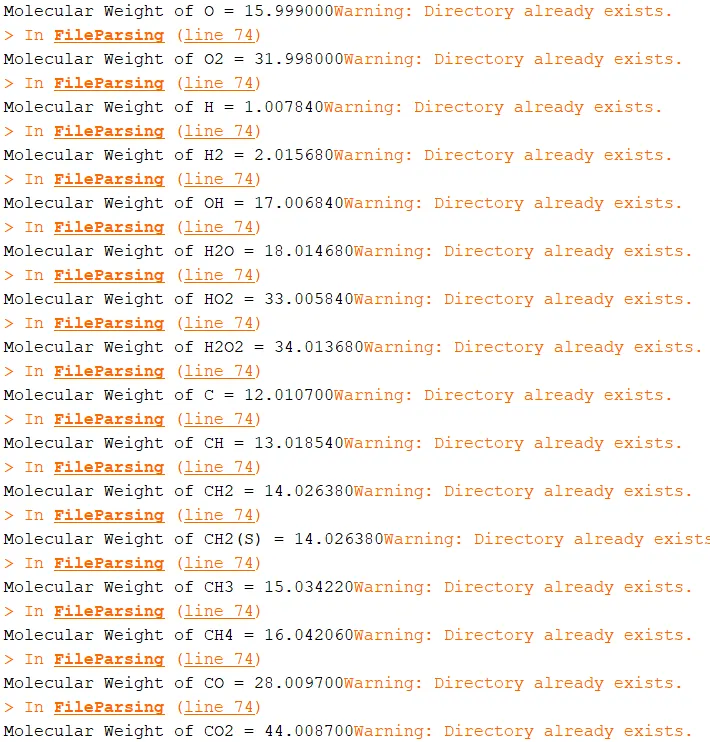
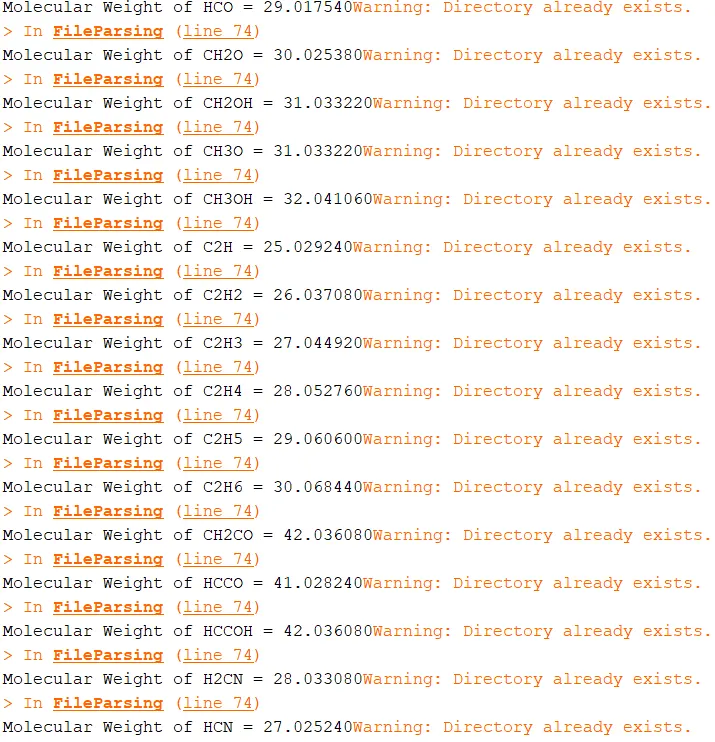
CONCLUSION: Hence, we have successfully studied file parsing and obtained the outputs as given in the challenge.
References: Mathworks, Wikipedia, TheMightyProgrammer