Project 1 - Parsing NASA thermodynamic data
Objective :
- To write a function to extract 14 co-efficients & calculate the entropy,enthalpy,specific heat & molecular weight of all respective species in the data file.
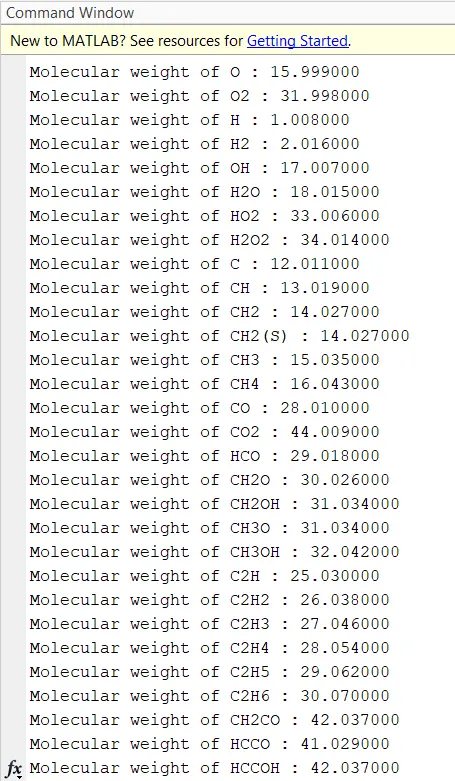
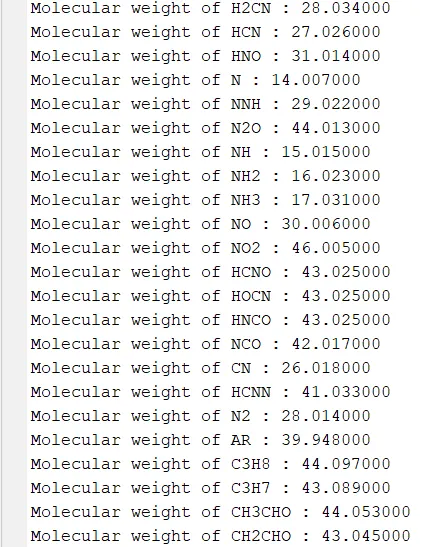
- Calculate the molecular weight of each species and display it in the command window.
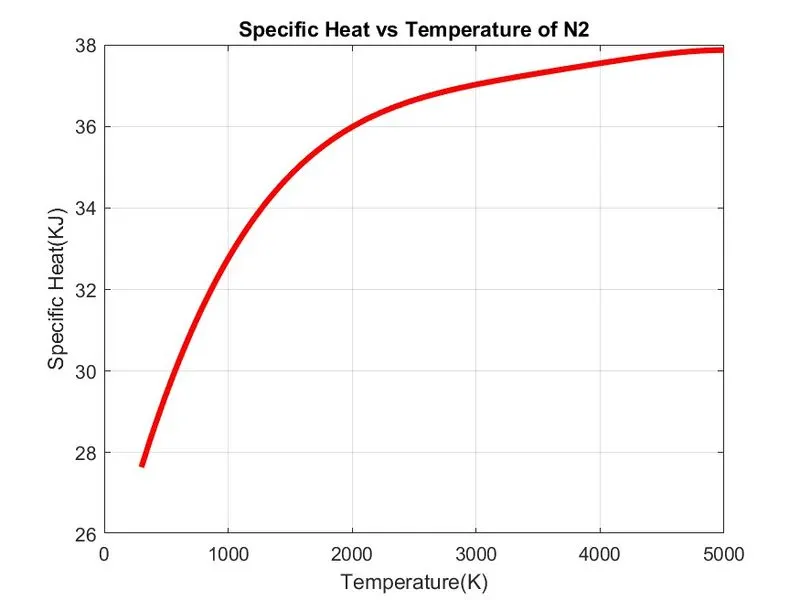
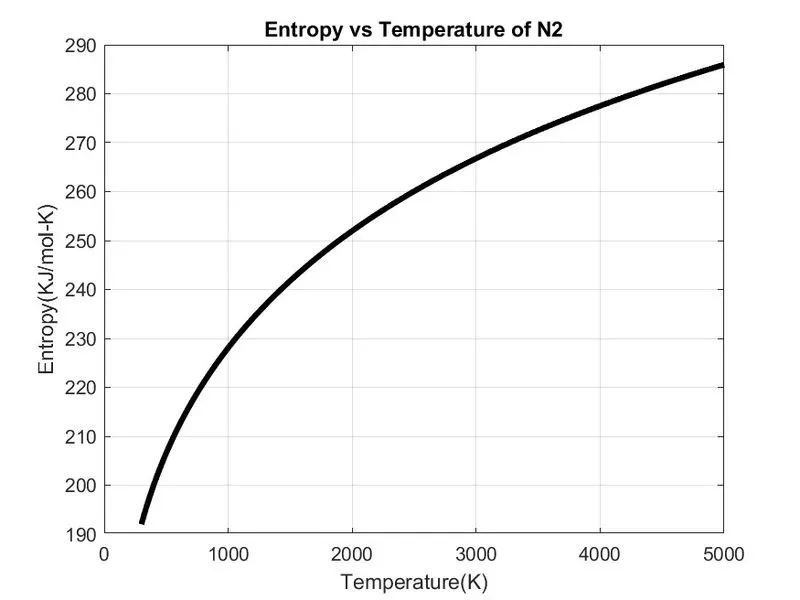
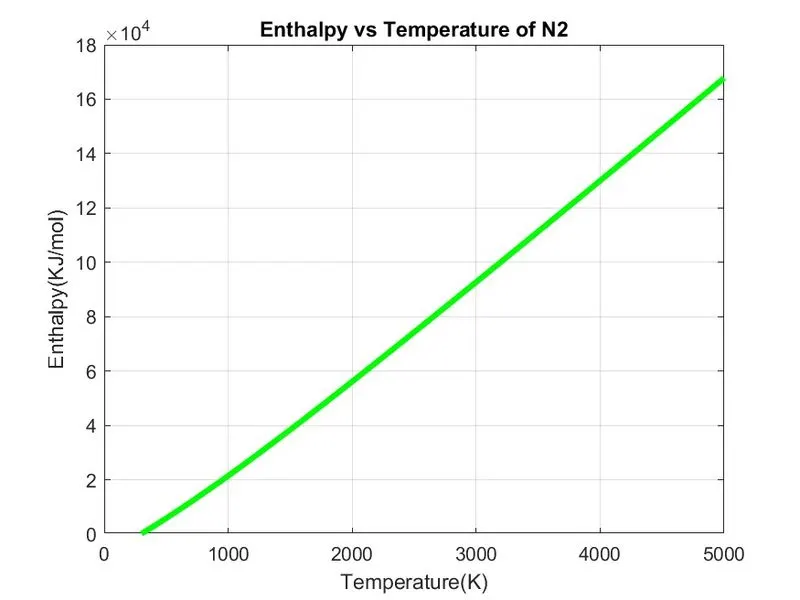
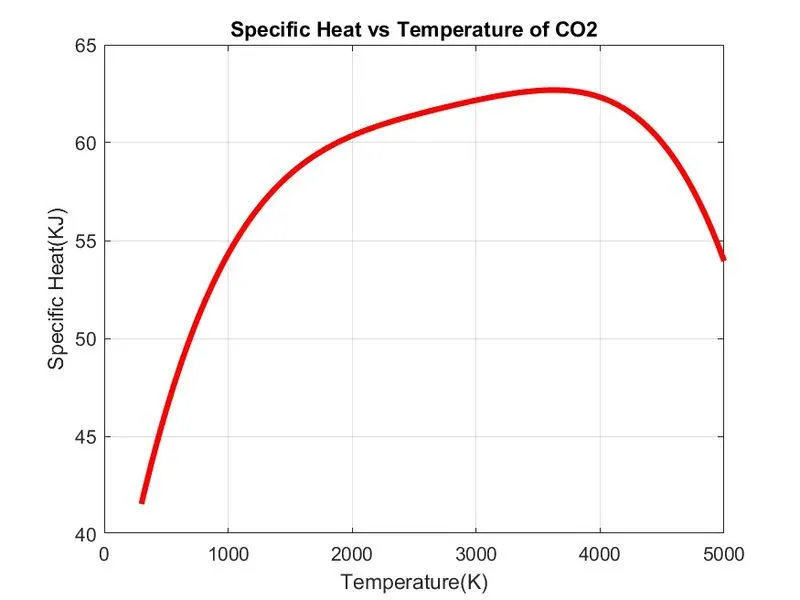
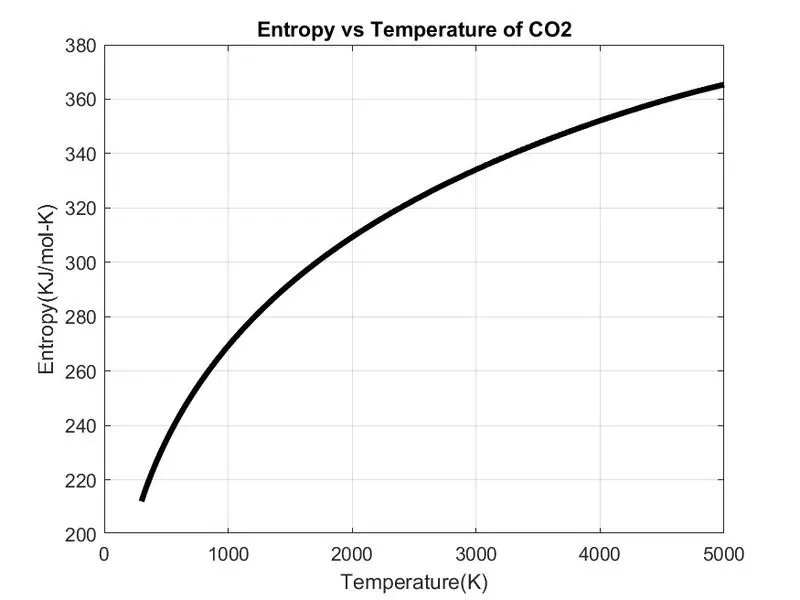
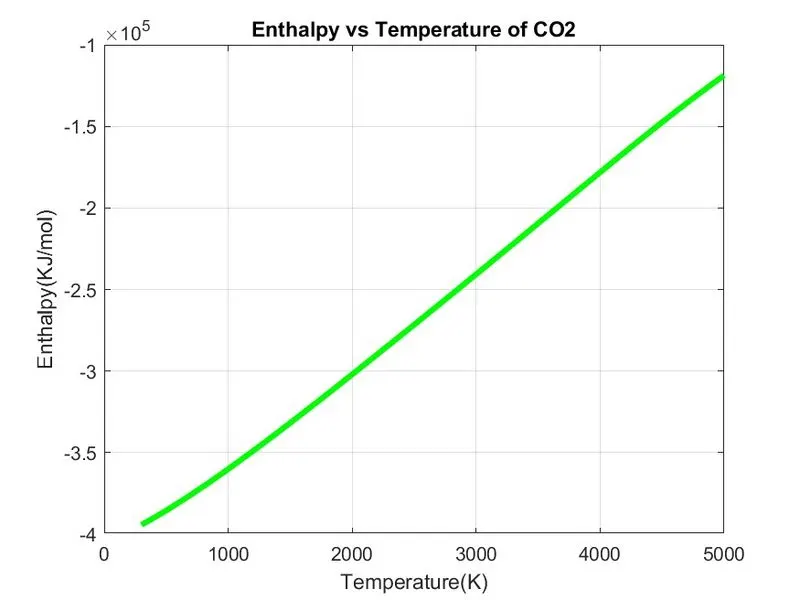
- Plot Cp,enthalpy & entropy for local temperature range specific for each species.
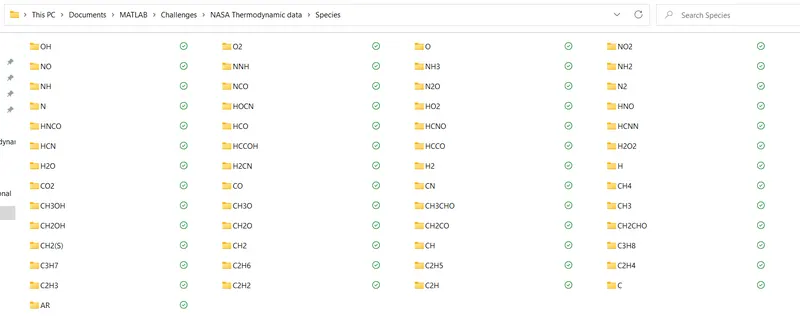
- Save the plot as images with appropriate names and dump them in separate folders for each species with suitable name.
Introduction :
Data parsing is the process of taking data in one format and transforming it to another format. The parsing helps the programmer to automatically extract data instead of manual entry from a different source & obtain the output without any mistyped value error.
Equations :
The formulas used to calculate the Specific Heat,Enthalpy & Entropy as are follows;

Where,
Cp=specific heat
R=gas constant
T=temperature
S=entropy
H=enthalpy
a=co-efficients
The following codes are used to obtain the Specific Heat, Entropy, Enthalpy & Molecular Weight values with the required output graphs. Also, the folder containing the graphs of different species are automatically generated.
Nasa_data_thermodynamics.m;

clear all %1%
close all
clc

R=8.314;

f1=fopen('THERMO.dat','r'); %2%
line=fgetl(f1);

temperature=fgetl(f1); %3%
tline=strsplit(temperature,' ');
low_temperature=str2num(tline{2});
mid_temperature=str2num(tline{3});
high_temperature=str2num(tline{4});
temp=linspace(low_temperature,high_temperature,1000);

for i=1:3 %4%
    x=fgetl(f1);
end

for j=1:53 %5%
    species_name=fgetl(f1);
    A=strsplit(species_name,' ');
    species=A{1};

    tline1=fgetl(f1); %6%
    a=strfind(tline1,'E');
    a1=tline1(1:a(1)+3);
    a1=str2num(a1);
    a2=tline1(a(1)+4:a(2)+3);
    a2=str2num(a2);
    a3=tline1(a(2)+4:a(3)+3);
    a3=str2num(a3);
    a4=tline1(a(3)+4:a(4)+3);
    a4=str2num(a4);
    a5=tline1(a(4)+4:a(5)+3);
    a5=str2num(a5);

    tline2=fgetl(f1); %7%
    b=strfind(tline2,'E');
    a6=tline2(1:b(1)+3);
    a6=str2num(a6);
    a7=tline2(b(1)+4:b(2)+3);
    a7=str2num(a7);
    a8=tline2(b(2)+4:b(3)+3);
    a8=str2num(a8);
    a9=tline2(b(3)+4:b(4)+3);
    a9=str2num(a9);
    a10=tline2(b(4)+4:b(5)+3);
    a10=str2num(a10);

   tline3=fgetl(f1); %8%
    c=strfind(tline3,'E');
    a11=tline3(1:c(1)+3);
    a11=str2num(a11);
    a12=tline3(c(1)+4:c(2)+3);
    a12=str2num(a12);
    a13=tline3(c(2)+4:c(3)+3);
    a13=str2num(a13);
    a14=tline3(c(3)+4:c(4)+3);
    a14=str2num(a14);

Cp=Specific_heat(a1,a2,a3,a4,a5,a8,a9,a10,a11,a12,temp,R,mid_temperature); %9%

S=Entropy(a1,a2,a3,a4,a5,a7,a8,a9,a10,a11,a12,a14,temp,R,mid_temperature); %10%

H=Enthalpy(a1,a2,a3,a4,a5,a6,a8,a9,a10,a11,a12,a13,temp,R,mid_temperature); %11%

W=Molecular_weight(species); %12%

cd('C:\Users\mohit\OneDrive\Documents\MATLAB\Challenges\NASA Thermodynamic data\Species') %13%
mkdir(species);
cd(species);

figure(1) %14%
plot(temp,Cp,'linewidth',3,'color','r');
xlabel('Temperature(K)');
ylabel('Specific Heat(KJ)');
title(sprintf('Specific Heat vs Temperature of %s',species));
grid on
saveas(figure(1),'Specific Heat.jpg');

figure(2) %15%
plot(temp,S,'linewidth',3,'color','k');
xlabel('Temperature(K)');
ylabel('Entropy(KJ/mol-K)');
title(sprintf('Entropy vs Temperature of %s',species));
grid on
saveas(figure(2),'Entropy.jpg');

figure(3) %16%
plot(temp,H,'linewidth',3,'color','g');
xlabel('Temperature(K)');
ylabel('Enthalpy(KJ/mol)');
title(sprintf('Enthalpy vs Temperature of %s',species));
grid on
saveas(figure(3),'Enthalpy.jpg');

cd('C:\Users\mohit\OneDrive\Documents\MATLAB\Challenges\NASA Thermodynamic data') %17%

end
Specific_heat.m;
function Cp=Specific_heat(a1,a2,a3,a4,a5,a8,a9,a10,a11,a12,temp,R,mid_temperature) %1%
T=temp; %2%
if (T <= mid_temperature) %3%
Cp=R*(a8+(a9*T)+(a10*(T).^2)+(a11*(T).^3)+(a12*(T).^4));
else
Cp=R*(a1+(a2*T)+(a3*(T).^2)+(a4*(T).^3)+(a5*(T).^4));
end
end
Entropy.m;

function S=Entropy(a1,a2,a3,a4,a5,a7,a8,a9,a10,a11,a12,a14,temp,R,mid_temperature) %1%
T=temp; %2%
if (T <= mid_temperature) %3%
    S=R*(a8.*log(T)+(a9*T)+((a10*(T).^2)/2)+((a11*(T).^3)/3)+((a12*(T).^4)/4)+a14);
else
    S=R*(a1.*log(T)+(a2*T)+((a3*(T).^2)/2)+((a4*(T).^3)/3)+((a5*(T).^4)/4)+a7);
end
end
Enthalpy.m;

function H=Enthalpy(a1,a2,a3,a4,a5,a6,a8,a9,a10,a11,a12,a13,temp,R,mid_temperature) %1%
T=temp; %2%
if (T <= mid_temperature) %3%
   H=R*T.*(a8+((a9*T)/2)+((a10*T.^2)/3)+((a11*T.^3)/4)+((a12*T.^4)/5)+(a13./T));
else
    H=R*T.*(a1+((a2*T)/2)+((a3*T.^2)/3)+((a4*T.^3)/4)+((a5*T.^4)/5)+(a6./T));
end
end
Molecular_weight.m;

function W=Molecular_weight(species) %1%
atomic_name=['H','C','O','N','Ar']; %2%
atomic_weight=[1.008 12.011 15.999 14.007 39.948]; %3%

W=0; %4%

for i=1:length(species) %5%
    for j=1:length(atomic_name)
        if strcmp(species(i),atomic_name(j)) %6%
            W=W+atomic_weight(j); %7%
            position=j;
        end
    end

        n=str2num(species(i)); %8%

        if n>1 %9%
            W=W+atomic_weight(position)*(n-1);
        end
    end
    X=fprintf('Molecular weight of %s : ',species);%10%
    Y=fprintf('%f',W);
    disp(' ');
end
Code Explanation :
Nasa_data_thermodynamics.m;
1 - First few lines are used to clear & close all the previous generated data to avoid mixing of those data with current program.
2 - These lines are used to open the data file & print first line of the file.
3 - These lines are used to the extract the temperature data as a string & convert into numbers with low,middle & high values. Also, generate local temperature array for plotting purpose.
4 - These lines are used to for loop & print the comment lines.
5 - This foor loop, this used to obtain required output values of different species. The next 3 lines are used to extract the species name string.
6 - The next few lines are used to extract the first line temperature values from the data file.
7 - The next few lines are used to extract the second line temperature values from the data file.
8 - The next few lines are used to extract the third few temperature values from the data file.
9 - This line is used to call the function to obtain the Specific heat.
10 - This line is used to call the function to obtain the Entropy.
11 - This line is used to call the function to obtain the Enthalpy.
12 - This line is used to call the function to obtain the Molecular weight.
13 - The next 3 lines are used to create a directory with folder to dump all the plots automatically.
14 - These lines are used to plot a graph of temperature vs specific heat for all species.
15 - These lines are used to plot a graph of temperature vs entropy for all species.
16 - These lines are used to plot a graph of temperature vs enthalpy for all species.
17 - This line is used to change the directory to the main folder location.
Specific_heat.m;
1 - This line is used to create a function & send the output value to the main function.
2 - This line is used to assign T with the input temperature value.
3 - The if statement is used to decide which formula has to used to obtain the output value.
Entropy.m;
1 - This line is used to create a function & send the output value to the main function.
2 - This line is used to assign T with the input temperature value.
3 - The if statement is used to decide which formula has to used to obtain the output value.
Enthalpy.m;
1 - This line is used to create a function & send the output value to the main function.
2 - This line is used to assign T with the input temperature value.
3 - The if statement is used to decide which formula has to used to obtain the output value.
Molecular_weight.m;
1 - This line is used to create a function & send the molecular weight to the main function.
2 - This line is used to declare an array of the basic atomic name.
3- This line is used to declare an array of the atomic weight of each atomic name.
4 - This line is used to declare the Molecular weight as 0.
5 - These for loops are used to input the list of species & the atomic name.
6 - This line is used to compare the atomic name with species name.
7 - The molecular weight is calculated according to the camparison.
8 - This line is used to input the variable with the number from the species name.
9 - This line is used to obtain the exact molecular weight of the species.
10 - The last few lines are used to print the Molecular weight values in the command window.
Output :
Plot of o2 :
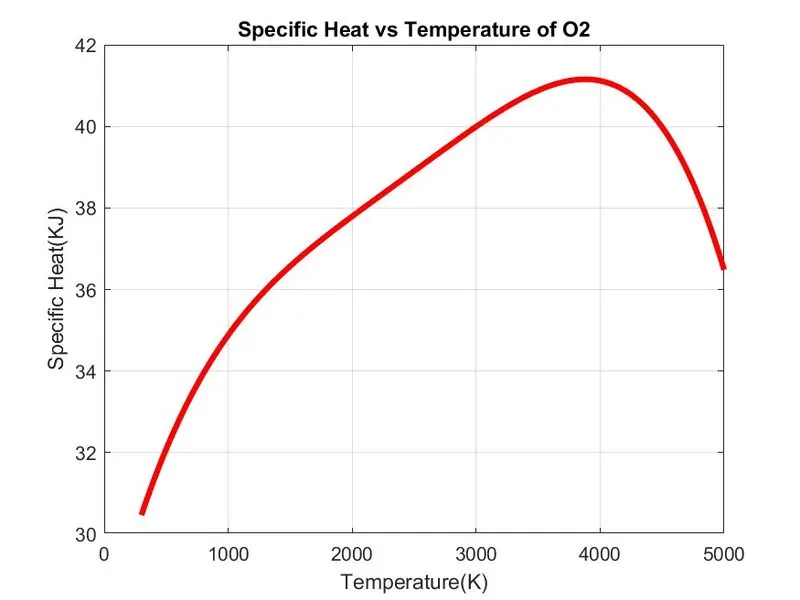
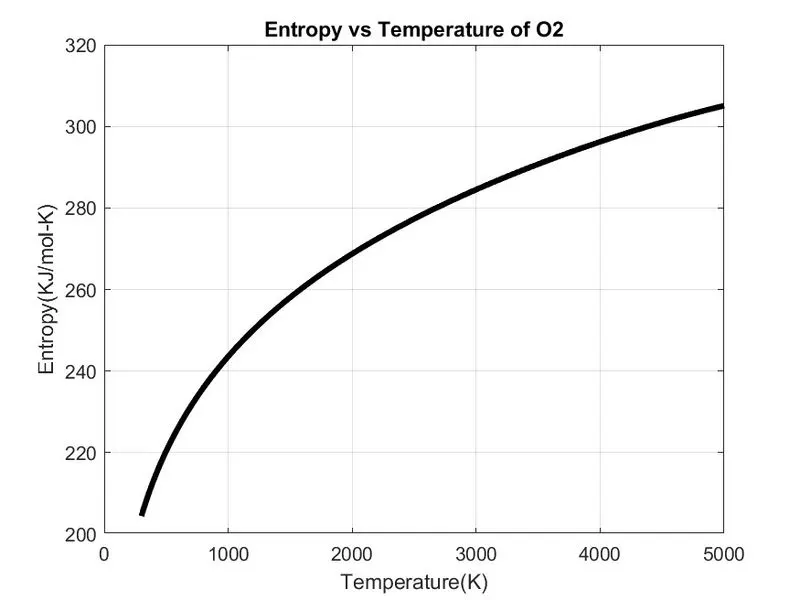
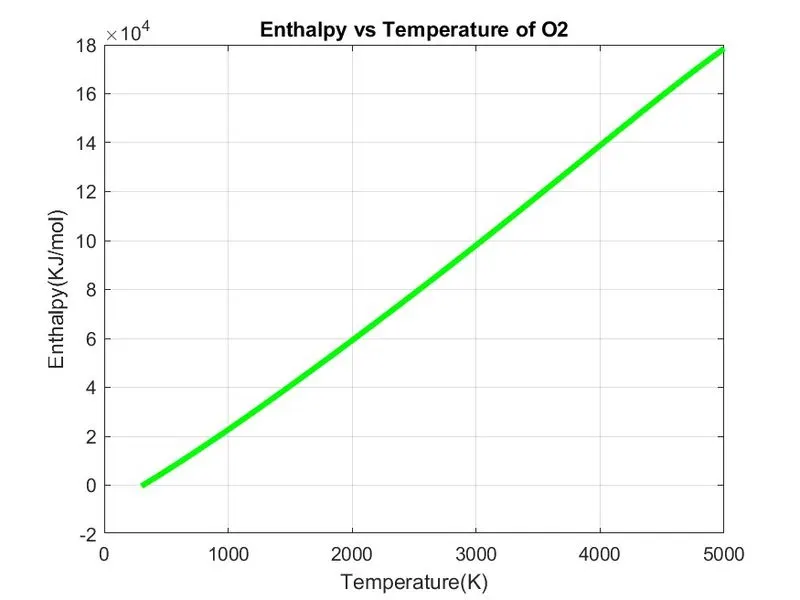
Plot of N2 :
Plot of Co2 :
Screenshot of Folder :
Molecular weight :
Errors faced during Programming :
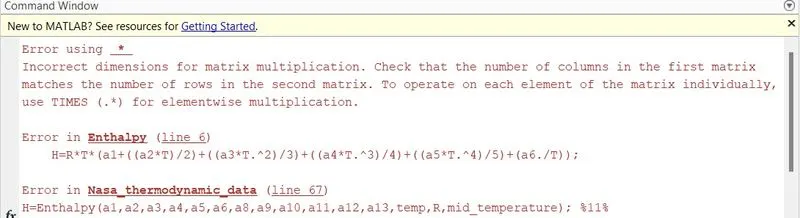
In the above image, the dot product(.*) had to be declared after H=R*T.
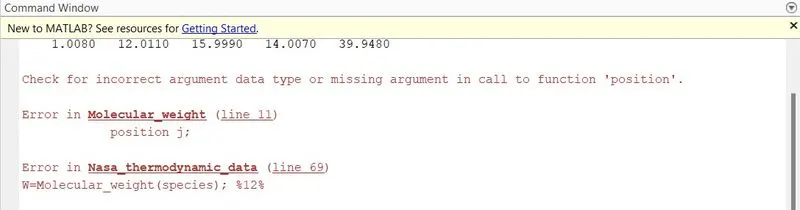
In the above image, the position had to be declared as position=j.
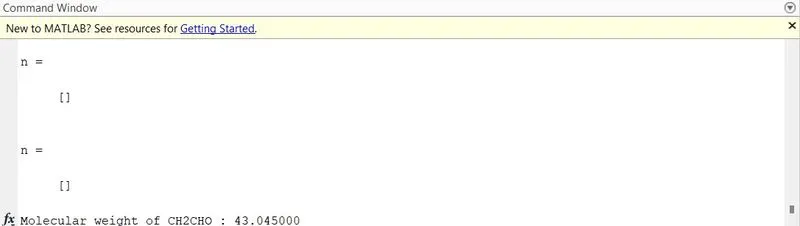
In the above image, the semi-colon was missing in the function after the n variable line.