Project 1 - Parsing NASA thermodynamic data
Procedure
- At first THERMO.DAT file is loaded using‘ fopen’ command
- ‘Fgetl’ command is used to study the document line by line
- With the help of strsplit and str2num commands maximum, medium and minimum temperature are found
- With the help of for loop and ‘Fgetl’ commands and ‘strfind’ comments, exponents number are found through which coefficient could be found
- The found coefficient is converted in the number by using str2num
- By continuing doing above procedure for two and three, fourteen coefficients for all species are found
- After that entropy, enthalpy and specific heat are calculated
- Once entropy, enthalpy and specific heat are calculated and it is plotted against temperature and stored in each folder as ‘png’ files.
- Calculating molecular weight, specific heat, enthalpy, entropy, and directory creation are given in function form.
Programme
clear all
close all
clc
file=fopen('THERMO.dat','r');
line_1=fgetl(file);%first line in the file
line2=fgetl(file);%second line in the file
A=strsplit(line2,' '); %splitting line2 with quotes
Global_max_temperature=str2num(A{4});
Global_med_temperature=str2num(A{3});
Global_low_temperature=str2num(A{2});
temperature =linspace(Global_low_temperature,Global_max_temperature,400)
T=linspace(Global_low_temperature,Global_max_temperature,400);
R=8.314;
%% skipping three lines in the loaded documents
for i=3:5
comment1=fgetl(file)
end
%% loop for finding polynomial coefficient
for i=1:53
line1=fgetl(file)
name=strtok(line1)
line2=fgetl(file)
line3=fgetl(file)
line4=fgetl(file)
A=strfind(line2,'E')
B=strfind(line3,'E')
C=strfind(line4,'E')
%order coefficient for differnt cases
a1=str2num(line2(1:A(1)+3))
a2=str2num(line2(A(1)+4:A(2)+3))
a3=str2num(line2(A(2)+4:A(3)+3))
a4=str2num(line2(A(3)+4:A(4)+3))
a5=str2num(line2(A(4)+4:A(5)+3))
a6=str2num(line3(1:B(1)+3))
a7=str2num(line3(B(1)+4:B(2)+3))
b1=str2num(line3(B(2)+4:B(3)+3))
b2=str2num(line3(B(3)+4:B(4)+3))
b3=str2num(line3(B(4)+4:B(5)+3))
b4=str2num(line4(1:C(1)+3))
b5=str2num(line4(C(1)+4:C(2)+3))
b6=str2num(line4(C(2)+4:C(3)+3))
b7=str2num(line4(C(3)+4:C(4)+3))
%% develped call function for various parameters
Cp=specific_heat(a1,a2,a3,a4,a5,b1,b2,b3,b4,b5,R,T,Global_med_temperature)
h=enthalpy(a1,a2,a3,a4,a5,a6,b1,b2,b3,b4,b5,b6,R,T,Global_med_temperature)
s=entropy(a1,a2,a3,a4,a5,a7,b1,b2,b3,b4,b5,b7,R,T,Global_med_temperature)
molecular_wt(i)=molecular_weight(name)
%% Graph plotting
plotting(Cp,h,s,T,name)
end
%% calculation of molecular_weight
function mw=molecular_weight(name)
atoms=['H','C','O','N','A'];
atomic_weight=[1 12 16 14 40]
mw=0 % iterations
for i=1:length(name)
for j=1:length(atoms)
if strcmp(name(i),atoms(j))
mw=mw+atomic_weight(j)
end
end
end
%% Calculation of specific_heat
function Cp=specific_heat(a1,a2,a3,a4,a5,b1,b2,b3,b4,b5,R,T,Global_med_temperature)
if T>Global_med_temperature
Cp=R.*(a1+a2.*T+a3.*T.^2+a4.*T.^3+a5.*T.^4);
else
Cp=R.*(b1+b2.*T+b3.*T.^2+b4.*T.^3+b5.*T.^4);
end
end
%% plotting graph and saving potted graph in the folder
function plotting(Cp,h,s,T,name)
cd(pwd)%Change directory to the current folder
dir_name=name; %Creating directory name
mkdir(dir_name)% making directory
figure(1)
plot(T,Cp,'lineWidth',2,'Color','b')
title(sprintf('Temperature vs Specific heat %s',name))
xlabel('Temperature')
ylabel('specific heat')
figure(2)
plot(T,h,'lineWidth',2,'Color','b')
title(sprintf('Temperature vs enthalpy %s',name))
xlabel('Temperature')
ylabel('enthalpy')
figure(3)
plot(T,s,'lineWidth',2,'Color','b')
title(sprintf('Temperature vs entropy %s',name))
xlabel('Temperature')
ylabel('entropy')
cd(dir_name) % change to director name
saveas(1,'Temperature vs Specific heat.png') %saving pictures in png format
saveas(2,'Temperature vs enthalpy.png') %saving pictures in png format
saveas(3,'Temperature vs entropy.png') %saving pictures in png format
cd .. %switching to other folders
end
%% Calculation of enthalpy
function h=enthalpy(a1,a2,a3,a4,a5,a6,b1,b2,b3,b4,b5,b6,R,T,Global_med_temperature)
if T>Global_med_temperature
h=R.*(a1.*T+(a2.*T.^2)./2+(a3.*T.^2)./3+(a4.*T.^4)./4+(a5.*T.^5)./5+a6);
else
h=R.*(b1.*T+(b2.*T.^2)./2+(b3.*T.^2)./3+(b4.*T.^4)./4+(b5.*T.^5)./5+b6);
end
end
%% Calculation of entropy
function s=entropy(a1,a2,a3,a4,a5,a7,b1,b2,b3,b4,b5,b7,R,T,Global_med_temperature)
if T<=Global_med_temperature
s=R.*(a1.*log(T)+a2.*T+a3.*(T.^2)./2+a4.*(T.^3)./3+a5.*(T.^4)./4+a7);
else
s=R.*(b1.*log(T)+b2.*T+b3.*(T.^2)./2+b4.*(T.^3)./3+b5.*(T.^4)./4+b7);
end
end
output
Figure 1 illustrates the complete folder species being saved at one folder and followed by temperature vs enthalpy, temperature vs entropy and temperature vs specific heat are given in Figure 2,3 and 4
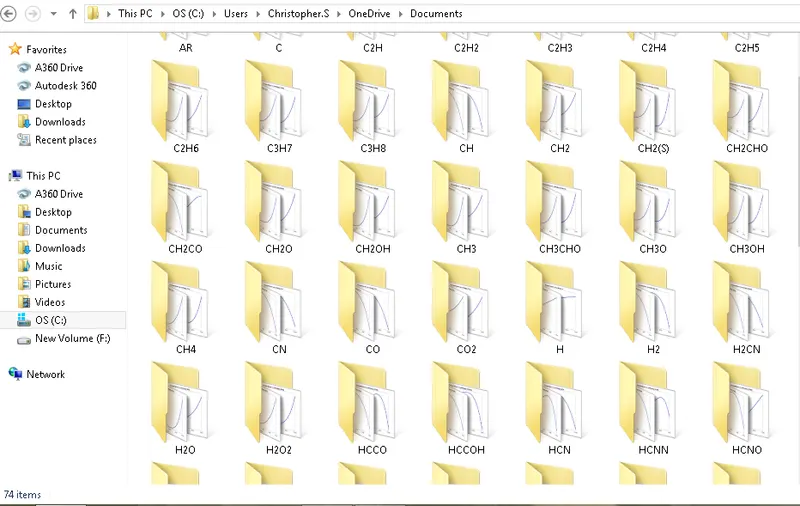
Figure 1 Saved spices in one folder
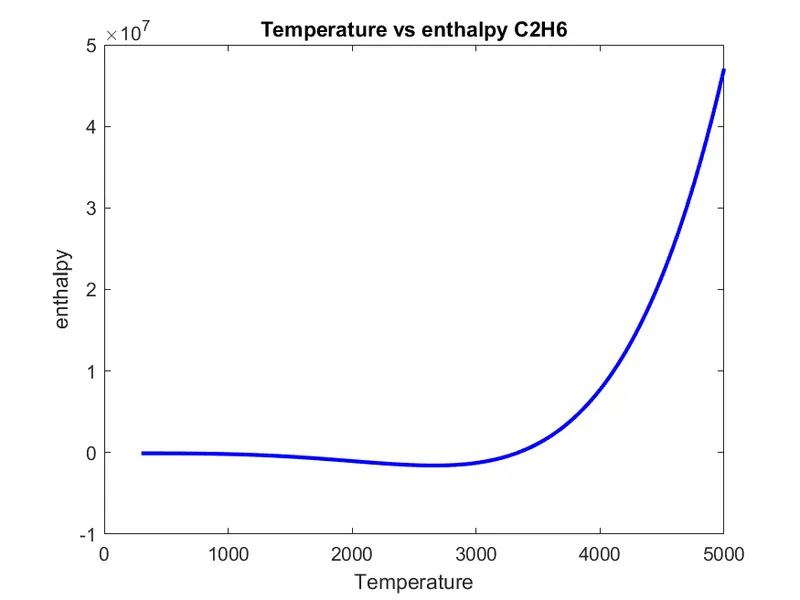
Figure 2 Temperature vs enthalpy C2H6
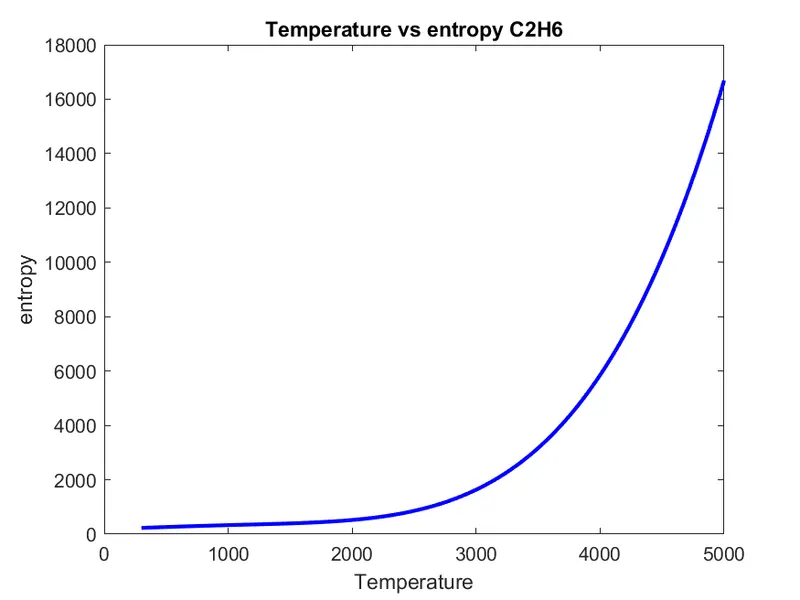
Figure 3 Entropy vs temperature for C2H6
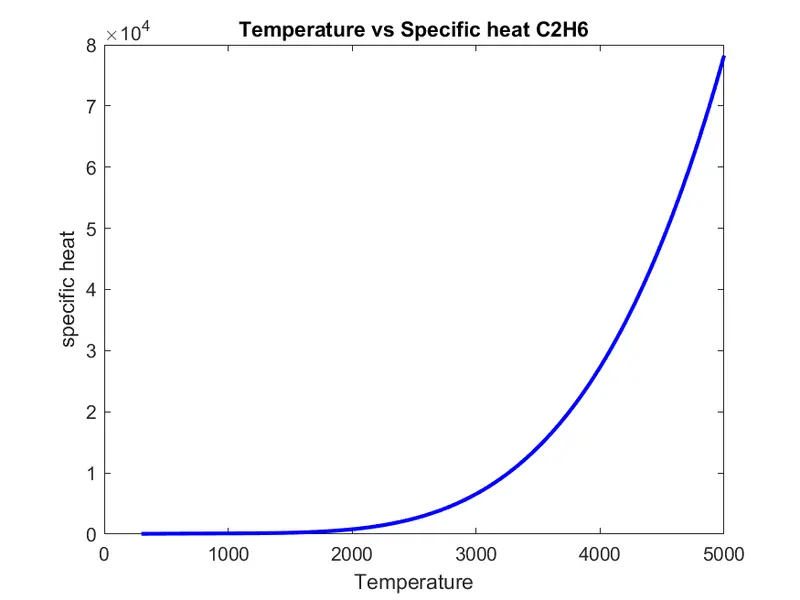
Figure 4 Specific heat vs temperature for C2H6