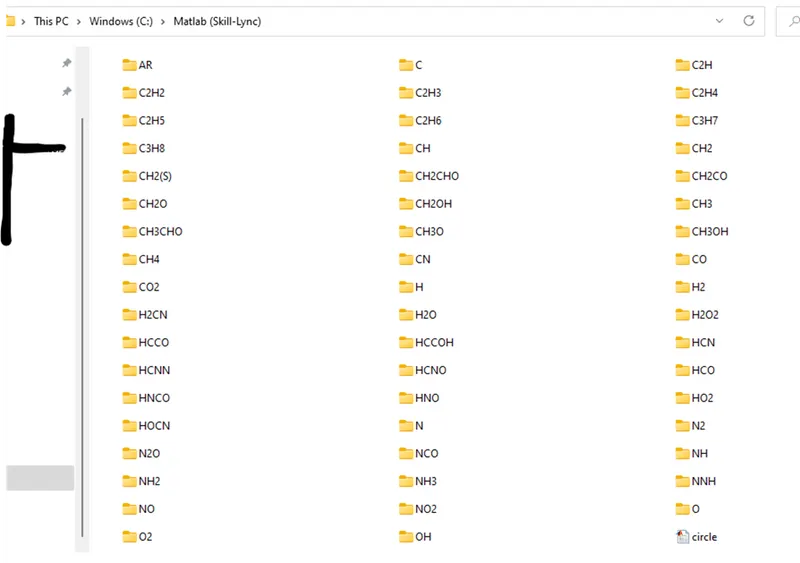
Project 1 - Parsing NASA thermodynamic data
Parsing Thermodynamic data
Aim: The aim of the project is to read the given file, ‘THERMO.dat’. extract the values of coefficients and calculate the specific heat, enthalpy, and entropy for all the given species.
Objective:
- Write a function that extracts the 14 coefficients and calculates the enthalpy entropy and specific heats or all the species in the data file
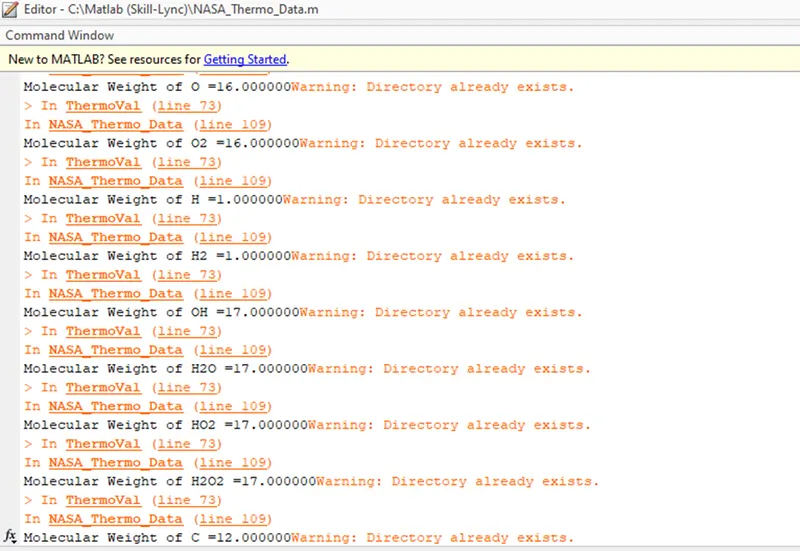
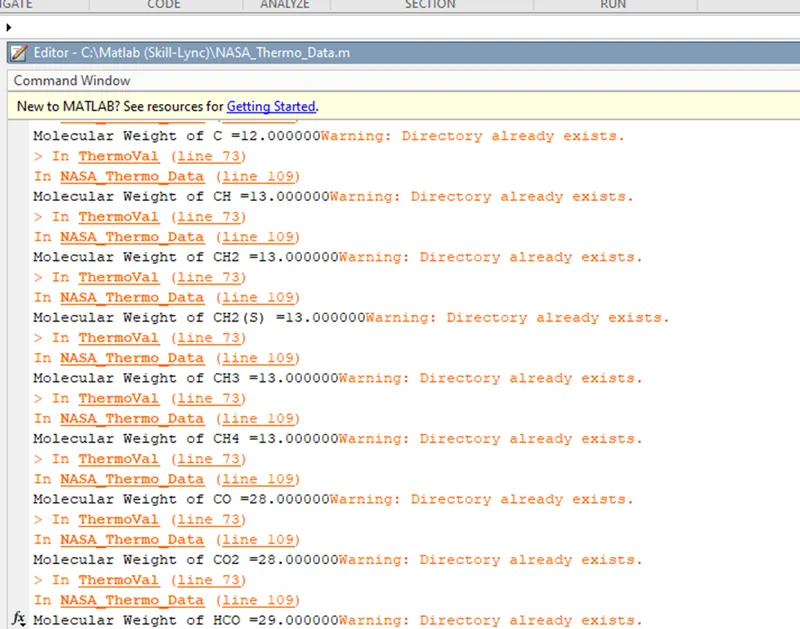
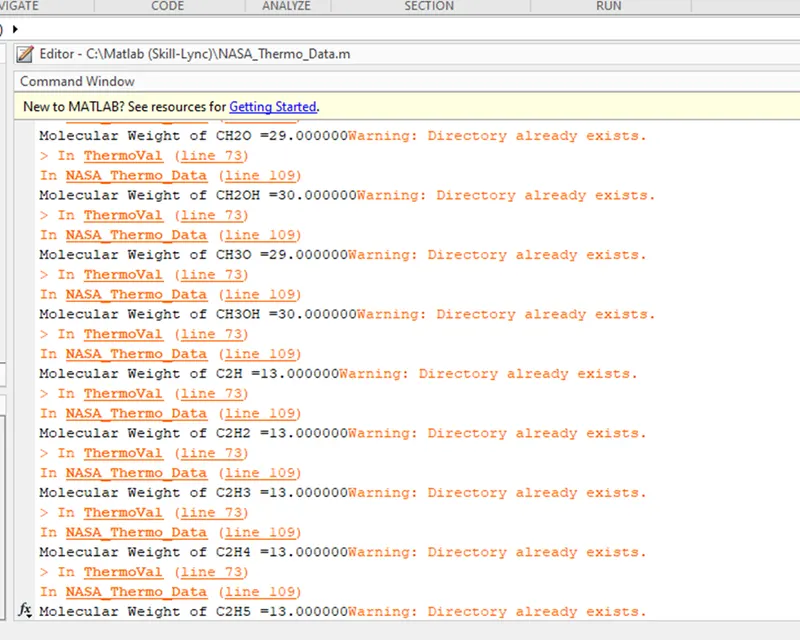
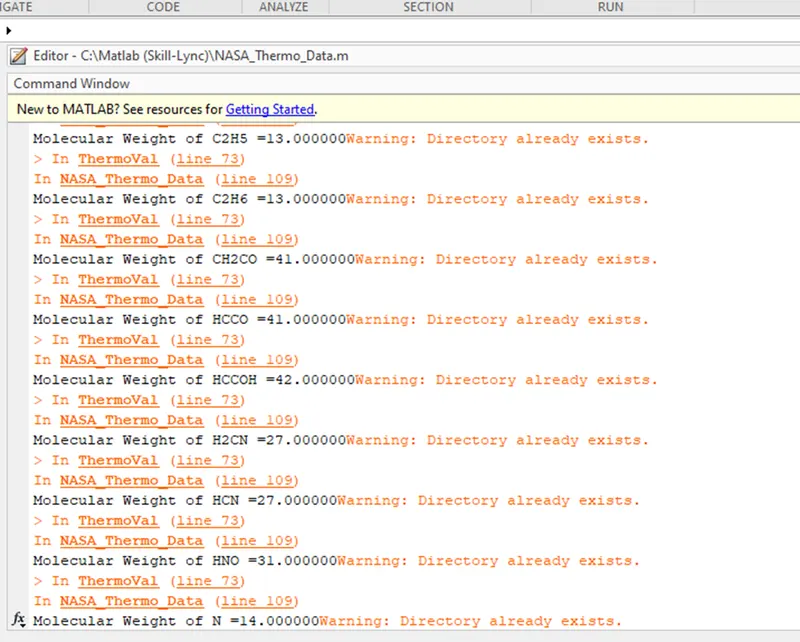
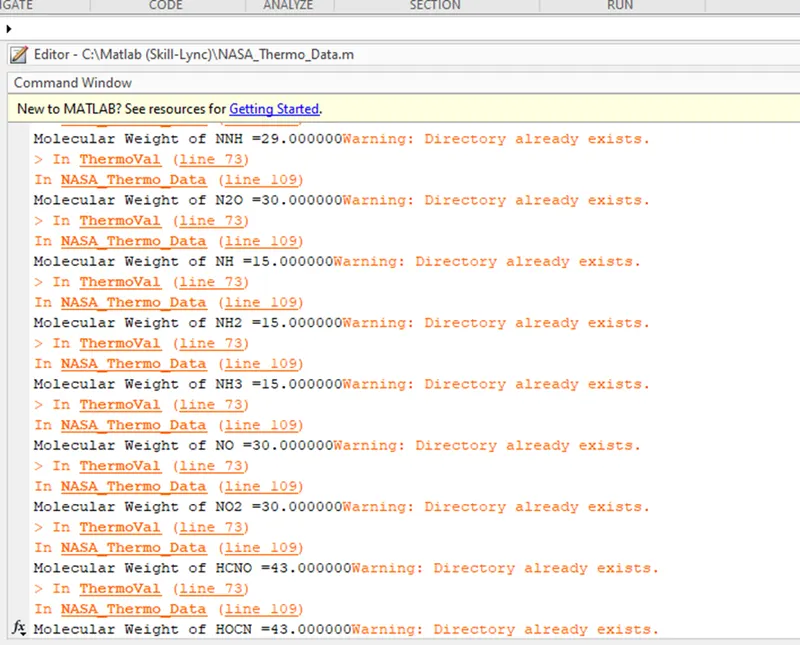
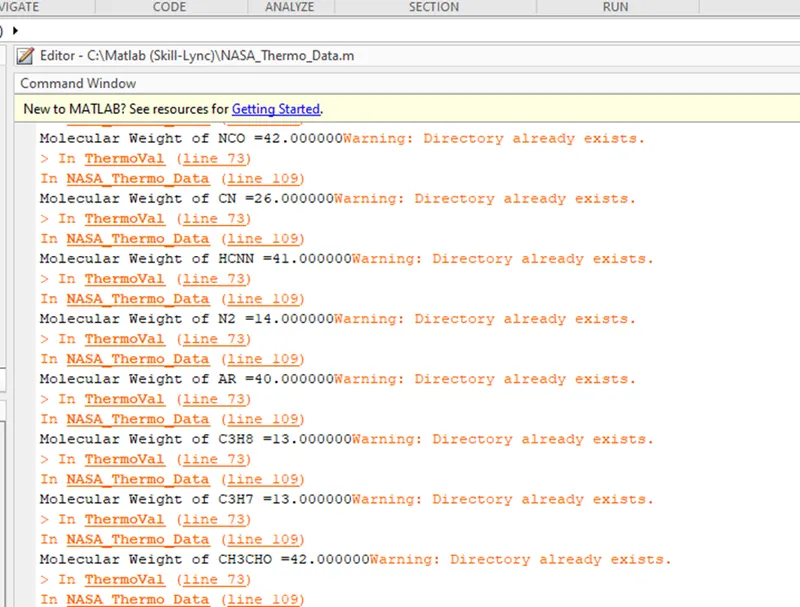
- Calculate the molecular weight of each species and display it in the command window
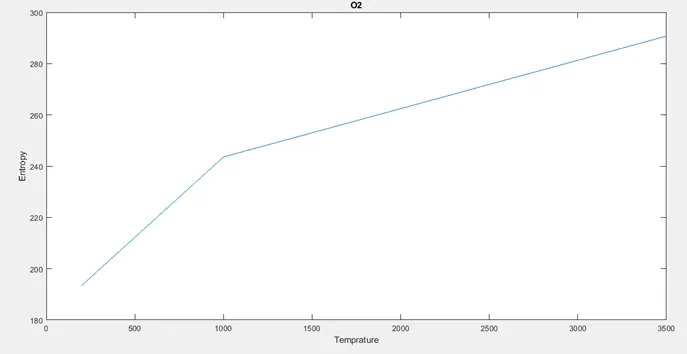
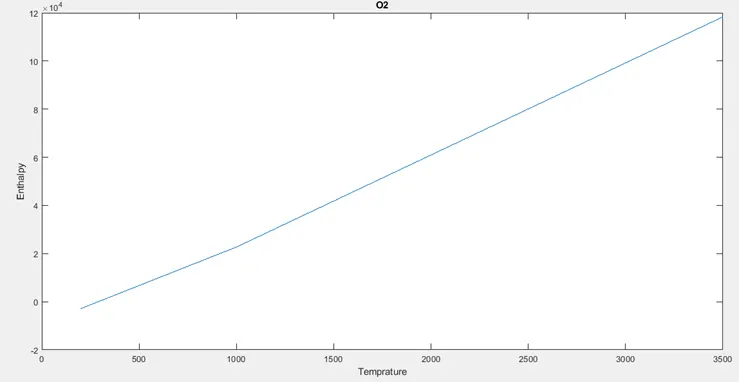
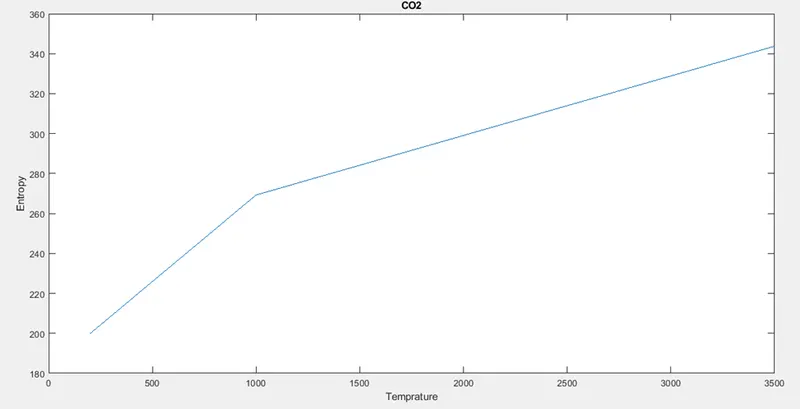
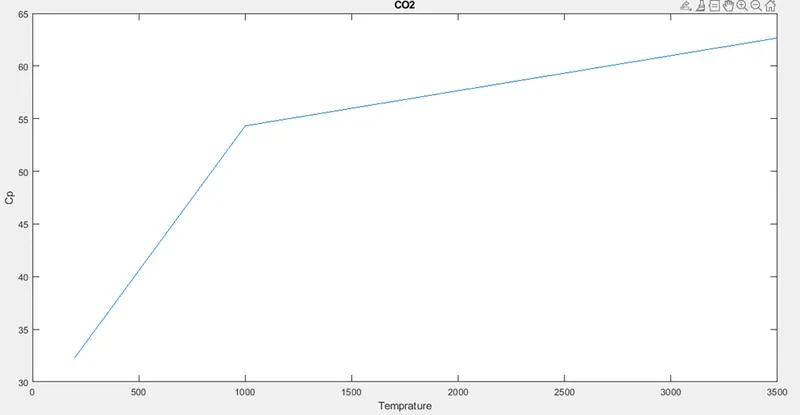
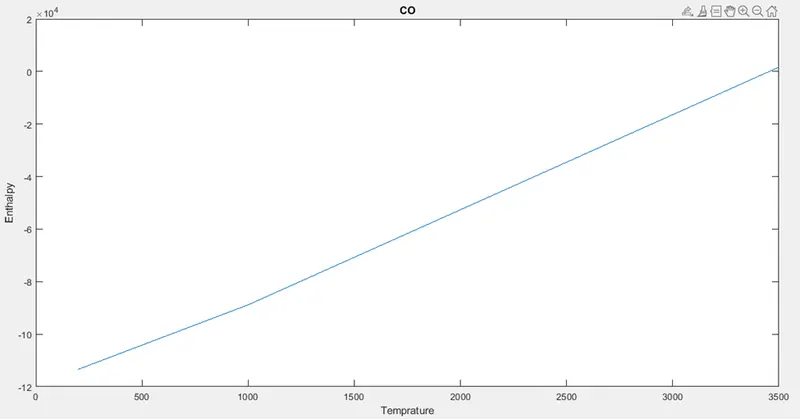
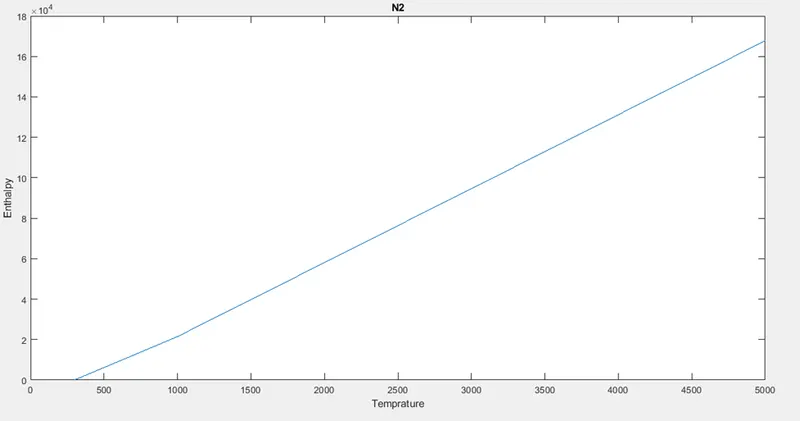
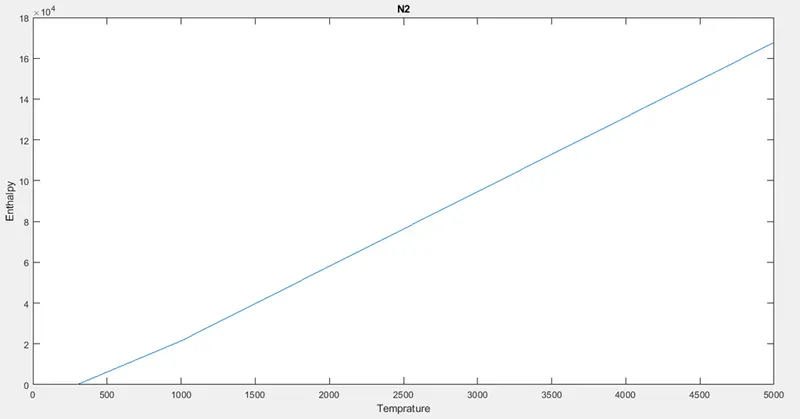
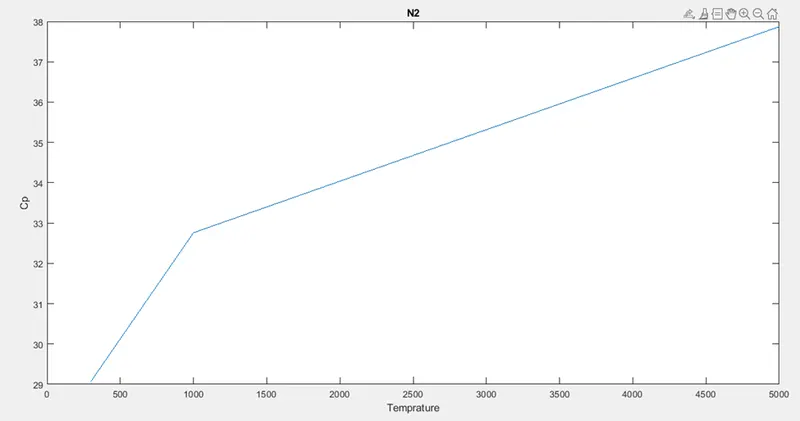
- Plot the CP enthalpy and entropy for the local temperature range for specific species.
- Save the plots as images with appropriate names and dump them in a separate folders for each species with suitable names.
Theory:
NASA came up with polynomials that can be used to evaluate thermodynamic properties such as enthalpy entropy and specific heat they have also documented the coefficients that are required to evaluate these polynomials for over 100 species.
The first seven coefficients our high temperature coefficients and the second seven coefficients are low temperature coefficients. R is the universal gas constant and T is the temperature.
Explanation of Code:
- The first step is to open the given file THERMO.dat in the read mode
- Using inbuilt function, fgetl() to read the first line. Using inbuilt function strsplit() to convert given line into a data type ‘cell’. Then running a for loop for the full length of the the cell data type, and converting the data into numerical value using the inbuilt function str2double(). Getting the global temperature values from the first line.
- Running a while loop to read the full file, using inbuilt function ischar() which if returns true value the while loop will continue to run.
- Reading the next line on the file. Using inbuilt function isletter() to check if the value at the first position of the line is a letter or a number.
- Starting an ‘if’ condition, which evaluates if the first value in the line is a letter or a number. This way we can skip all the comments as well as lines with numerical data in the starting.
- Using inbuilt function strsplit(), to get all the data from the line with ‘ ‘ (space between words as a demarcation).
- Now running a reverse for loop from the end of the line, for three times. This way we get the local temperature of the species. Since there is an indexing value at the end, we have to delete that.
- Noe using inbuilt function strfind() to find the number of times letter ‘E’ has occurred in the line.
- Converting the format of the program into ‘longEng’.
- To get the coefficients, firstly reading from the start of the line, till the point where we have the first ‘E’ plus 3 places. Putting this data in an array called ‘TempCF’.
- Then Running a for loop for the remaining coefficients.
- Similarly getting the coefficients from the second and the third row of the species.
- Putting all the coefficients in a single array called ‘AllCoeff’. Putting the low temperature and high temperature coefficients into separate arrays.
- Calling a user defined function ‘ ThermoVal()’ to calculate the vales of Cp, enthalpy and entropy. Passing Low temperature and high temperature coefficients, local temperature, species and a counter to get the figure.
- Defining the path of the folder where function to calculate the weight of the species is saved.
- Increasing the ‘count’ by three every time, to get figure for each of the species.
User defined Function ThermoVal()
- A user defined function which takes in the values of Low temperature coefficient, high temperature coefficients, Local temperature, Species type, and the count. And returns an array with the calculated thermodynamic properties along with the local temperature.
- Firstly, storing the species type in another character called ‘sub’
- Starting a for loop which will run 3 times. And check the temperature before calculating the thermal values.
- Running an ‘if’ condition, if the temperature is greater than 999, then it uses high temperature coefficients other vise the low temperature coefficients.
- All of the data is stored in an array called ‘CalData’, where each row contains the specific temperature and the thermodynamic values for it.
- Getting the values to make the graph from ‘CalData’ for thermodynamic properties.
- Plotting the data and storing it as a jpg file in the folder of the same name.
User defined function MolWeight()
- This function takes in the species type and calculates the molecular weight of the species and return it to the screen.
- Forming an array of the species, hydrogen, Carbon, Oxygen, Nitrogen and argon.
- Forming a matrix with the weight of each element.
- Initializing the weight of the species w=0.
- Starting a for loop from i=1 to the length of the species string.
- Comparing the elements in the given species with the array of the user defined species. Using a nested for loop and an inbuilt function strcmp().
- Calculating the weight.
- Giving output as the weight of the species.
Errors:
1.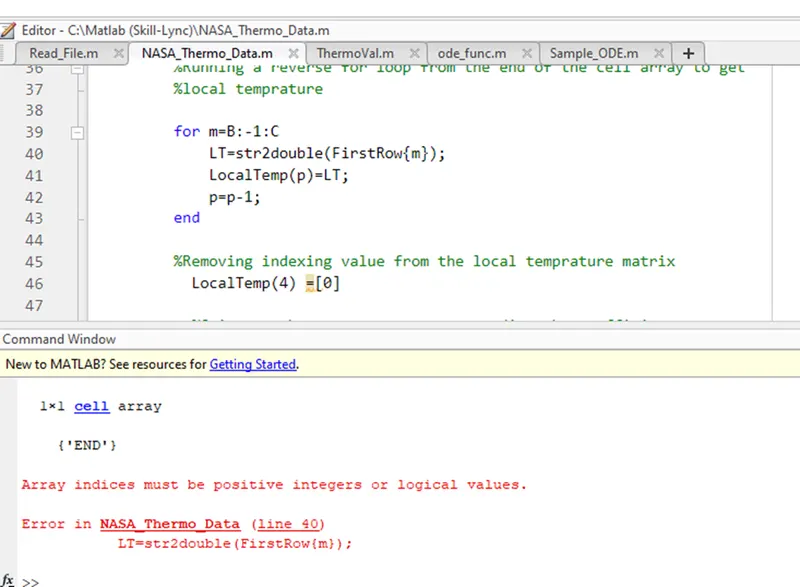
Logical error while using str2double()
2. 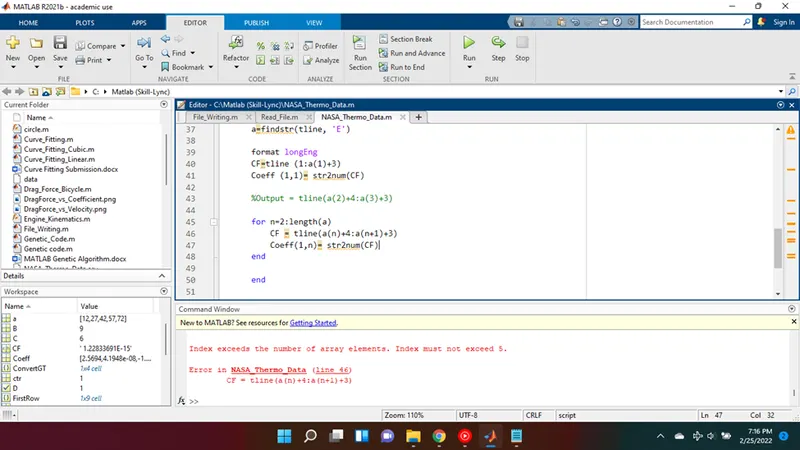
Logical error of for loop running over its scope
%Program to read the 'THERMO.dat' file and give the thermodynamic properties as the %output

clear all
close all
clc

fn = fopen('THERMO.dat', 'r');
line_ex=fgetl (fn);

%Getting the global temprature values
%Using fgetl() to get the character value
GT = fgetl(fn);
ConvertGT = strsplit (GT, ' ');
for i=2: length(ConvertGT)
    GlobalTemp(i)=str2double(ConvertGT{i});
end
GlobalTemp(1) =[];

ctr=1;
count = 1;
tline = fgetl(fn);

%Using While loop to read the file until there are characters in the file
while ischar(tline)     %Using ischar to check if there is any character in file
    tline = fgetl(fn);

    %To check if the first letter of the line is an alphabet
    D=isletter(tline(1));

    if (D == 1)
       op=1;

       %Getting all the value into a cell type array from the first line
       FirstRow = strsplit (tline, ' ');
       B=length(FirstRow);
       C=B-3;
       p=4;

       q=FirstRow{1};

       %Running a reverse for loop from the end of the cell array to get
       %local temprature

       for m=B:-1:C
           LT=str2double(FirstRow{m});
           LocalTemp(p)=LT;
           p=p-1;
       end

       %Removing indexing value from the local temprature matrix
         LocalTemp(4) =[ ];

         %Going to the next row to start reading the coefficients
         %For First row
            tline = fgetl(fn);

            %Find all the places where there is letter 'E'
            a=strfind(tline, 'E');

            %Changing the format of the data to get maximum number of
            %places after the decimal
            format longEng

            %Getting the first coefficient
            CF=tline (1:a(1)+3);
            TempCF (1)= str2double(CF);
            b=length(a)-1;

            %Running for loop to get the remaing coefficients
           for n=1:b
                CF = tline(a(n)+4:a(n+1)+3);
                TempCF(n+1)=str2double(CF);
           end

        %For Second Row

            tline = fgetl(fn);
            a=strfind(tline, 'E');
            CF=tline (1:a(1)+3);
            TempCF2 (1)= str2double(CF);
            b=length(a)-1;

            for n=1:b
                CF = tline(a(n)+4:a(n+1)+3);
                TempCF2(n+1)=str2double(CF);
           end
        %For Third Row

            tline = fgetl(fn);
            a=strfind(tline, 'E');
            CF=tline (1:a(1)+3);
            TempCF3 (1)= str2double(CF);
            b=length(a)-1;

            for n=1:b
                CF = tline(a(n)+4:a(n+1)+3);
                TempCF3(n+1)=str2double(CF);
            end

            %Summing up all the coeffecients in one array
            AllCoeff= [TempCF TempCF2 TempCF3];

            HighCoeff= AllCoeff(1:7);
            LowCoeff = AllCoeff(8:14);


            %Function call
            %Function To calculate the coefficients
            %Values Passed into the function
            %Low temprature coefficients, High temprature coefficients and
            %Local temprature, species, and counter
            ThermoVal(LowCoeff, HighCoeff, LocalTemp, q, count);


            cd('C:\Matlab (Skill-Lync)');
            %User defined function to
            W=MolWeight(q);

            count = count+3;


    end

end


%User Definied Function to calculate the thermodynamic properties
function [CalData] = ThermoVal (LowCoeff, HighCoeff, LocalTemp, q, count)

%transfering the substance name
sub=q;

%Initialising the temprature and coefficient matricies
T=sort(LocalTemp);
a=HighCoeff;
b=LowCoeff;

%initialising the value of R
R=8.314;

ctr=1;

for i=1:3
    if(T(i)>999)
        C = (a(1) +a(2)*T(i) + a(3)*(T(i)^2) + a(4)*(T(i)^3) + a(5) * (T(i)^4))*R;
        H = (a(1) + (a(2)*T(i))/2 + (a(3) * (T(i)^2))/3 +(a(4)* (T(i)^3))/4 + (a(5) * (T(i)^4))/5 + a(6)/T(i))*R*T(i);
        S = (a(1) * log(T(i)) + a(2) *T(i) + (a(3)* (T(i)^2))/2 + (a(4) * (T(i)^3))/3 + (a(5)*(T(i)^4))/4 + a(7))*R;

    else
        C = (b(1) +b(2)*T(i) + b(3)*(T(i)^2) + b(4)*(T(i)^3) + b(5) * (T(i)^4))*R;
        H = (b(1) + (b(2)*T(i))/2 + (b(3) * (T(i)^2))/3 +(b(4)* (T(i)^3))/4 + (b(5) * (T(i)^4))/5 + b(6)/T(i))*R*T(i);
        S = (b(1) * log(T(i)) + b(2) *T(i) + (b(3)* (T(i)^2))/2 + (b(4) * (T(i)^3))/3 + (b(5)*(T(i)^4))/4 + b(7))*R;

    end

    %Saving data in an array
    %Data specific to one temprature in a single row
    CalData (ctr,:)= [T(i), C, H, S];

    ctr=ctr+1;

end

%Temprature = CalData(:,1);
TempOrder = CalData(:,1);

Cp= CalData(:,2);
Enthalpy= CalData(:,3);
Entropy = CalData(:,4);

%Defining the directory
cd ('C:\Matlab (Skill-Lync)')
figure(1)
%Making the first plot
plot(TempOrder, Cp);
title(sub)
xlabel('Temprature');
ylabel('Cp')
%Saving the figure
saveas(figure(count), 'Specific Heat.jpg');
%cd ('C:\Matlab (Skill-Lync)')

%increasing the counter
count = count+1;
figure (2)
plot(TempOrder, Entropy);
title(sub)
xlabel('Temprature')
ylabel('Entropy')
saveas(figure(count), 'Entropy.jpg');
%cd ('C:\Matlab (Skill-Lync)')

count = count+1;
figure (count)
plot(TempOrder, Enthalpy);
title(sub)
xlabel('Temprature')
ylabel('Enthalpy')
saveas(figure(3), 'Enthalpy.jpg');
%cd ('C:\Matlab (Skill-Lync)')


mkdir(sub);
cd(sub);

end


%User Definied Function to calculate the molecular weight of the species
function W = MolWeight(q)


sub = upper(q);

%Defining array with all the elements
Element = [ 'H', 'C', 'O', 'N', 'A'];

%Defining array with weight of the elements
ElWt = [1 12 16 14 40];

%Running for loop for all the places in the species
W= 0 ;
for i =1: length(sub)
    for j = 1 : length(ElWt)
        if strcmp(sub(i), Element(j))
            W=W+ElWt(j);
            ctr = j;
        end
    end
    n= str2double(sub);
    if n>1
        W=W+ElWt(ctr)*(n-1);
    end
end

fprintf('Molecular Weight of %s =',sub)
fprintf('%f', W);


end
Output:
O2
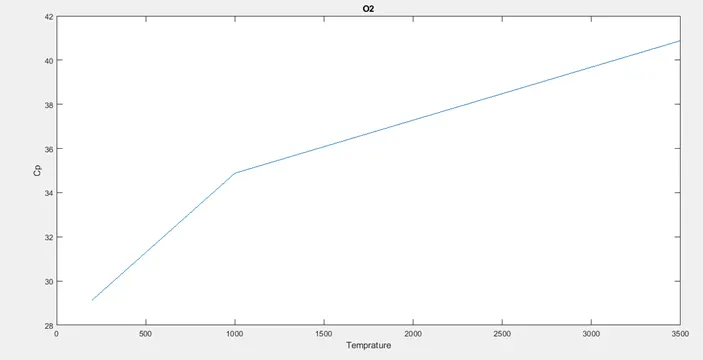
CO2
N2
Molecular Weight:
Window output: