Flow over Ahmed Body using Star CCM+
Objective:
- Simulate the Flow around the Ahmed body and compare the results with wind tunnel results.
- Calculate the cd and cl using the different turbulence models.
Ahmed body
The Ahmed Body was first created by S.R. Ahmed in his research “Some Salient Features of the Time-Averaged Ground Vehicle Wake” in 1984. Since then, it has become a benchmark for aerodynamic simulation tools. The simple geometrical shape has a length of 1.044 meters, a height of 0.288 meters, and a width of 0.389 meters. In this project, the slant angle is set as a design parameter and run the simulation for two different slant angles.
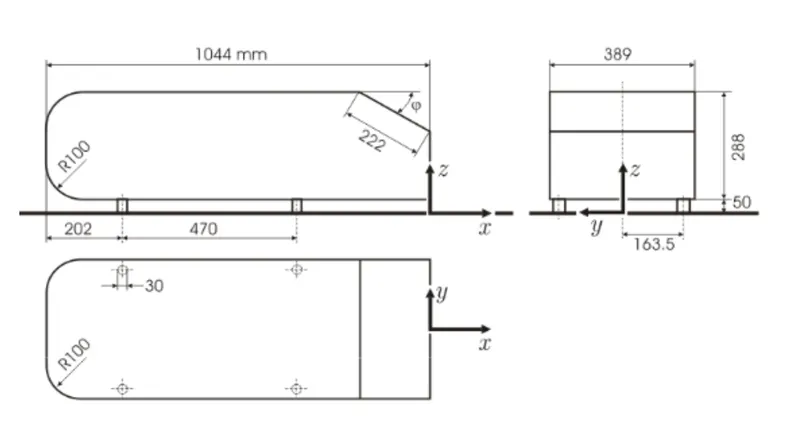
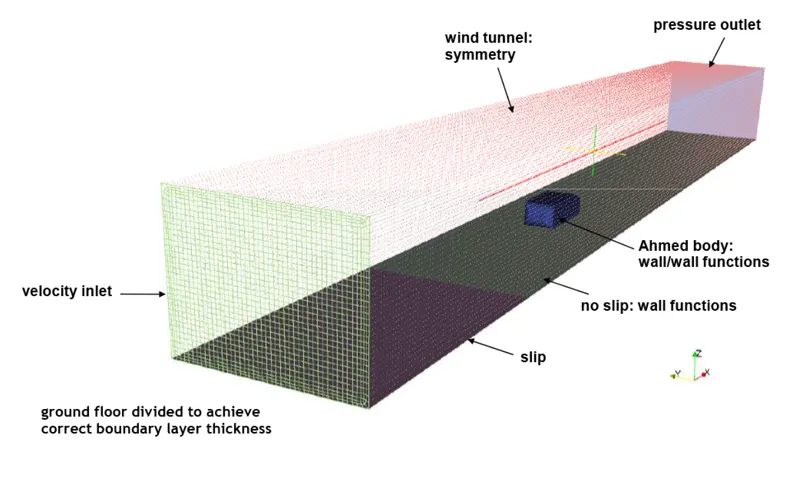
The geometry is created using 3d cad modeler in star ccm+ as per the above dimensions. Then check surface repair for any surface errors. The computational domain is created using the box shape part. The dimensions are chosen according to the thumb rule for wind tunnel design. We need to compare the results with experimental results so the upstream distance is calculated based on boundary layer thickness. In order to avoid reverse flow in the inlet an extra region is created and slip BC is given.
Mesh
Since it is an external aerodynamic simulation trimmer mesh is used as core mesher. The prism layer is used for capturing the boundary layer. And automated surface remesher and automated surface repair are used for improving surface quality.
Surface mesh
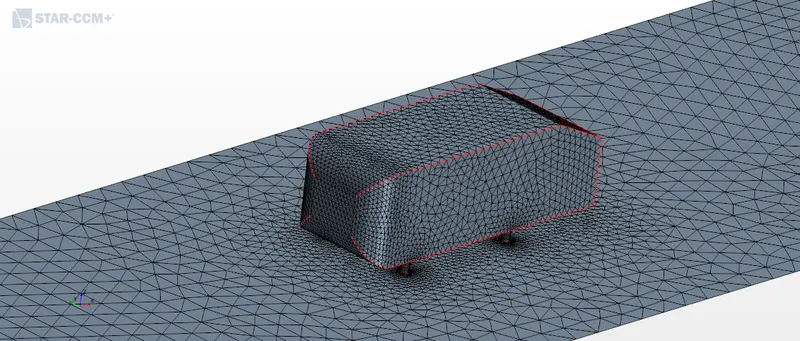
Base grid size=0.1 m
Minimum surface size= 0.01m
Surface growth rate=1.2
A surface control is created for AHMED body to refine the surface mesh.
Target surface size=0.035 m
Minimum surface size=0.005 m
Volume mesh
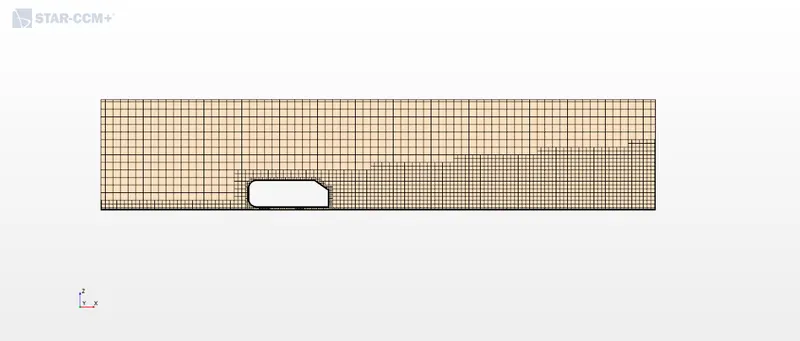
Volume growth rate=Medium
Number of prism layers=6
The near-wall thickness is calculated from the Y+ value. In this case, we have to compare the results for two different turbulence models. K epsilon and K omegaSST. K epsilon is a high Y+ model so the near-wall thickness for each case is different.
Prism layer near-wall thickness (K epsilon)=3.1E-4 m
Prism layer near-wall thickness (K OmegaSST)=1.8E-5 m
Case setup
Physics models used;
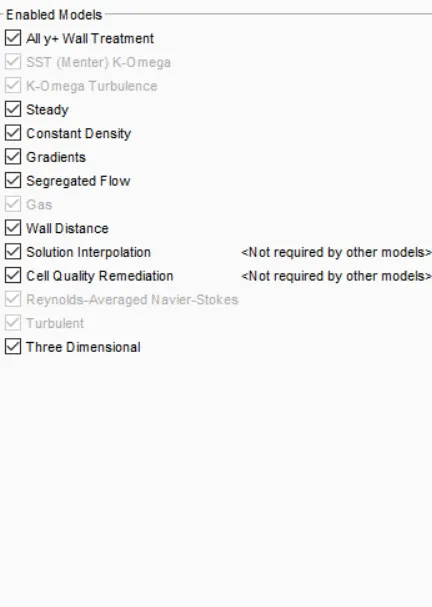
The simulation is 3 dimensional. Since it is a steady-state simulation steady-state model is used. Its low Mach number flow so segregated flow solver and constant density models are selected. Since it is an external aerodynamic simulation material is air, So Gas model is applied. We have to compare the results for different turbulence models and with different slant angles. So the mesh is created for 35 degree and 25-degree slant angles and each case is run for k epsilon and k omega turbulence models.
Boundary conditions
Inlet: Velocity inlet
V=40 m/s
Ahmed body: Wall
Wall-external: Symmetry plane
Outlet: Pressure outlet
The bottom part of the wind tunnel is split into two parts as shown in the figure, and slip and no-slip wall BC is given.
Result
Residual plot
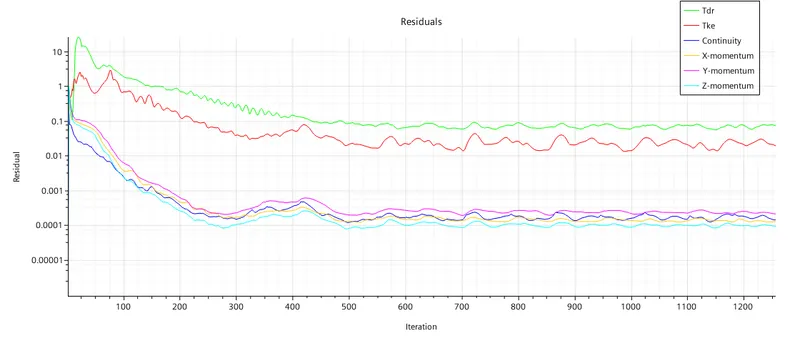
`psi=25 ^0` - K epsilon`
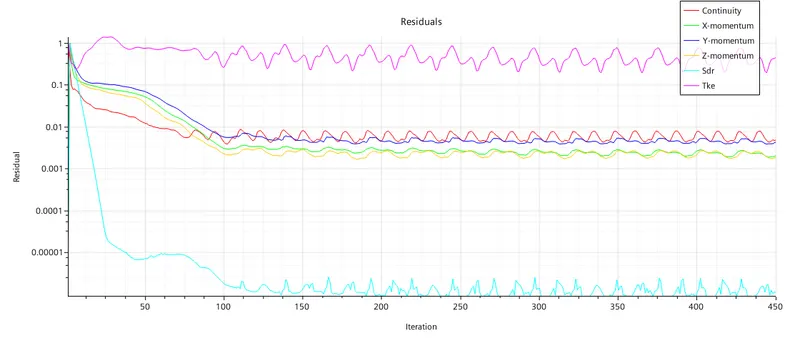
`psi=25 ^0` - K omegaSST`
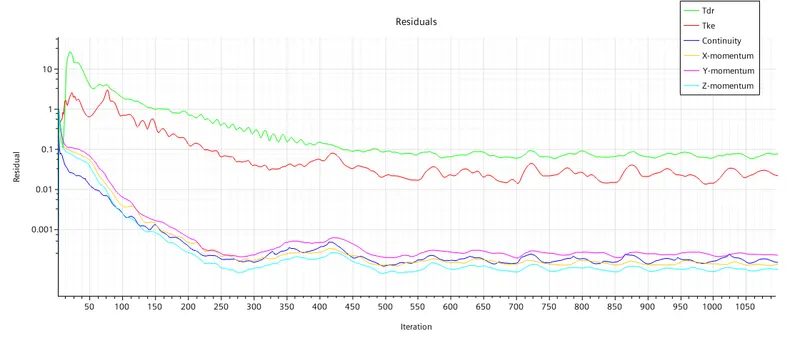
`psi=35 ^0` - K epsilon`
`psi=35 ^0` - K omegaSST`
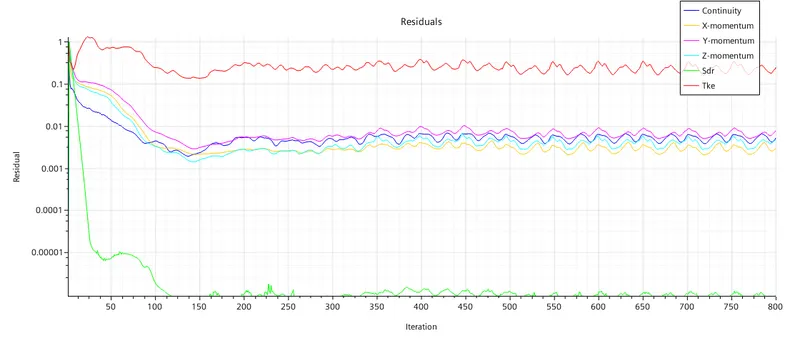
From the plot, we can see that solution is converging.
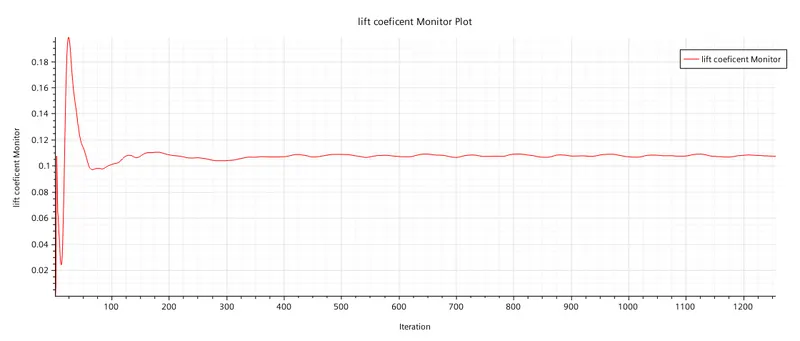
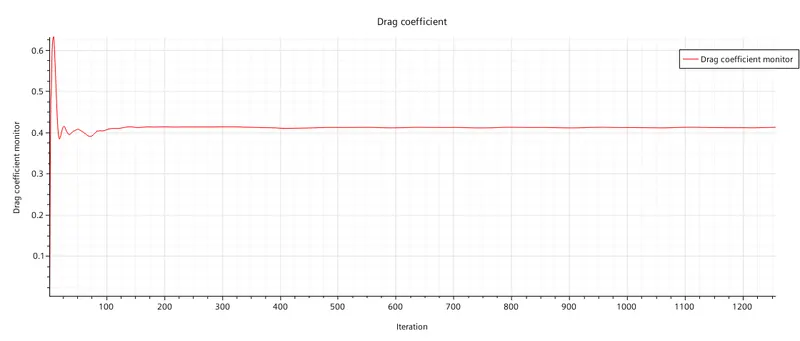
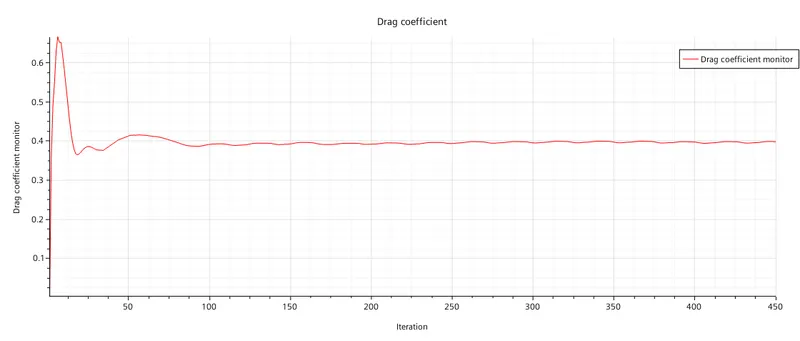
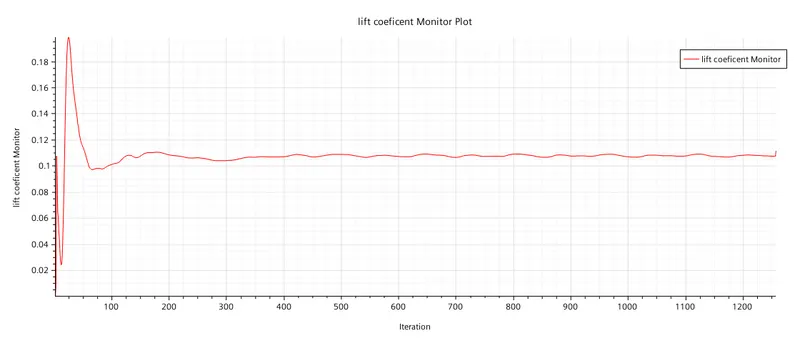
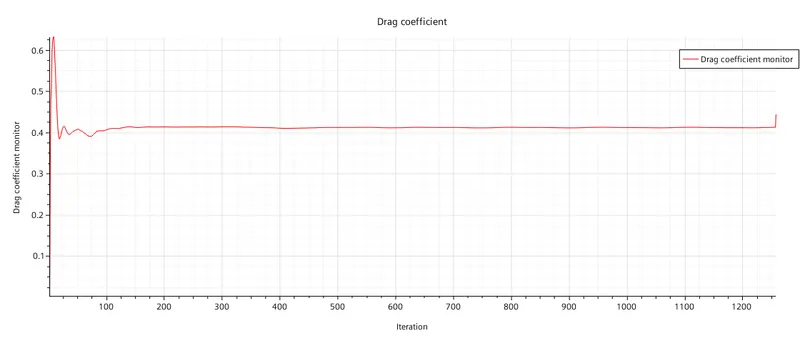
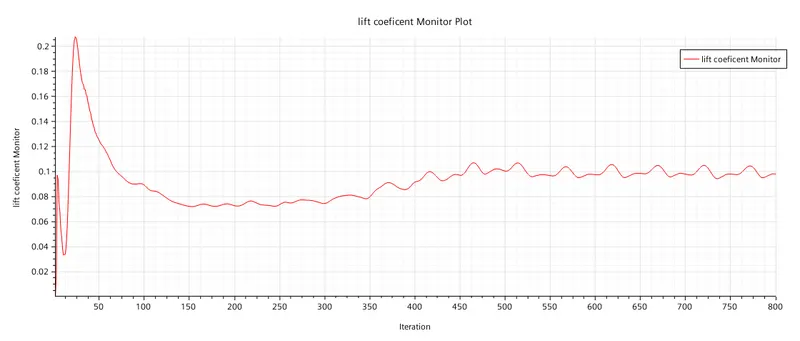
Lift and drag Coefficient monitor plot
`psi=25 ^0` - K epsilon`
`psi=25 ^0` - K omegaSST`
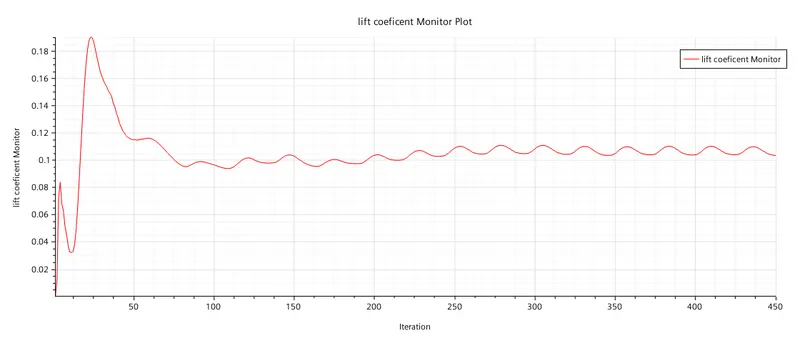
`psi=35 ^0` - K epsilon`
`psi=35 ^0` - K omegaSST`
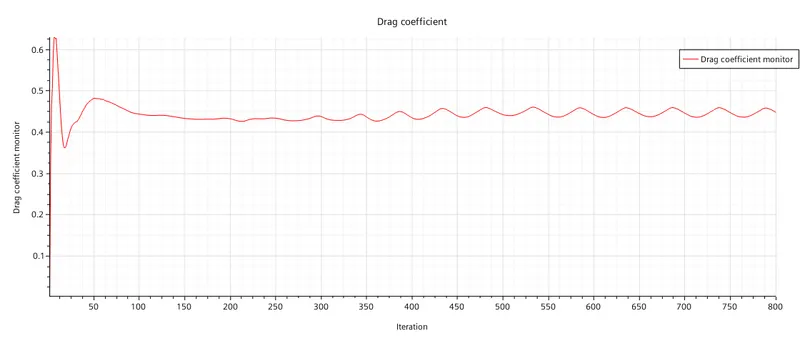
Drag coefficient
| Slant angle | ||
| 25 | 35 | |
| K epsilon | 0.4114 | 0.412 |
| K omega SST | 0.398 | 0.4463 |
Lift coefficient
| Slant angle | ||
| 25 | 35 | |
| K epsilon | 0.1073 | 0.1076 |
| K omega SST | 0.1074 | 0.1013 |
The lift coefficient value for the 25-degree slant angle is almost the same for both turbulence models. But for larger slant angles the values are different.
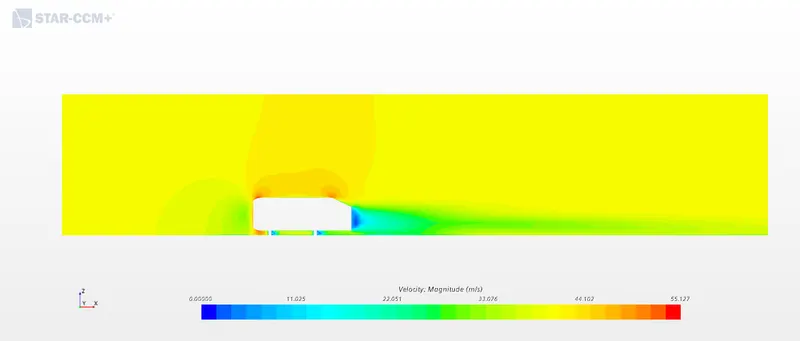
Velocity
`psi=25^0`
`psi=35^0`
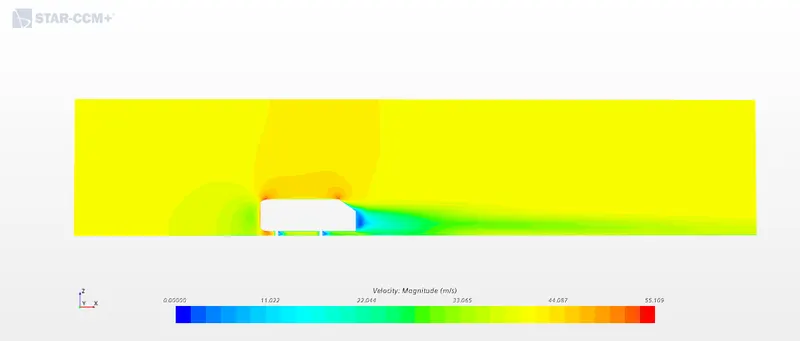
The wake region is created behind the AHMED body and cylinder part. Flow separation is more in higher slant angle, Which created more drag.
Pressure
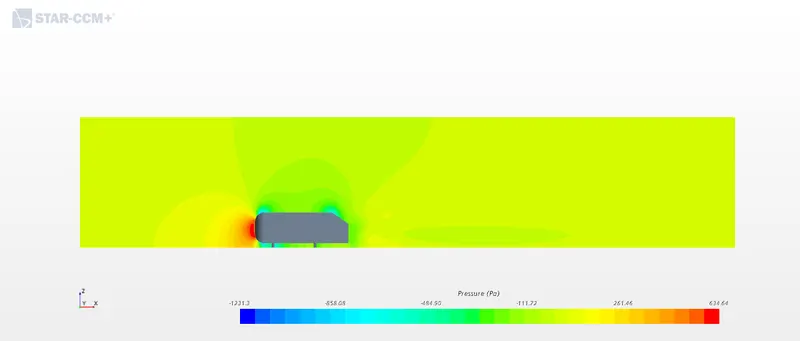
Pressure in the front region of the AHMED body is higher because of the flow stagnation.
Compare the result with the experiment
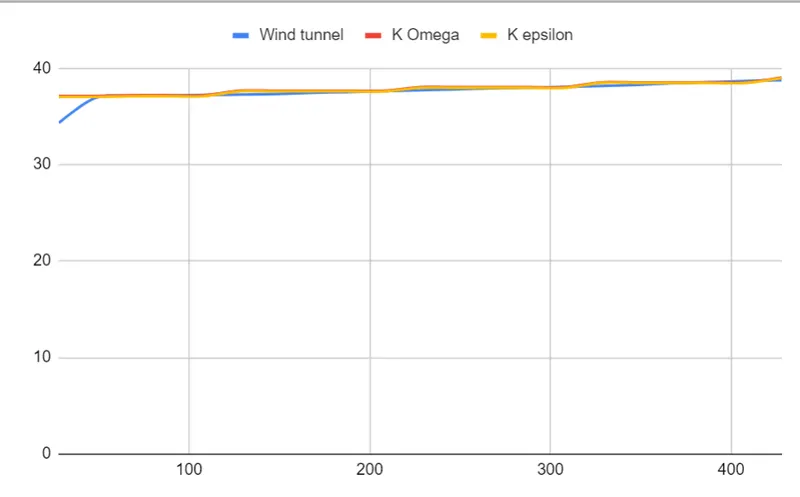
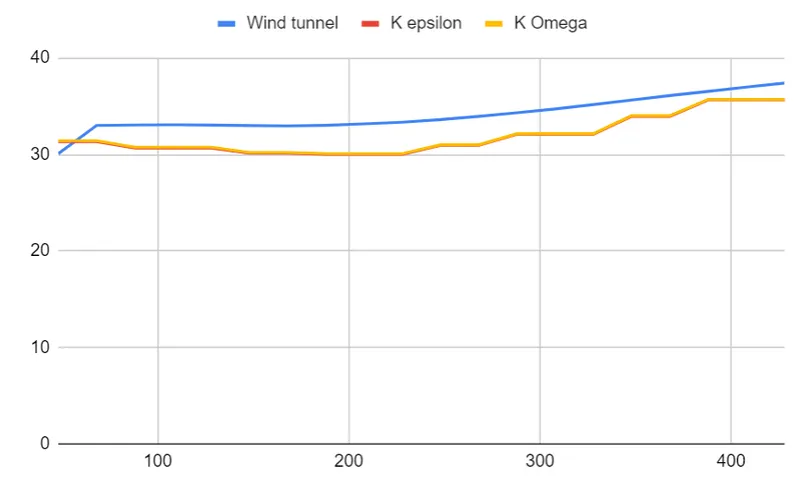
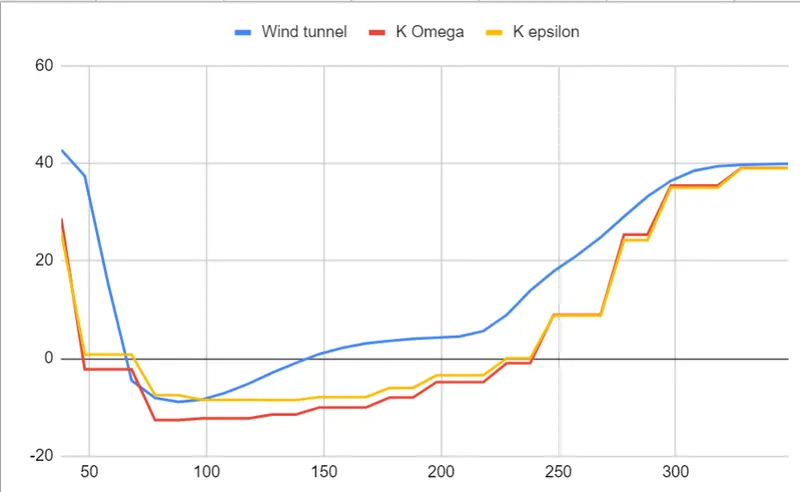
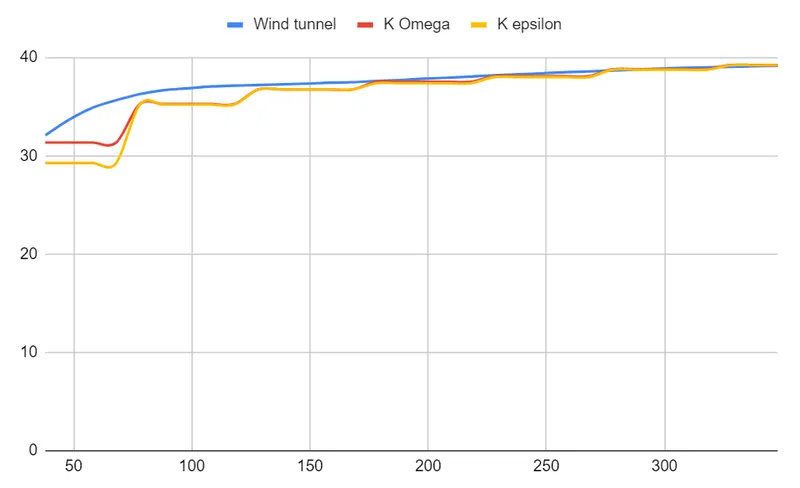
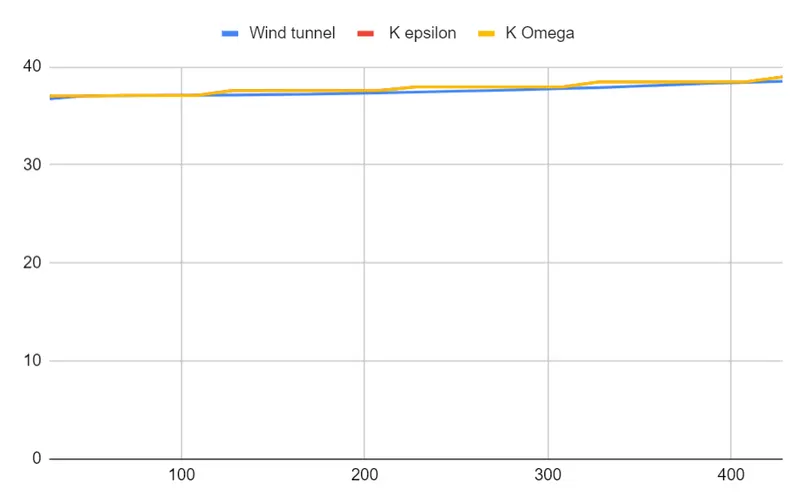
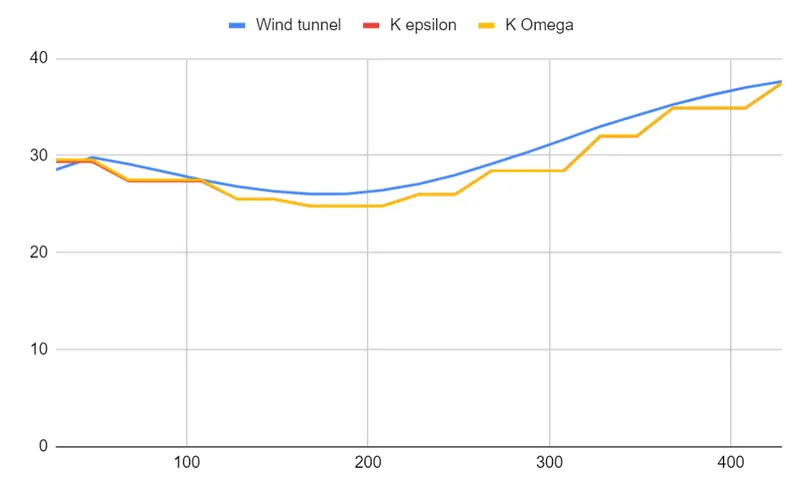
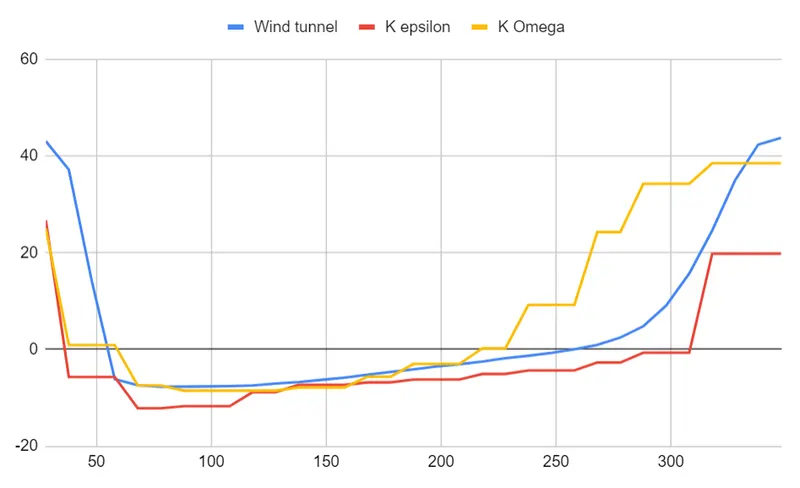
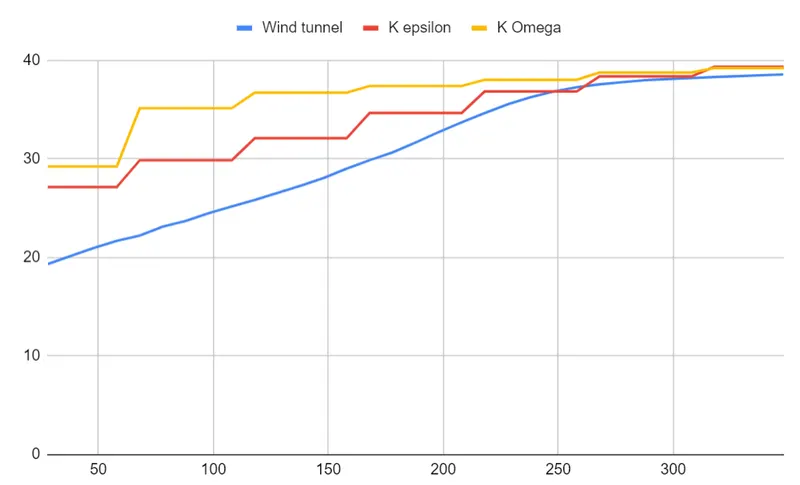
The velocity values at a different location are captured using line probe and compared with experimental data.
25deg
X=-1442,Y=0
X=-1228,Y=0
X=38,Y=0
X=638,Y=0
35 deg
X=1463,Y=0
X=-1163,Y=0
X=37,Y=0
X=637,Y=0
Animation- streamlines
The recirculation region formed behind the Ahmed body is shown in the animation.
Conclusion
- The flow over the AHMED body is simulated and the results are compared with experimental results.