Project 1 - Design and Develop an IOT-based Wireless Wearable Health Monitoring System
IoT based Wireless Wearable Health Monitoring System to monitor the physiological parameters of ECG, Heart Rate, Pulse Oximetry, Cuffless Blood Pressure and Body Temperature.
Name of Product is PET HB which stands for “Pulse oximetry, ECG, Temperature, Heart Rate and Blood Pressure.
Specifications are:
- Real-time monitoring.
- Washable.
- Bluetooth, WiFi and Internet connectivity.
- ECG: Electrocardiogram
- Amplitude of ECG signal is 0.5mV to 1mV between 60beats/min to 100beats/min.
- Frequency of ECG signal is 0.5Hz to 100Hz.
- Sensors used for ECG are textile electrodes.
- Fineness of yarn used in electrodes is 29.5 tex.
- Silverstat 60%, 40% PES
- Surface conductivity of 1.2ohms/square.
- Electrodes are rectangular in shape with dimensions 70X100mm
- Electrode resistance is 0.3ohms
- Powered by mini-button battery.
- Durability is 24hrs.
- Heart Rate:
-
- Amplitude of HR is 0.5 to 1mV.
- Frequency of HR is 0.04Hz to more than 0.4Hz.
- No specific sensors are used as it will be calculated through ECG only.
-
- Pulse Oximetry: Measuring Range, Saturation:0% to 100%
- Accuracy: Saturation: 70 to 100% ± 2 digits
- Power requirement: Two 1.5V alkaline N-cell batteries
- Battery Life: Minimum 24 hours continuous
- Method used: Non-Invasive Reflectance Method
- Photodiodes (PD) used: 8 surface PDs
- Wavelength of Light source: Red LED is used at 660nm and IR light is used at 940nm
- Frequency is 0.66Hz to 15Hz.
- Cuffless Blood Pressure:
- No specific sensor is used as it is calculated via ECG only.
- Body Temperature:
- Sensor used is- Optical fibre Bragg grating (FBG) based sensors.
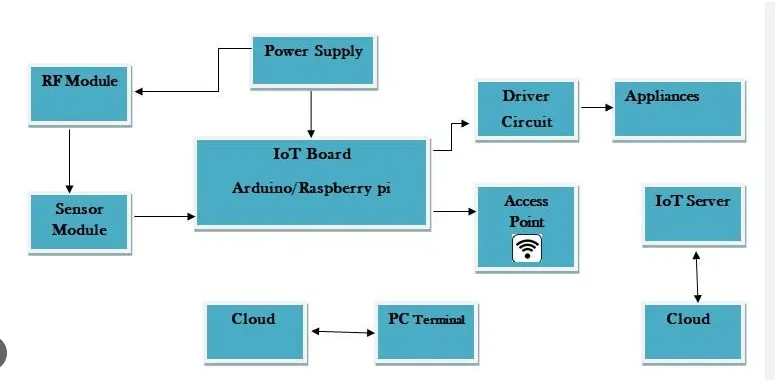
Block Schematic of IoT device to acquire the parameters:
- on the user’s body is used to obtain a reference potential that will help to reduce the common-mode interference between the two ECG signals. The electrode material is made of electrically conductive textile. This creates a textile composite that guarantees high comfort for the user while ensuring good quality of ECG measurements. The composite is implemented by a carrier (a T-shirt with flame retardant) and sensing electrodes embroidered with yarn based on a mixture of polyester coated with silver nanoparticles and cotton. The electrodes not only provide great comfort but are also antibacterial and antiallergic (due to silver nanoparticles).
- 4 rectangle- It is a signal receiver that connects to the three ECG electrodes by conductive textile yarns, and it can transmit the ECG signals acquired to a smartphone.
- The signal receiver is designed based on an system embeded technology. Its components include a differential amplifier, a bandpass filter, a Microcontroller Unit (MCU), and a Bluetooth module. The differential amplifier can suppress the common-mode noise and amplify the ECG voltage from the textile electrodes. The bandpass filter has the frequency range of 0.04 Hz to 150 Hz and is aimed at removing baseline drifts and power line harmonics in the ECG signals. And the MCU can reconstruct the ECG signals and then transmit the signals to a smartphone by Bluetooth. The signal receiver is powered by the mini-button battery.
The smartphone based on the IOS or Android operating systems will act as a portable device. When some special App programs designed for the processing of ECG signals are installed on the smartphone, the smartphone can display the ECG signals in real time for the user of the below
- smart clothing, which allows the user to know his/her heart parameters anytime and anywhere. Moreover, the smartphone can immediately transmit the ECG signals received from the smart clothing to a remote PC terminal through WiFi or cellular network.
- The PC terminal, however, can store large amounts of ECG signals transmitted from the smartphone for a long time. Some special programs are also designed and installed on the PC terminal in order for local or remote doctors to accurately diagnose the user’s health status.
- Optical fibre bragg grating (FBG interrogator) is a data acquisition unit specially designed for measurement and conditioning of signals from fibre optic sensors. An optical interrogator, also known as measurement unit or data acquisition system, is an optoelectronic instrument, which allows the reading of optical fiber Bragg grating (FBG) sensors in static and dynamic monitoring applications. During data acquisition, the interrogator measures the wavelength associated with the light reflected by the optical sensors and then converts it into engineering units.
- The FBG temperature sensor was embedded into textiles by different textile fabrication techniques via the textile platform to produce a fabric sensor. FBG is a distributed Bragg reflector that is constructed in short segments of optic fiber that reflects a particular wavelength of transmitted light. This is achieved by creating a periodic variation in the refractive index of the fiber core.
- The hybrid silicon photonic chip consists of a multiwavelength vertical-cavity surface-emitting laser array and input grating couplers, a multimode interference coupler, an arrayed waveguide grating, output grating couplers, and a PD array. The chip can serve as an FBG interrogator on a chip and offer unprecedented opportunities. With a footprint of 5 mm×3 mm5 mm×3 mm, the proposed hybrid silicon photonic chip achieves an interrogation wavelength resolution of approximately 1 pm and a wavelength accuracy of about ±10 pm±10 pm. With the measured 1 pm wavelength resolution, the temperature measurement resolution of the proposed chip is approximately 0.1°C. The proposed hybrid silicon photonic chip possesses advantages in terms of cost, manufacturability, miniaturization, and performance. The chip supports applications that require extreme miniaturization down to the level of smart grains.
- The proposed AWG interrogator of FBG sensors consists of a light source, a 2×22×2 multimode interference (MMI) coupler, four FBG distributed sensors, a 1×81×8 AWG, a 1×81×8 PD array, subsequent signal amplification circuits, an analog-to-digital (A/D) converter, and a data-processing unit [Fig. . When an FBG reflection spectrum passes through adjacent channels of the AWG, the FBG reflection spectrum overlaps with the transmission spectrum of the two AWG adjacent channels. 𝑃𝑖Pi and 𝑃𝑖+1Pi+1 are two adjacent channels with the output light intensity of the AWG; they are the convolutions of the FBG reflection spectrum and the AWG adjacent channel transmission spectrum, respectively. When the channels of the AWG have the same transmission coefficient and half-peak bandwidths, a relationship exists between the adjacent channel light intensity ratio logarithm of the AWG and the FBG central wavelength. When the FBG is under constant stress, 𝜆FBGλFBG exhibits a linear relationship with temperature. The temperature change can be measured in real time by measuring the dual-channel light intensity and calculating the logarithm of the light intensity ratio.
- The Bragg wavelength shift against temperature change in the wavelength range is approximately 10 pm/°C. We first measured the optical response and then the interrogation results after the VCSEL and PD arrays were bonded to the silicon photonic chip. The separate channel of the light signal is converted into a voltage signal after undergoing photoelectric conversion, amplification, and filtering. The voltage signal is then sent to the A/D converter and microcontroller. The quantization error of the A/D converter ADS8345 in the interrogation experiment is 0.002 V. When the output voltage of the PD changes within less than 0.002 V, the A/D converter ADS8345 becomes indistinguishable from the change. When the temperature change of the FBG sensing is 0.1°C, the output voltage of the photoelectric detector is approximately 0.002 V. The resolution of the FBG is approximately 10 pm/°C; hence, the temperature change that corresponds to 0.1°C can be obtained at a wavelength resolution of 1 pm. Temperature measurement can be performed between 5°C and 80°C, and high accuracy is obtained in the range of 20°C–55°C.
- Demodulator- Modulation is the process of varying one or more properties of a high-frequency periodic waveform, called the carrier signal, with respect to a modulating signal (which typically contains information to be transmitted). There are two types of Modulation Techniques viz., Analog & Digital Modulation Techniques. The aim of analog modulation is to transfer an analog baseband (or lowpass) signal, for example an audio
- Red LED, IR LED, Photodiode(PD) and DAQ-
- The system is composed of two parts: a reflective PPG sensor and data processing package. The LED and PD of the sensor are encapsulated in a piece of soft silicon rubber substrate, which is sewn on the inner surface of the sleeve, with dimensions of 60 mm × 22 mm × 5 mm. The sensor is located over the front side of the wrist and the flexibility of its substrate allows it to adapt to different contours. The data processing package, with a size of 57mm × 35mm × 15mm, is attached to the backside of the wrist and connected with the sensor through a wire which is embedded within the textile material. It is responsible for handling the signal from the sensor, supplying power, and transmitting data wirelessly. The sleeve is fabricated with a textile of good air permeability and suitable for long-time wearing. The total weight of the system is 86 g.
- The hardware components consist of the sensor and a circuit which produces, collects, and processes photoplethysmography (PPG) signals.
- It collects the PPG signals produced by the hardware and process them in order to produce numerical results for SpO2 . The optical sensor is made up of two Light Emitting Diodes (LEDs), a red LED, with a peak emission wavelength of 660 nm, and an infrared emitter with a peak emission wavelength of 940 nm. These LEDs are positioned next to each other in the center of a circular Printed Circuit Board (PCB) and surrounded by 8 photodiodes (PD). The circuitry for the sensor consists of an Arduino Duo Microprocessor which is programmed to light up the red and infrared LEDs intermittently at a frequency of 100Hz. The PDs are connected in photovoltaic mode in order to produce a voltage output. Operational amplifiers are utilized to amplify the photodiode output. Once amplified, the red and infrared PPG signals obtained from the photodetectors are sent through two Sample-and-Hold circuits to separate the signals into their respective alternating current (AC) and direct current (DC) components for further filtering and amplification.
- The four input signals sent to the LabVIEW software : AC red, AC infrared, DC red and DC infrared access the VI via a National Instruments (NI) Data Acquisition (DAQ) system. The AC components of the red and infrared PPGs are measured using a peak-to-peak detection algorithm, while the DC components are measured by finding their respective averages. Once the signals are processed, SpO2 is calculated by obtaining the ratio of the AC and DC components of the red PPG and dividing that by the ratio of the AC and DC components of the infrared PPG.
- Bluetooth- Bluetooth is used to collect data from the PET HB so that it can be further processed to display results on the phone screen.
- Mobile app or Computer- Results will be displayed on the computer or mobile via an application software.
- Internet- Internet service is used to transfer data to the cloud for storage and retrieve it when required and in case of any unwanted consequences automatic emergency call can be generated or can connect to doctors/clinicians or can be applied for telemedicine purposes.
Design Factors considered:
- Regular vital signs monitoring is a common inpatient care intervention, which aims to facilitate the early recognition of abnormal physiological parameters in deteriorating patients. Derangements in vital signs is a known predictor of cardiac arrest and early detection of deterioration has been shown to improve patient outcomes including mortality and quality of life.
- One of the advantages of WHDs for medical purposes and with certifications in the ECG monitoring is the improvement of atrial fibrillation early detection due to longer continuous monitoring periods compared with a yearly single 24-h Holter.
- Nowadays Ag/AgCl electrodes (wet electrodes) are the most commonly used to transduce ionic current from the heart into electron current in metallic wires. Its design and characteristics have in consideration cells low electrical potential difference (from −40 to −80 mV) and skin impedance. These electrodes are very reliable, compact and low cost, but can cause skin irritation due to its wet compound and adhesive properties. During longer periods of acquisition, the gel dries, resulting in a reduction of the contact between the electrode and the skin.
- Holters are the devices normally used for long acquisitions and their main disadvantage is the fact that it interrupts daily life routine, being unfeasible for unobtrusive continuous monitoring. Holter monitors do not allow real-time monitoring or monitoring of other vital signs such as oxygen saturation, blood pressure, respiratory rate and temperature. To overcome this problem, fabric embedded electronics and dry electrodes have been developed using different materials. This type of electrodes does not cause skin irritation, but, as they are not adhesive, artifacts appear due to body movement, making them clinically unfeasible for now.
- To reduce the artifacts produced by body movement and skin irritation, a new technology of dry, flexible and stretchable sensors was developed but still attached to the human skin, making it less viable to use outside the medical diagnose environment.
- A possibility to overcome the adhesive properties is to have a dry electrode without adhesive properties resulting in proper electrodes for wearable applications. Chi et al. developed a wearable, unobtrusive and patient friendly sensor that is able to acquire ECG signals through insulation such as fabric, being this technology firstly reported in 1969. Wearable electrodes are being embedded in textile fabrics where the fiber must be electrically conductive with low current and low impedance. These types of electrodes are normally a bundle of a normal fiber filament, like nylon, electrochemically plated with a metal or entwined carbon fibers. The fiber used in its fabrication must undergo several actions as stretching, bending and twisting, in order to adapt to the body movement, and to be washable.
- Another type of ECG sensors are non-contact capacitive electrodes. These sensors are able to acquire the ECG data without direct skin contact but are more sensitive to motion artifact compared with conventional electrodes as so they are not used in the design.
- Wearable textile devices are cost effective, manufacturable, durable, have long Battery Life, are very comfortable, biocompatible and Secure against user.
Noises Added to Signal are:
- Motion Artifacts
- Powerline Interference
- Baseline wander
To overcome these noise artifacts:
- At present signal processing algorithms have powerful functions in removing motion artifacts. Various processing methods including adaptive filtering, independent component analysis and machine learning have been applied. Adaptive filtering has the function of automatically adjusting its parameters and has been widely used in the field of nonlinear filtering. Generally, adaptive filtering requires additional motion tracking sensors to collect signals as the reference input of the adaptive filter. The MIT [8] used the MEMS accelerometer as a reference channel to reconstruct the signal obtained by their PPG sensor. Yalan Ye [9] et al. proposed a hybrid method combining adaptive filtering and signal decomposition, using a synchronized acceleration signal as a reference signal, and using a nonlinear adaptive filter based on second-order recursive least squares (RLS) to realizes denoising. Independent component analysis (ICA) is a classic algorithm for blind source separation. Its application premise is that the pulse wave signal and the motion artifact signal are independent and uncorrelated, but the motion artifact and the pulse wave signal are not completely independent [9], so they are independent Component analysis has certain limitations.
- Frequency domain method together with the CICA (Temporally Constrained ICA) algorithm to remove motion artifacts in the Electrocardiography (ECG) and exemplified that this method provides better results compared to the basic ICA. In addition, with the rapid development of artificial intelligence, signal processing algorithms based on machine learning have become one of the research hotspots, which brings new solutions to biomedical signal processing, especially the elimination of motion artifacts. Yunsik Son [12] et al. proposed a pulse waveform signal artifact removal model based on a deep belief network (DBN), which includes pulse segmentation, pressure normalization and denoising models using DBN, and applied the model to artifact removal in arterial blood pressure monitoring. Choon- Hian Goh [13] et al. designed a 1-D-CNN (Convolution Neural Network) to automatically learn the intrinsic features of the PPG waveform and perform the required classification and demonstrated the feasibility and effectiveness of applying blind signal processing and deep learningtechnology to PPG motion artifact detection.
- Digital filters are widely used to remove the unwanted frequency components in signals. The combination of different digital filters is called a filter bank. It combines various digital filters such as low-pass filter, high-pass filter, band-pass filter, notch filters, differentiator, and normalizer, etc. The ECG signal frequency component without noise range from 0.1 to 100 Hz [8]. To extract the pure ECG signal information, low bound and high bound filters must be applied according to the based ECG signal’s frequency range. One of the filter bank advantages is that it is straightforward to implement and is highly efficient. However, its drawback is that fixed digital filters could introduce nonlinear phase distortion and key points displacement, which could cause deformation on important waves of the ECG signal such as QRS complex [9]. Moreover, the parameters of the digital filter are tuned specifically for one dataset. It may not work well for the data collected from other devices. Furthermore, the digital filter does not perform well in removing the noises that have a similar frequency to the ECG signal.
- Discrete wavelet transform (DWT) was first introduced by Mallat in 1989. It can be used to analyze non-stationary signals, such as ECG. In Poungponsri combines the DWT with an artificial neural network to remove a wide range of noise. DWT decomposes the signal into detail coefficients to approximate the signal using a wavelet mother function. Each coefficient corresponds to a different frequency range. Therefore, by observing the extracted approximation and detail coefficients, one can easily distinguish the coefficients that contain the ECG signal and the coefficients that contain the signal noise. One could only apply noise removal methods such as a digital filter to the noisy coefficients as the coefficients with the ECG signal will not be affected. Despite the great advantages of DWT, some drawbacks make it hard to use in practice. The first DWT requires to set and select the number of coefficients manually. The second is how to find the most suitable wavelet mother function, which could be different for different ECG signals. These limitations make it hard to automate such an algorithm.
- Empirical mode decomposition (EMD) is an adaptive and entirely data-driven technique that obtains the oscillatory modes present in the data. It was first introduced by Huang in 1998. Similar to DWT, EMD decomposes the ECG signal into many sub-band signals. The high-frequency components of the EMD decomposition are called intrinsic mode functions (IMF), and the low-frequency components are called residual. Unlike DWT, which relies on the mother wavelet functions, EMD does not need to find the best wavelet function or set the number of IMFs since this method is fully data-driven. In 2006, Weng applied the EMD method to the ECG signal to remove high-frequency noise with minimum signal distortion. In 2008, Blanco proved the EMD method could be used for baseline wander correction. However, the number of IMFs may differ for different ECG signals, implying that the IMFs do not have a fixed frequency range. Therefore, human intervention is often required to separate clean and noisy IMFs for signal reconstruction.
- The variational mode decomposition (VMD) was proposed by Dragoniretskiy and Zosso in 2013. It was an alternative approach to the empirical mode decomposition. Unlike the EMD method, the VMD method decomposes the signal from low frequency to high-frequency, where the residual contains the highest frequency component. Therefore, when dealing with the high-frequency noise in the signal, the VMD method performs better than the EMD method. In 2016, Mohan applied the VMD method for the powerline interference on the ECG signal. However, since the VMD method is a variant of the EMD algorithm, human intervention is also required for clean IMF selection.
- Adaptive filtering (AF) takes the original noisy signal and a reference noise signal as input. It then automatically adjusts the filter weights based on the reference noise signal to improve the signal reconstruction. There are three types of AF: least mean square (LMS) filter, normalized least mean square filter (NLMS), and recursive least squares filter (RLS). In 1991, Thakor et al. first introduced the LMS adaptive filter to remove the baseline wander, 60 Hz power line noise, muscle noise, and motion wander. One shortcoming of the LMS adaptive filter is that it is sensitive to input scaling. Therefore, a power normalized least mean squares adaptive filter (NLMS) has been proposed to solve this problem by. The last adaptive filter type is the recursive least square (RLS) adaptive filter. The RLS algorithm has excellent performance when working in time-varying environments but at the cost of increased computational complexity and some stability issues. The above-mentioned approaches work well when the noise is limited to a fixed frequency range. However, if the noise’s frequency is continuously changing, such as those created by motion wander, these methods may not work and their performance with the fixed noise. However, by using a better reference noise signal that is sensitive to motion, one can design an adaptive filter that can automatically cancel the noise for different ECG frequencies. Many researchers, such as, use accelerometer data frequently associated with mobile commercial ECG sensors to implement those filters.
- To automatically reduce the baseline wander and motion artifact, we have developed a new algorithm. The new algorithm consists of two parts: a pre-processing step and a filter step. The pre-processing step contains ECG signal pre-processing and unusable ECG signal detection. The filter step consists of an adaptive empirical mode decomposition and reconstruction step that could automatically decompose the signal without human input to reduce motion wander, a motion-sensitive adaptive filter that uses a 3-axis accelerometer that automatically selects the best reference noise signal to remove motion artifacts, and a variational mode decomposition and reconstruction method to remove high-frequency noise.
Communication protocols to transmit data:
- OSI-Open Systems Interconnection network model is used as a communication protocol here and was established by ISO.
- ISO-OSI model covers network communication aspects.
- Seven Layers of OSI model:
- Layer 1: Physical Layer and MAC Layer (IEEE 802.15.4)-
- The IEEE 802.15.4 protocol is designed for enabling communication between compact and inexpensive low power embedded devices that need a long battery life. It defines standards and protocols for the physical and link (MAC) layer of the IP stack.
- It supports low power communication along with low cost and short-range communication. In the case of such resource constrained environments, we need a small frame size, low bandwidth, and low transmit power.
- Transmission requires very little power (maximum 1mW), which is only one percent of that used in WiFi or cellular networks. This limits the range of communication. Because of the limited range, the devices have to operate cooperatively in order to enable multi-hop routing over longer distances. As a result, the packet size is limited to 127 bytes only, and the rate of communication is limited to 250 kbps.
- The coding scheme in IEEE 802.15.4 has built in redundancy, which makes the communication robust, allows us to detect losses, and enables the retransmission of lost packets. The protocol also supports short 16-bit link addresses to decrease the size of the header, communication overheads, and memory requirements.
- Layer 2: Adaptation Layer-
- IPv6 is considered the best protocol for communication in the IoT domain because of its scalability and stability. Such bulky IP protocols were initially not thought to be suitable for communication in scenarios with low power wireless links such as IEEE 802.15.4.6LoWPAN, an acronym for IPv6 over low power wireless personal area networks, is a very popular standard for wireless communication. It enables communication using IPv6 over the IEEE 802.15.4 protocol.
- This standard defines an adaptation layer between the 802.15.4 link layer and the transport layer. 6LoWPAN devices can communicate with all other IP based devices on the Internet. The choice of IPv6 is because of the large addressing space available in IPv6. 6LoWPAN networks connect to the Internet via a gateway (WiFi or Ethernet), which also has protocol support for conversion between IPv4 and IPv6 as today’s deployed Internet is mostly IPv4. IPv6 headers are not small enough to fit within the small 127 byte MTU of the 802.15.4 standard. Hence, squeezing and fragmenting the packets to carry only the essential information is an optimization that the adaptation layer performs.
- Specifically, the adaptation layer performs the following three optimizations in order to reduce communication overhead:
- Header compression : It defines header compression of IPv6 packets for decreasing the overhead of IPv6. Some of the fields are deleted because they can be derived from link level information or can be shared across packets.
- Fragmentation: the minimum MTU size (maximum transmission unit) of IPv6 is 1280 bytes. On the other hand, the maximum size of a frame in IEEE 802.15.4 is 127 bytes. Therefore, we need to fragment the IPv6 packet. This is done by the adaptation layer.
- Link layer forwarding: 6LoWPAN also supports mesh under routing, which is done at the link layer using link level short addresses instead of in the network layer. This feature can be used to communicate within a 6LoWPAN network.
- Layer 3: Network Layer-
- The network layer is responsible for routing the packets received from the transport layer. The IETF Routing over Low Power and Lossy Networks (ROLL) working group has developed a routing protocol (RPL) for Low Power and Lossy Networks (LLNs).For such networks, RPL is an open routing protocol, based on distance vectors. It describes how a destination oriented directed acyclic graph (DODAG) is built with the nodes after they exchange distance vectors. A set of constraints and an objective function is used to build the graph with the best path. The objective function and constraints may differ with respect to their requirements. For example, constraints can be to avoid battery powered nodes or to prefer encrypted links. The objective function can aim to minimize the latency or the expected number of packets that need to be sent.
- The making of this graph starts from the root node. The root starts sending messages to neighbouring nodes, which then process the message and decide whether to join or not depending upon the constraints and the objective function. Subsequently, they forward the message to their neighbours. In this manner, the message travels till the leaf nodes and a graph is formed. Now all the nodes in the graph can send packets upwards hop by hop to the root. We can realize a point-to-point routing algorithm as follows. We send packets to a common ancestor, from which it travels downwards (towards leaves) to reach the destination.
- To manage the memory requirements of nodes, nodes are classified into storing and non-storing nodes depending upon their ability to store routing information. When nodes are in a non-storing mode and a downward path is being constructed, the route information is attached to the incoming message and forwarded further till the root. The root receives the whole path in the message and sends a data packet along with the path message to the destination hop by hop. But there is a trade-off here because non-storing nodes need more power and bandwidth to send additional route information as they do not have the memory to store routing tables.
Layer 4: Transport Layer- TCP is not a good option for communication in low power environments as it has a large overhead owing to the fact tha
- that it is a connection-oriented protocol. Therefore, UDP is preferred because it is a connectionless protocol and has low overhead.
- Layer 5: Application Layer-
- The application layer is responsible for data formatting and presentation. The application layer in the Internet is typically based on MQTT-SN.
- Message Queue Telemetry Transport: MQTT is a publish/subscribe protocol that runs over TCP. It was developed by IBM primarily as a client/server protocol. The clients are publishers/subscribers and the server acts as a broker to which clients connect through TCP. Clients can publish or subscribe to a topic. This communication takes place through the broker whose job is to coordinate subscriptions and also authenticate the client for security. MQTT is a lightweight protocol, which makes it suitable for IoT applications. But because of the fact that it runs over TCP, it cannot be used with all types of IoT applications. Moreover, it uses text for topic names, which increases its overhead.
- MQTT-S/MQTT-SN is an extension of MQTT, which is designed for low power and low-cost devices. It is based on MQTT but has some optimizations for WSNs as follows. The topic names are replaced by topic IDs, which reduce the overheads of transmission. Topics do not need registration as they are preregistered. Messages are also split so that only the necessary information is sent. Further, for power conservation, there is an offline procedure for clients who are in a sleep state. Messages can be buffered and later read by clients when they wake up. Clients connect to the broker through a gateway device, which resides within the sensor network and connects to the broker.
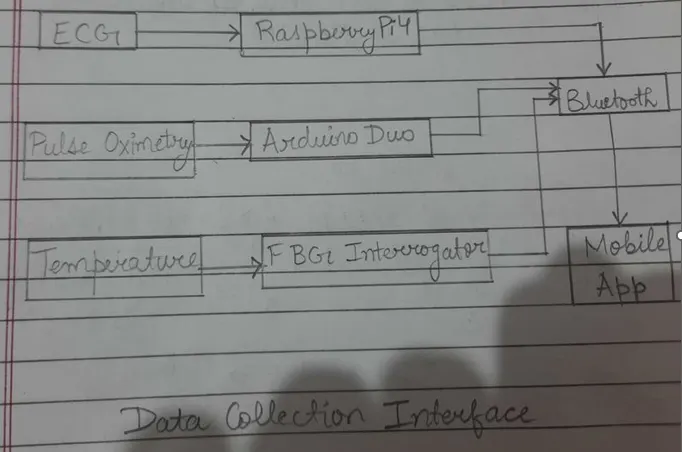
Flow diagram of how data acquisition is proposed and how data will transmit wirelessly
Hardware section:
The initial prototype system consists of a low power Network Interface Card(NIC),an Arduino Duo for Pulse oximetry, a Raspberry Pi 4 for ECG, Cuffless BP & HR and an interrogator for Temperature sensor. The other components are the power supply unit (i.e. battery) with a smartphone with an application.
The Raspberry Pi 4, Arduino Duo simply serves as an Analog to Digital Converter (ADC). Both are an open-source physical computing platform based on a simple I/O board and a developmental environment that implements the processing/wiring language. The Arduino and Raspberry are programmed to read analog signals from the pulse and ECG sensors respectively and create data packets to convert the signals into digital form. Subsequently, they send those packets to the phone as a response to the data sending request. They also manages the Bluetooth and NIC communication by coordinating with the NIC Card. The NIC basically equips the Arduino and Raspberry with the ability to connect to the smartphone application.
The data read from the sensors is always an analog value between 0 and 5 volts since that is the operating voltage of the microcontroller. The Arduino and Raspberry then map those voltage values to digital values ranging from 0 to 1023. Since the y-axis for ECG signals is also a voltage, all we had to do is scale the digital values to back voltage.
To avoid the inaccuracy in simultaneous reading from multiple analog pins, we not only need a delay between each reading, but also need to read from the same analog pin twice. We read the temperature data from the sensor twice and send the second reading, then do the same for the ECG sensor. We need to send different symbols before the sensor readings to be able to parse the data at the receiving end (android application). Before sending a ECG reading we send a ‘/’ and before sending a Pulse oximetry reading we send a ‘-’, which makes data parsing simple.
In case to transfer data from the interrogator for the body temperature, the sensor device sends data directly to the mobile phone using BLE (Bluetooth Low Energy). This usually requires a dedicated app on the phone, but no special setup, the app can scan for devices matching yours, connect, retrieve data and so on automatically. One can probably want a way to “authenticate” so that only the rightful owner can talk to the device (either some kind of pairing code, or a button to activate a pairing period...).
Software:
To receive and analyze data from the IoT device (PET HB), we use an ECG, Pulse Oximetry and body temperature collector interface in the smartphone. As described in the hardware section, we developed a NIC communication channel that is capable of transmitting data from the ECG, pulse oximetry and temperature sensors to the smartphone. On receiving data from the sensors via Bluetooth(BLE), the system processes the data to identify any abnormality in the ECG, Pulse Oximetry or temperature directly and will identify abnormality in Heart Rate(HR) and Cuffless Blood Pressure(BP) after estimating HR and Cuffless BP using algorithms from ECG Data collected.
To transmit data to the smartphone through Bluetooth channel, we opened a socket from the Android application that connected to the transmitting signals of the Bluetooth module.
To communicate with the Arduino, Rapberry and FBG interrogator, we created a software serial object and specified the transmitting and receiving pins. When the Bluetooth is supplied with power, it immediately enters the pairing mode, where it waits for any device to connect to it. Then the smartphone Bluetooth adapter is opened through the application and it starts searching for the devices. After a successful connection, the application will produce a message on the screen informing the user that the connection was successful.
After connecting to the IoT device, the application will automatically start receiving the sensors’ data. The application parses the ECG, HR, Cuffless BP, temperature and pulse data into separate arrays that are then sent to different pages where they are plotted in real time. The user has the option of either viewing the separate plots for each sensor data or viewing a page that has all plots in real-time. While data is being plotted, the algorithm is constantly examining the signals waiting for any abnormality.
The user will have the option of either signing up or logging in depending on whether the user has an account or not. If the user has an account s/he can simply enter the username and password to login. If not, clicking on the sign-up button will take the user to another page where s/he will be asked to enter some information to create an account. The user will then be directed to the home page of the application where s/he will have different options. The user will need to connect to the IoT device before s/he can start viewing his/her data. This can be done by pressing the connect button which will take the user to another page where s/he can find the device.
In the connect page, at first the user needs to turn on the Bluetooth of the Android device. By pressing the “TURN ON” button, the Android device will respond to the application’s request, asking the user if the application can open the Bluetooth and by hitting yes, the Bluetooth turns on. The user can then go to the home page where he/she will have several options between viewing his/her real-time plots of the sensed data or going to the decision page. The decision page will basically have information that describes the user’s current health status. The time axis in real-time graphs shows that the graph retrieves the current time from the Android device and displays it in real time as the axis moves with incoming data points.
Data Collection Interface:
The sampling frequency or rate at which we are collected sensor data is the key challenge in data collection process. For our system, we send the data from all the three sensors simultaneously, so intuitively, the sampling rate for our system would be less than the sampling rate of a system that reads data from just one sensor. Given that the body temperature does not undergo as many changes as the ECG signal or pulse oximetry, we increased the ECG’s sampling rate by decreasing the temperature’s sampling rate. We fixed the sampling rates for the temperature sensor, pulse oximetry and the ECG signal at 5 Hz, 40Hz and 160 Hz, respectively. Figure shows the block diagram that describes the sensor data collection interface. The Bluetooth chip is also connected to the Arduino, Raspberry Pi 4 and FBG Interrogator which enables the IoT device to transmit the sensed data to the smartphone application.
First, the user wears the PET HB as described in the hardware section and then uses the application to connect to the Bluetooth interface as described in the software section. From this point the user only needs to interface with the application where he/she can navigate through the different options.
Data Acquisition:
Temperature Data:
In this subsection, we present the detailed data for our temperature sensing process. Temperature does not need much analysis except for converting the data points to the time domain and smoothing the signal for better visual representation. The “noisiness” in temperature signal indicates a need for smoothing.
ECG:
Data Analysis Techniques:
Our data analysis was mostly done using MATLAB. In signal processing, noise is a general term for unwanted alterations that a signal may suffer during collecting, storing, transmitting, or processing data. We collected data from analog sensors and transmitting them over a low power Bluetooth communication channel. We need data enhancement techniques before we can start analyzing the data as the reading can be affected by noise through the process. Since temperature values do not usually have many fluctuations, we are more concerned about the enhancement of the ECG signals:
- Noise Reduction Filtering: Extracting features from a noisy signal can give a heart rate of 200 when the actual heart rate is 80. Therefore, we ensure that, before we send our signal to the feature extraction method, almost every unwanted part of the signal is removed.
- Baseline wander removal: The baseline wander is a problem that shows ECG signals in a wavy fashion rather than being more of a constant envelope. A high pass filter to the signal improves the “look” of the signal because it removes the low frequency component that manifests itself as a sine-like pattern of the baseline. Removing the baseline wander gives a better signal which can help us process data more accurately. Equation(1) below describes the process of reducing noise using base line wander, where ⍵c is the cut-off frequency and N is the filter order:
- [H(⍵)]2=1/[1+(⍵c/⍵)2N] ……………………………………………………..(1)
First, we smooth the signal using the MATLAB built in function ‘smooth’, which gives us the sine-wave-like signal, then we subtract that sine-wave-like (low frequency component) from the collected ECG signal.
- Removal of High Frequency Component: The time domain operation of a low pass filter for signals is the mathematical operation called the moving average (often addressed to as smoothing). The enhanced version was achieved by applying a low pass filter with a very satisfying result as can be seen in the plot. The key when using high pass or low pass filters is to choose the correct cut-off frequency. Choosing the wrong cut-off frequency can result in huge alterations in the signal and irrelevant or, worse, erroneous data decisions. Equation(2) describes the operation of low pass filtering:
- [H(⍵)]2=1/[1+(⍵/⍵c)2N] ……………………………………………………..(1)
We apply a moving average which is achieved by using the smooth function in MATLAB. Using the correct window for smoothing is essential as it can affect the signal’s expected output. For the ECG signal we used a smoothing window of 20 data points.
Heart Rate:
Extracting features: After noise reduction, we extracted heart rate, RR intervals, and ST segments from ECG signals. We used these features as inputs of our prediction algorithm along with the body temperature. In the next subsections, we describe the process of extracting features from the ECG signal.
We extracted heart rate or Beats per Minutes (BPM) from collected ECG signals. We can calculate BPM using several techniques including taking the number of QRS peaks in a given time, using autocorrelation, or using Fourier transform. The first technique sometimes yields inaccurate results; however, when a signal has no baseline wander problem, this technique should work. Autocorrelation and Fourier transform techniques yield very accurate results.
- Autocorrelation: In autocorrelation, a signal is correlated with a shifted copy of itself as a function of delay or lag. Correlation indicates the similarity between observations as a function of the time lag between them. We used this technique to analyze our data as the collected ECG signals are periodic. First, we calculate the difference between two peaks which gives the length of one period in data points. Dividing that number of data points by the sampling frequency gives us the time in seconds of one period. Inversing and multiplying it by 60 give us the total beats per minute. The mathematical equation(3) for the autocorrelation function for signal processing is shown:
- ……………………………………(3)
The equation shows the summation of the product of a signal and a shifted version of it. From the equation, one can intuitively understand that, at lag zero, the signal will have the highest amplitude since it is a multiplication of itself without any shift.
- Fourier Transform: The Fourier transform extracts the frequencies and harmonics of the signal. So, we find the location of the maximum harmonic in the frequency plot.
The first significant harmonic in the signal is shown approximately around 0.92 (the red circle) as shown in Figure below, which represents the beats per second. Simply multiplying this by 60 gives us the beats per minute. The other peaks in the signal represent either noise or information are irrelevant in terms of calculating the heart rate.
Fourier transform of an ECG signal.
The equations for the Fourier and inverse Fourier transforms are shown below in (4) and (5), respectively.
Where is the frequency domain of a given signal and f(t) is the time domain of the signal. For our data analysis, we used an “fft” function in MATLAB that gives us the plot of the signal in the frequency domain. From there, we get the location of the maximum harmony and multiply it by 60 to get the beats per minute.
- R-R Interval: Another feature that we extracted from the ECG signal is called the R-R interval, which is the interval between successive R peaks in an ECG signal. For normal ECG signals, the R-R intervals do not fluctuate or suddenly change in a drastic manner. We recorded R-R intervals by having the standard deviation of the signal. Figure below gives a visual representation of an RR interval.
R-R interval of an ECG signal
Basically, we find the R peaks and subtract the peaks locations in time, giving us the duration between each beat. We find the peaks using a threshold value that ensures that all the R peaks are included. To do that, we get the maximum of the signal and subtract it by a specified percentage to ensure that all the intervals are above the threshold value. The reason for this was because not all the R peaks have the same voltage value, the voltage values of the peaks usually fluctuate which is why we dynamically calculate that threshold value based on the portion of the ECG signal with which we are dealing. We create arrays that store the R-R intervals of the ECG signal to calculate the variability of the durations.
- ST Segment: Also, another feature is that we extracted ST segment voltage value from the ECG signals. We take the ST segment into consideration for heart attack predictions since elevated ST segments are one of the biggest indicators of heart attacks. Figure below shows the sample data from one of our test subjects. To calculate the ST segment voltage value, we take the average of the points shown in the rectangle.
Sample ECG with R-R interval and ST segment.
This produces a number that represents the ST segment voltage value. The R-R interval is basically the range between both peaks. We take a 20 percent from that range and add it to the location of the first peak which gives us the point where we would start adding the voltage values. Then we take 50 percent of the range and subtract it from the location of the subsequent peak, which gives us the point where we would stop adding the voltage values. Those voltage values are shown in the box in Figure above.
After adding all the voltage values, we divide by the number of points to get the average voltage value representing the ST segment. Typically, the voltage values of a normal ECG would be much lower than the voltage values of an ECG with an elevated ST segment. We also use a standard deviation analysis to detect if an ST segment suddenly changed. Note that using percentages of the R-R interval to get the locations of the ST segment voltage values and then averaging them is not a conventional way to calculate the voltage value of the ST segment. This is based on our analysis, which used trial and error, and that method to extract the ST segment voltage value provided us with the best results.
Pulse Oximetry:
- In this project, a reflectance-based pulse oximeter was built and used to collect measurements in real-time. It can accurately measure within an error of + 1% and ±3% for SpO2.
- In reflectance-based pulse oximetry, the incident light is passed through the skin and is reflected off the subcutaneous tissue and bone. Such a device would allow patients to measure SpO2 without hindering their normal day-to-day activities.
- Pulse oximetry measures arterial oxyzen situration based on the light of blood. When it combines with oxygen, deoxyhemoglobin (Hb) changes its light absorption characteristics. Pulse oximetry exploits the light absorption difference between Hb and oxygenated hemoglobin (HbO2). HbO2 absorbs more infared light (660 nm wavelength) and lesser red light (940 nm wavelength) than Hb. In the transmissive mode, light from a pair of red and infrared light-emitting diodes (LEDs) is transmitted through a fingertip. Then, the transmitted light is received by a photodiode on the opposite side. The transmitted light signals consist of a direct current (DC) component and pulsatile alternating current (AC) component. Pulse oximetry calculates the modulation ratio R by using the DC and AC components of the red and infrared signals as follows:
- R=(ACR/DCR)/(ACIR/DCIR),
- where ACR and ACIR are the AC amplitudes of the red and infrared signals, respectively DCR and DCIR are the DC offsets of the red and infrared signals, respectively. Then, empirically derived are used to estimate SaO2 based on the modulation ratio R, as seen in . ACR and DCIR increase with decreasing SaO2, as seen in (b). On the other hand, ACIR and DCR decrease.
Cuffless BP:
- Blood pressure has to be measured continuously, so it is not possible to use cuff-based technique.
- So it is done by measuring Pulse Transmit Time(PTT) or Pulse wave velocity. PTT is the time taken by the pulses to reach from the heart to the extremeties.
- Peak of ECG waveform gives ventricular contraction time, when heart will pump the blood of the heart and will conduct to various systems of the body.
- ECG will be recorded instantaneously whereas pulse peak will be recorded at delayed version. Here, the time difference between the qrs peak and peak of the PPG waveform is measured, then PTT has to be estimated. PTT is measured effectively between R peak to the PPG peak, delay has to be taken into consideration. This delay will be taken as PTT.
- PTT depends on various factors:
- Heart Rate(HR) of a person
- Thickness(or density) of blood
- The length of region from the heart to the extremity(from finger tip, toe tip or ear lobes)
- Age of the person
- Height of the person
- BMI will have larger effect on it.
- Based on the calibrations, PTT will be calculated based on PPG and ECG waveforms.
- Systolic and Diastolic pressure can be calculated using known equations based on the blood velocity at which it travels from heart to the extremeties and the blood volume changes that are happening.
As the blood flows through arteries, pressure waves propagate at a certain velocity called pulse wave velocity (PWV). The PWV depends on the elastic properties of both arteries and blood. The Moens–Korteweg equation defines PWV as a function of vessel and fluid characteristics:
PWV= L/PTT= Under root of (E.h/2rρ)...........................(1)
where L is the vessel length, PTT is the time that a pressure pulse spends in transmitting through that length, ρ is the blood density, r is the inner radius of the vessel, h is the vessel wall thickness, and E is the elastic modulus of vascular wall. In this equation, the elasticity parameter E is closely related to BP according to the following equation:
E = E0eαp .................................................................(2)
where α is a constant, E0 is the zero-pressure modulus of the vessel wall, and P is the BP within the vessel.
Based on these two equations, the BP can be computed from PTT assuming all other parameters are held constant. From (1) and (2), we can obtain a logarithmic dependency between BP and PTT:
BP = [-(2/α).lnPTT]+ln (2rρL2/hE0)/α
There are many physical factors that influence cardiac output and BP, such as the blood volume, resistance of the blood vessels, and blood thickness. BP is the product of cardiac output and peripheral resistance. In practice, each individual's autonomic nervous system responds to and regulates all these interacting factors. When BP decreases, the nervous system is stimulated. In response, HR increases in an effort to increase cardiac output and the arterial walls contract to increase BP. In other words BP is related to both HR and previous BP:
BPn = a · lnPTT + b · HR + c · BPn−1 + d.......................(3)
where PTT can be obtained from the time difference between ECG and PPG signals, HR can be easily measured from the ECG, and BPn−1 is the previous BP estimate. The four coefficients (a,b,c and d) can be calculated by applying the least square method.
Use Cloud Computing to build intelligence in data received from IoT sensor, features to be build in system.
- Cloud computing has established and expanded to present a platform to facilitate applications in storing and processing data. IoT sensors usually depend on cloud computing to store and process data.
- The aim of the integration of IoT and cloud computing is turning some ordinary resources like sensors, work processes, and machines to smart things, and entitling customers with reliable and flexible deciding tools.
- IoT architecture is illustrated by four groups of connecting systems including the cloud, network, gateway, and devices. Cloud computing proposes a valuable solution for managing IoT services and tackling applications and service composition.
- Since, IoT facilitate connecting heterogeneous objects, this will allow the cloud to connect to physical objects. Cloud computing with its unlimited virtual capabilities and resources can facilitate IoT to cover its technological limitations such as energy, processing, and storage.
- Applications with utilising things and data produced by them are handled specially by cloud computing as well as IoT service management and composition. However, IoT can help the cloud by its global extent and deal with the physical sensors by its dynamic and distributed techniques for rendering new services in a huge amount of real scenarios.
- While driving, walking alone outside or when there is no one at home, if a child or an elderly person are alone at home. In that case wearables are of great help and PET HB will prove to be so.
- Monitoring the patients and assisting them in case of emergency can be solved by using PET HB with cloud-based communication. It consist of sensors which are capable of monitoring the physiological vital signs, these sensors are placed on the human body which are designed to provide the most accurate results, when these variable devices are combined with wireless transmission like Bluetooth through cloud-based communication will help monitor and assist the patients remotely in case of medical emergencies.
- PET HB is a combination of hardware and software which play a major role in helping us to detect the medical condition prior to serious symptoms.
- The innovation of internet has led to many possible techniques in the cloud platform. The cloud platform plays a major role in storing the data and accessing it, by storing and monitoring all the wearable sensor data in the cloud would make it easier for health professionals to access and retrieve data anywhere in the world.
- Here we can use cloud applications, SaaS(Software as a Service) low cost health monitoring system along with the particle cloud platform and access it using commonly used the device to solve the problem on detecting the occurring heart rate variability in advance.
- If the data is analyzed while driving as serious or critical data then the Mobile app will initiate commands to the microcontroller to take necessary actions, to control the situation and inform the ambulance or Emergency service for help.
- The serious condition is assisted by enabling the Mobile app to locate and route to the nearest hospitals for the driver to drive. However, while driving if the continuously monitored data by the cellular connected cloud platform detects a critical condition it sends out CAN messages to the vehicle to activate the auto pilot to pull over for immediate assistance.
- PET HB will automatically update the software as per requirement using cloud based application.
- As the number of IoT devices and automation in use grows, security concerns emerge. Cloud based solutions provide companies with reliable authentication and encryption protocols.
- IoT cloud computing is convenient because we can get exactly as much from the service as much we pay. This means that costs vary depending on use: the provider measures the usage statistics. A growing network of objects with IP addresses is needed to connect to the Internet and exchange data between the components of the network.
Create a scenario on how an emergency situation will be handled and flow of events, when abnormal values are acquired. False alarm handling.
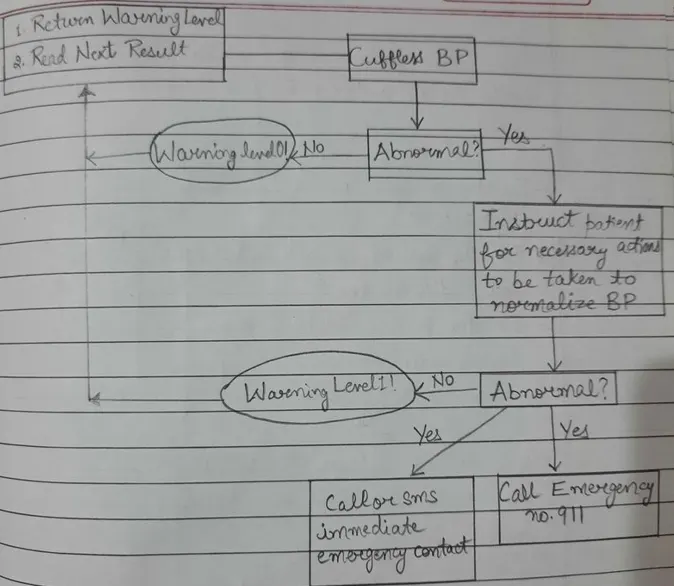
Suppose an old man who was wearing PET HB, has a sudden fall in BP, then the following events will be followed by a wearable IoT device:
False alarm(FA) can be detected by the wearable device itself after rechecking few components in the device.
To calculate the FA we defined four indicators of false alarms.
The main events that cause false alarms are patient movement or repositioning in bed and poor placement of sensors. Another common issue that triggers alarms is related to technical problems, such as lack of a battery in the monitoring devices.
The four FAs defined in this case study represent information about (1) the duration of a sensor battery and the last time it was changed, (2) the last correct readings of the parameters and the time when it was taken,(3) the patient’s mobility, and (4) the patient’s position in bed.
To calculate the FA percentage in our experiments, we considered each indicator to have the same weight. The FAs are listed below:
- FA1: Sensor battery FAI (SENSOR_BATTERY_FAI). This is an indication of the FAP associated with the battery-charge level of the sensors attached to the patient.
- FA2: Placement of sensor FA%. FA2 is related to the placement of a sensor (ie, whether a sensor is properly in touch with the patient’s skin).
- FA3: Patient mobility FA %. This indicator is related to patient mobility, which means that it can evaluate the probability that the alarm has been triggered due to his or her movement from the bed to other places.
- FA4: Patient repositioning FA %. This indicator can be used to calculate the FA parameter(FAP) related to patient repositioning (ie, whether the alarm has been sent simply because the patient may have changed his or her position in bed).
Method for storing data in centralized database.
- A centralized database is where the information is collected, stored, and maintained in one location but is accessible from many points. Centralized data systems allows information to exist inside one mainframe but remain accessible from numerous points. The content gets collected, stored and managed in one place, but centralization does not impact the ability of an authorized user to access the content from anywhere in the world.
- It stores and processes data in a large environment and provides data privacy and integrity. Centralized big database is responsible for managing the entire database in the network.
- Data can be centralized via use of cloud computing. Clod can provide services over private or public networks. It can work on LAN, MAN and WAN.
- It is online application for data manipulation, computing, processing and configuring. It is facility for data storage, infrastructure and applications. It has both hardware and software based services.
- With SaaS, you are simply accessing software over the Internet that is offered and maintained entirely by the cloud provider. The type of software can include e-mail, content management systems, productivity software and business applications. SaaS requires the least amount of setup on the end-user's part, but also provides the least amount of control and flexibility as far as system functionality, and what can be uploaded or downloaded from the cloud.
SaaS:
- SaaS is a cloud computing service that allows for the on-demand use of application software. A person pays for SaaS on a subscription basis, giving him/her the flexibility to try different software and alter the tools he/she use based on what he/she needs at a given time. He/she access the application software hosted in the cloud through a web browser, a dedicated desktop client, or an API. An example of SaaS is using Zoom or Cisco WebEx to host video meetings for a company.
- Most application software under SaaS can be downloaded directly through a web browser. As a user, he/she benefit from not having to work through lengthy installation instructions and not having to wait for the software to download on the computer.
- Updates to the software, security patches, and routine maintenance are all handled by the cloud provider, saving you time and effort. The cloud provider hosts and fully manages the software applications and their underlying infrastructure.
- Start-ups or smaller companies that may not have the human capital, time, or money to create and manage personalized software applications for themselves can effectively use SaaS. SaaS will enable a person, as a start-up, to quickly pick and choose what tools a person needs to use to begin to grow his business. Additionally, any short-term project would benefit from SaaS because it provides a fast, affordable, and flexible solution to many problems.
- Since SaaS is usually paid for through a subscription model, I will only have to pay for application software when I need it for short-term projects. This will reduce the up-front cost that startups or smaller companies will need to get their business off the ground. SaaS is also a beneficial option for applications that are not used frequently, such as tax software.
- Beyond providing reliable and trustworthy services, the top SaaS providers can advance their products to meet the changing needs of us and our business. They offer on-demand services that eliminate the need for installing and updating software, giving us a frictionless experience. The most commonly used and trusted SaaS Providers are: Salesforce, Google Workspace, Cisco WebEx, Concur, Adobe Creative Cloud, Dropbox, etc.
Data Retrieval from Centralized Database
- Cloud storage services allow the users to outsource their data in the cloud storage servers and retrieve them whenever and wherever required. This avoids the cost of building and maintaining their data store. But the users need to provide privacy for the data and also to be able to search it without losing privacy.
- The users always search their documents through keyword in plaintext, which may leak privacy of users in cloud storage environment. So, allowing a cloud service provider (CSP), whose purpose is mainly for making a profit, to take the custody of sensitive data, raises underlying security and privacy issues.
- To keep user data confidential against an untrusted cloud, a natural way is to apply cryptographic approaches, by disclosing the data decryption key only to authorized users.
- An efficient, secure and privacy preserving keyword search scheme which supports multiple users with low computation cost and flexible key management.
- The proposed system architecture consists of three entities:
- Data owner: Data owner has collection of data files that he wants to outsource into the cloud server. For data privacy files must be encrypted before uploading to cloud. To enable CSP, keyword search on these encrypted files, a searchable index is built before encryption and is outsourced to CSP along with encrypted files.
- Data user: User is one who wants to retrieve files relevant to a specified keyword. For this he enters a keyword and sends the request to CSP.
- Cloud Service Provider (CSP): Upon receiving the search request, the cloud server is responsible to search the index and return the corresponding set of encrypted files to the user.
The system is designed and implemented in the following steps:
- User Registration:- In this module mechanism for registration of new user to the system is provided. User has to first register himself to the system to upload or retrieve data to or from cloud. User has to enter valid Email-id and password during registration. When a new user registers to the system, a confirmation mail is sent to the user specified email-id. This mail is used to confirm that the email-id is valid. This mail contains a link and on clicking the link the user will be activated. A list of registered users is sent to the cloud service provider and this list is used by CSP to authenticate users when they login and request for service.
- Building Searchable Index and Outsourcing Data to CSP:- For data privacy, files are encrypted before outsourcing them to cloud. However, encryption makes effective data utilization a challenging task. To enable the cloud service provider to efficiently search files with specified keyword from an encrypted file collection, a searchable index is built before file encryption and is stored at CSP. The CSP will retrieve the exact files containing the specified keyword using the searchable index. The searchable index stores list of mappings from keyword to the corresponding set of files that contain the keyword, allowing full text search. In our system secure AES symmetric encryption algorithm is used to encrypt the data files, same key is used to encrypt and decrypt a file. Encryption is done at user side.
- Authorization and Efficient Data Retrieval:- In this module a mechanism to authorize a user and to efficiently retrieve data files for the users at the CSP is developed. User has to first login to the system to avail services from cloud. When a user logs in to the system CSP uses registered users list to authorize users. The authorized user can then outsource or search files to or from CSP. When the user sends a request to the CSP to retrieve files containing a keyword, the CSP first searches the searchable index, gets the file ID’s of files relevant to the user specified keyword, efficiently retrieve encrypted files and sends them to the requesting user in a rank order i.e. top files are more relevant than other. Files will be decrypted using decryption algorithm and downloaded at the user end.
- Analysis of the System:- The analysis is done on the following parameters:
- Security analysis: Data confidentiality is analyzed by comparing with standard encryption algorithms that use symmetric keys.
- Performance analysis: Performance of our proposed system is calculated based on the efficiency. This includes time and cost for searching the matching’s. The computational complexity of searching and building the searchable index is calculated.
Method for automatic detection of abnormal conditions in the parameters and generation of alarms. How is the system programmed for handling of emergency:
The algorithm is the most important part of the system. The algorithm functions as shown in the flow chart. The first step is to read the data from the sensors at 5 Hz for the temperature data, 40Hz for Pulse oximetry and 160 Hz for the ECG data. We then maintain a sampling window of 5 seconds on which to perform all computations. After selecting the sample window, we reduce the noise by applying the filtering techniques. After removing all the noise components from the signals, we extract the three features from the ECG and pass on those features along with the temperature and oxygen saturation data to our prediction algorithm. If the results from the algorithm indicate that the current sample window is normal, the window shifts by 1 second and takes the next 5 seconds of data. If the algorithm detects an abnormality, it immediately warns the user. Using a moving window of 1 second creates the need more computation but it provides faster and more accurate feature extraction and prediction results. This means the next sample window will have 1 second of new data and 4 seconds of data from the previous sample window.
Our prediction algorithm is based on a predictive machine-learning model called J48 Decision Tree. This model decides the target value of a new sample based on various attribute values of the available data. We apply that model to our algorithm with the result that the target value would indicate whether the patient is having a heart attack or not, and the available data would be contained in the extracted features. We note that the decision tree is a general model that can be used in many applications in many different ways. We designed a novel algorithm; Heart Attack Prediction using a Decision Tree based on a Standard Deviation Statistical Analysis (DTSDSA); that uses the decision tree model with a standard deviation statistical analysis. We examine the method by which the extracted features are processed at the decision tree. Using a standard deviation statistical analysis, we determine whether the features are abnormal or normal. Our algorithm uses warning levels from 0 to 4 to determine the degree of abnormality for each incoming window:
Security Aspects I would propose to build in this system.
- I would propose to encrypt my PET HB with two step or three-step verification method. So that data cannot be leaked due to security issues. It will be decrypted or opened only by password, PIN or any other method like face recognition or fingerprint or another key that identifies me as the owner of the information.
- When a person sets a pin or passcode on his/her device and set up fingerprint or facial recognition, this is used to generate the key for encrypting and decrypting the device.
- Encrypted devices make it much harder for cybercriminals to gather the personal information of a person because it is very difficult to decode data encryption.
- Both Android and iPhone devices fully support encryption out of the box nowadays.
- Pet HB will have a specific IP address, so that it should get easily configured and available.
- It will have a password to get it connected to the mobile phone, so that not everyone will connect to the same device.
Procedure to launch the product in the market.
PET HB has to be certified by medical device regulatory bodies for its launch in the market.
It has to be certified by:
- Food & Drug Administration (FDA).
- International Electrical Commission (IEC)
- Underwriters Laboratories (UL)
- European Standards(EN), etc.