Project 1 - Design and Develop an IOT-based Wireless Wearable Health Monitoring System
Design and implementations
Sensors
Heart rate sensor
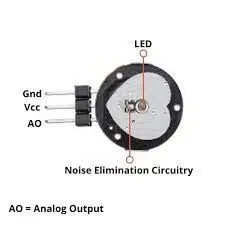
Heart pulse rate sensor that is utilized in this project (MAX30102) is a non-invasive optical device (figure
2) used for achieving two main functions, detecting the heartbeats and peripheral capillary oxygen
saturation (Spo2). There are two non-invasive methods for calculating the heart rate and Spo2 values,
transmitted mode and reflected mode (figure 3). The sensor is used in this project uses reflected mode.
Figure 2. Max30102 sensor
Figure 3. Non-invasive reflected light measuring
3rd International Conference on Sustainable Engineering Techniques (ICSET 2020)
IOP Conf. Series: Materials Science and Engineering 881 (2020) 012113
IOP Publishing
Heart rate and Spo2 connected to the Arduino UNO and NodeMCU
For measuring the reflected light, this sensor utilizes two types of lights, red and infrared. The red light
has a wavelength of 650 nm and the infrared light has a wavelength of 950 nm. Oxygen-saturated
hemoglobin (oxygenated blood) and non-oxygen-saturated hemoglobin (deoxygenated blood) absorb
different amounts of each light. So, the reflected light will be received by the sensor and through an
algorithm, the final value for the Spo2 will be deducted.
For calculating the heart beats per minute another approach is used. The blood needs high pressure to
be pumped out of the heart to other body members. It occurs with the heartbeat and it causes the arteries to
feel an amount of strain (blood pressure) when the blood flows in them. Arteries are responsible for
carrying the blood out of the heart. So, the blood pressure leads to swelling and contracting of arteries,
therefore the volume of the artery in the body parts (fingertip in this project) increases and reduces. When
the volume increases, there will be more hemoglobin in the section area and consequently, the amount of
absorbed infrared light will rise and the reflected signal back to the heart rate sensor will be reduced.
These variations in the reflected light will result in a fluctuated signal called photoplethysmogram (PPG).
Figure 5. Reflected light from the artery
Figure 6. The light absorption of arteries,
veins, tissues, and bones
It is important to note that there are also tissues, bones and venous blood surrounding the arteries and
some amount of the applied light from the sensor is also absorbed by them. Nonetheless, these members
do not produce an alternated reflective light and they just are DC elements of the signal (direct signal
without fluctuations) and can be easily bypassed by the sensor circuit or in the signal processing stage
(figure 6).
Figure 7 shows a flowchart describing the process of calculating the heart rate beats per minute. For
achieving this task, the PPG wave is filtered by a low pass filter, so we can obtain noise reduced waves to
measure the heart pulse rate. Then the maximum and minimum peaks of these waves are detected. By
checking their peaks, the validity of an actual heart pulse is determined. In order to measure the interval
between pulses, at least two consecutive heart pulses must be correctly detected. Then the last twelve
intervals will be stored in an array and the median of these intervals is calculated. In this project instead of
calculating the average, the median calculation is used, because the median function will result in more
accurate final value if there are some anomalies in the results. Then the median value is converted to the
heartbeats per minute (BPM) and along with the Spo2 value are sent to the Blynk cloud server.
3.1.2. ECG Sensor
The electrocardiogram (ECG signal) represents the electrical potential of the human heart. This signal is
started from a specific spot which is called “S-A node (sinoatrial node)” which is located on the upper left
side of the atrium. Then, the signal reaches to “A-V node (atrioventricular node)” which is located in the
middle of the heart approximately. Next, the electricity goes “bundle of His”. The ECG signal consists of
P: atrial depolarization, QRS complex: ventricular depolarization and atrial repolarization, and T:
ventricular repolarization [18]. See figure 8.
Figure 8. The standard ECG signal which shows the intervals
The ECG amplitude is in the microvolts range and its frequency within 0.01 HZ to 100 HZ range.
Therefore, to display it, a bandpass filter and an amplifier should be applied to the signal. The bandpass
filter range is 0.5 HZ – 40 HZ [16].w The most important things to diagnose via ECG signal are the
intervals between the pulses, the shape of each pulse. The normal intervals are: R-R interval (0.6 - 1.2)
seconds, P-R interval (0.12 – 0.2) seconds, QRS complex (0.08 - 0.12) seconds, Q-T interval (0.35 – 0.45)
seconds [17].
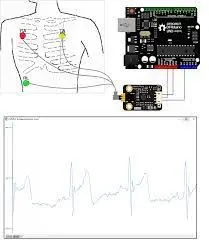
The ECG sensor is used in this paper is “Single-Lead ECG sensor AD8232” (figure 9) which is an
analog sensor with 3.3V operating volt manufactured by Sparkfun company. It includes three electrodes
(RA, LA, and RL) which can be placed under clothes confidentially (figure 10) RA (Right Arm), LA (Left
Arm), and RL (Right Leg). This sensor includes two analog filters, the first one is a high pass filter with a
cut off frequency of 0.48Hz and the second one is a low pass filter with a cutoff frequency of 40Hz to
achieve the required bandpass filter. Sensors’ pins are 3.3V, GND, Output, LO-, LO+, and SDN. The
output pin gives the ECG signal. LO- and LO+ pins are connected to the microcontroller to inform it if
one of the three electrodes loses its connection to the patient’s chest and they send a HIGH signal to the
microcontroller if the disconnection occurs. Therefore, the microcontroller can send a warning message
automatically based on that. Finally, the SDN pin is used to shut down the sensor to save battery. It is an
active low pin and the microcontroller can shut down the sensor automatically. The main issue with this
sensor which is very sensitive to motion. So, it requires a rest position to read perfectly.
Body Temperature Sensor
Maintaining the body temperature is essential to have a healthy condition, because catalyzing the chemical
reactions is the responsibility of enzymes in body cells and these enzymes must have the appropriate
temperature to be capable to do this task. High body temperature can result in heat stroke, dehydration,
and death if it is not treated. Also, low body temperature can lead to hypothermia and death if it is not
dealt with.
Therefore, obtaining instantaneous information about body temperature helps to avoid the mentioned
problems. In this paper, an LM35 analog temperature sensor (figure 13) is used to measure body
temperature. This sensor is able to read temperatures from −55˚ to +150˚C and has a 0.5˚C tolerance.
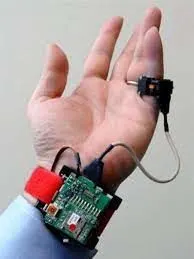
This sensor is put under the body arm (axilla) and is connected to the analog input of the Arduino UNO as
it is shown in figure 1 and figure 14. The process of acquiring the Celsius temperature is illustrated in
figure 15. The Arduino imports the analog data from the sensor to its analog pin and it converts the data to
a digital value using an internal analog to digital (A/D). Then the digital value is converted to a Celsius
temperature. Afterward, this temperature is transmitted to the NodeMCU to be sent to the Blynk Cloud
Server using an ESP8266 WI-FI chip included in the NodeMCU module.
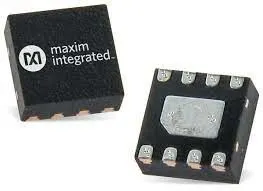
Figure 13. LM35 sensor (body temperature)
Figure 14. LM35 sensor connected to the Arduino UNO and NodeMCU
Pulse Oximeter Sensor
The sensor has two LEDs, one emitting red light, the other emitting infrared light. Infrared light is required for pulse rate. But, Both red light and infrared light are required for measuring Sp02 levels in the blood.
When the heart pumps the blood, the oxygen level is increased because there is more blood. But, when the heart rests, there is a decrease in oxygenated blood. Hence, the pulse rate is determined by getting the time between the rise and fall of oxygenated blood.
The oxygenated blood absorbs more infrared light and passes more red light. But, deoxygenated blood absorbs red light and passes more infrared light. Basically, the MAX30100 sensor reads the absorption levels for both light sources and stores them in a buffer that can be read via I2C pins.
Blood pressure sensor
The sensor, mainly used in the oscillometric method, is a pressure sensor (MEMS pressure sensor) made by the semiconductor process, which measures the pressure in the cuff using the air as a medium for pressure transmission.
The Internet of Things (IoT) is a new concept, providing the possibility of healthcare monitoring using wearable devices. The IoT is defined as the network of physical objects which are supported by embedded technology for data communication and sensors to interact with both internal and external objects states and the environment [1].
In the last decade, wearable devices have attracted much attention from the academic community and industry and have recently become very popular. The most relevant definition of wearable electronics is the following: “devices that can be worn or mated with human skin to continuously and closely monitor an individual's activities, without interrupting or limiting the user's motions” . Table 1 provides more transparent information on the importance of wearable devices and the IoT market .
Table 1
Today, the range of wearable systems, including micro-sensors seamlessly integrated into textiles, consumer electronics embedded in fashionable clothes [6], computerized watches, belt-worn personal computers (PCs) with a head mounted display [7], glasses [8], which are worn on various parts of the body [9] are designed for broadband operation. The field of wearable health monitoring systems is moving toward minimizing the size of wearable devices, measuring more vital signs, and sending secure and reliable data through smartphone technology. Although there has been an interest in observing comprehensive bio/non-bio medical data for the full monitoring of environmental, fitness, and medical data recently [10], but one obvious application of wearable systems is the monitoring of physiological parameters in the mobile environment. The majority of commercially available wearable devices are one-lead applications to monitor vital signs. However, most of such recreational devices are not suitable for the medical monitoring of high risk patients. Those devices that have been qualified for medical use are usually simple [11].
The objective of this paper is to review wearable health care devices both in scientific papers and commercial efforts. Our aim is to address the most important wearable devices, which measure effective parameters in health status directly. Readers can obtain comprehensive and useful information on the most reliable currently available devices and technical concepts in this area.
The rest of this review paper is organized as follows. The need for health monitoring when the user is in motion and under changing environmental conditions are investigated in Section II. In Section III recent research efforts in wearable devices are presented in three subsections. The first subsection discusses motion tracking and the research approaches and implementations in this area, and then some of the most recent commercial devices are compared. We then discuss the monitoring of environmental conditions and vital signs through wearable devices in subsections 2 and 3. In Section IV, the challenges of potentially available devices are discussed. Conclusion are finally summarized with suggestions for future works.
II. Wearable Devices in Health Monitoring
In today's world, where time is precious, people, the working class especially, spend most of the day shuttling between various tasks and tend to ignore their health and fitness. Even a simple appointment with a doctor in a clinic can require several tests set for diagnosis, prescription, and finally treatment, which can take a lot of time. Therefore, many patients only go to a clinic when they are suffering from a serious illness. Hence, many people are seeking for an alternative, such as a device that can be worn on the body, which would not only continuously monitor the user's health in real time but also provide timely insights on various health parameters to the user as well as his or her physician [6].
1. Motion Trackers
The measurement of human movement (motion tracking) has several useful applications in sports, medical, and other branches of studies. Such applications include fall risk assessment, quantifying sports exercise, studying people habits, and monitoring the elderly. Wearable trackers are becoming increasingly popular for two main reasons. They can motivate the user during the daily workout to perform more exercise, while providing activity measurement information through a smartphone without manual calculation . Also, they enable the wearer to become aware of the daily distance walked, which is very useful to ensure that the user maintains sufficient activity in the daily routine to maintain a healthy life. In particular, to accurately observe motion of the human body, 3-axis accelerometers, magnetometers, and gyroscopes sensors obtain data, each for a specific purpose. These sensors can be used for human activity recognition in the ubiquitous computing domain as well . Gyroscopes and magnetometers are auxiliary sensors that can be separately be combined with accelerometers to compensate the lack of accuracy in obtained data for motion tracking. In most cases, the combination of these three sensors lead to 9DoF.
Human motion detection has a wide range of application, from sports and recreation to biomedical. In recent years, consumer electronics have employed many semiconductor-based tracking system to allow users to access various kinds of interface control that use body motions and gestures . An important application of motion tracking is health care. However, due to need for high accuracy in the biomedical field, these devices are not typically designed only for medical application. The initial concept of using uniaxial accelerometer sensors in motion tracking was introduced in 1996 by Veltink and Boom . To introduce the concept of motion tracking in the medical application world, multiple clinical studies have been performed on posture estimation using accelerometers. An accelerometer alone cannot provide precise information; therefore, in 1997, researchers improved the performance of trackers and integrated semiconductor-based gyroscopes to perform bio-mechanical assessments and gait analysis . Four years later in 2002, Mayagoitia et al. introduced the initial framework of tracking lower extremities with a fusion of accelerometers and gyroscopes in the 2D sagittal plane. When the trackers became more reliable using an integrated gyroscope, the primary focus for clinical applications using inertial motion tracking was gait analysis . To apply this device for clinical purposes, and in particular gait motion, gravity sensitive accelerometers are used to estimate the tilt angles between the gravity vector and the sensor's axes . The first version of the most recently integrated sensors (accelerometer, gyroscope, and magnetometer) which provide very accurate data with 9DoF, was proposed in 2006 by Roetenberg. He proposed using a set of tri-axial accelerometers, tri-axial gyroscopes, and a magnetometer to estimate and monitor human motion.
A few 9DoF wireless inertial measurement units (IMUs) are commercially available and have been used for research projects . Due to the high risk of falling in the elderly, motion trackers as wearable devices are used in medical health monitoring for fall detection.
1) Motion measurement in body tracking
A new design was presented by Bertolotti et al. to apply for objective measurements of trunk or limb movements for the assessment of human body balance and control abilities. This system is based on a 72 MHz, 32-bit CPU (STM32F303VC; STMicroelectronics, Geneva, Switzerland) embedding a high performance ARM CortexM4, 32-bit RISC core, with the potential of supporting several sensors externally with high performance in both SPI and I2C mode. In this research, the sensor components (STMicroelectronics sensors) have a linear range and a sensitivity that allow proper measurement of body movements. Online processing, in the sense of data acquisition from different sensors, filtering, and data generation are performed at a high frequency of up to 72 MHz. Body movements are measured using 9DoF sensors: three inertial sensors, an accelerometer, a magnetometer, and a gyroscope. The full-scale values of the sensors can be modified by means of specific commands sent by the microcontroller . The size of the whole device, including all components in the box (circuit board, the Bluetooth module, and the battery) are 60 mm × 35 mm × 20 mm. The box is made of transparent plastic to allow the observation of LED indicators working on the board. The device proposed and implemented by this research group was designed to be used for three kinds of movement monitoring. The first and second types of movement monitoring are referred to as short- and long-term data monitoring. In the first type, the device is only connected to a PC to observe the results. In the second case, data are observed and locally stored for long-term monitoring. In the third type, the most important component is the body network, i.e. multiple units deployed on the subject's body and wired to a gateway unit, which can have a local memory or a wireless connection to a PC or hand-held device (full body monitoring of exercises).
2) Commercially available user devices applied in research papers
The following two subsections report on the advantages and disadvantages of commercially available devices and the tools that have been used in research for performance evaluation.
(1) Part 1: Comparison of nine motion tracking devices applied in research
In the first part, nine devices with different evaluated parameters are presented in Table 1 and are compared . To identify the benefits, some expected merits have to be determined and comparison is performed based on it. Long-term monitoring for further diagnosis is one of the main purposes of health care monitoring. To achieve this aim, a device has to store data temporarily in memory and send it to a cloud computing or medical station to be stored permanently. To fulfill these necessities, data buffering, which requires SD memory and RAM are of concern. On the other hand, for data transmission, Bluetooth and Wi-Fi compatibility are essential.
Many of these devices come only with customized software application. Some of them allow a user to build his/her commercially devices own application on it but others. A characteristic that, at the first glance, does not sound crucial is the firmware. To take full advantage of a development kit, in some cases, customization is necessary, but not all device manufacturers provide such compatibility.
Here, the nine devices that have been used and investigated in research are introduced, and important features are studied. Wearable devices are restricted by several factors. The most critical elements are size, battery life, weight, and capability of adding on-board sensors. In Table 2, all mentioned elements are compared, and additional parameters, including connectivity, software, and firmware compatibility are taken into consideration.
Table 2
Accel: accelerometer, GYR: gyroscope, Magnet: magnetometer.
Table 2 presents nine commercially available wireless motion trackers that have been used in research and are produced by various companies and manufacturers (MotionNode Bus [30], Opal [31], MTw development kit [32], Memsense W2 IM2 [33], STT-IBS [34], Colibry wireless [35], I2M motion SXT [36], Shimmer 3 [37], Physilog [38]). We have attempted to present the most recent research works and devices in the market.
(2) Part 2: Comparison of four top wrist-worn device commercially available in market
In this subsection, the most popular and recent commercial motion trackers are compared [27]. First, the four most popular wristband-style wearable commercial devices—Fitbit Flex, Withings Pulse, Misfit Shine, and Jawbone Up24 (Figure 1)—are introduced and briefly described. Then, according to the previously mentioned merits, these commercial devices are compared [31]. An important requirement from wearers is the visualization of actual and real data. Therefore, the accuracy of fitness tracking is one of the key factors of device selection. According to the quality of the used components and software, some devices perform better than others. Obtained experimental results from each device, are used to study both the accuracy and ease-of-use of the four wearable devices. This study was performed in Korea. The devices for experiments were selected among the 10 top available wearable device in the market. The four wearable devices considered in the experiments [25,39] were selected randomly. The four devices are described in detail below. Further information is summarized in Table 3, which briefly compares the features of the four wearable devices. The commercial name of device, country of manufacturing, tasks ability, and price are provided for each one.
Table 3
In Table 4, the features and communication mode of these four popular wearable devices are summarized. The purpose of the table is easy comparison of the devices [40,41,42,43].
Table 4
2. Vital Signs Measurement
Many wearable devices have been implemented to measure critical elements in healthcare monitoring. The majority of these devices are in one lead such as electrocardiogram (ECG) and electroencephalogram (EEG) measurement, skin temperature, etc. There have been recent efforts in wearable devices to provide multi-task vital signs measurement. Here, we present the most creative and recent papers in this area.
Many devices, structures, designs, and solutions for remote wearable ECG monitoring, which plays a vital role in health monitoring have been proposed in the literature and industry. Generally, these solution are hard to implement and are not efficient enough in power consumption or performance. Some of them are remarkable but do not have the possibility of merging with other out signals from different systems.
1) Body-worn smart clothing
To obtain health care status's signals from various physiological indicators due to forming a source data center for comprehensive health monitoring, a ‘smart clothing’ design was presented in [44]. To make smart clothing systems intelligent, an infrastructure incorporating smartphones, mobile applications, cloud computing, and big data analytic is required to communicate in the structured design [45].
Although several research approaches in the field of health monitoring have been proposed and implemented, the existing solutions in different aspects have failed for long-term health monitoring [45]. Traditional health monitoring, which often collects one or a very limited number of physiological signals, is not very useful for chronic diseases in a full-range health monitoring system.
Sensor deployment on the body is the main difference between old wearable devices and smart clothing [45]. In smart clothing, all sensors which are used to measure the vital signs are integrated into textile clothing. Sensor placement is a critical point that has to be performed properly. To provide efficiency and a well-formed design, the quality of the used sensors, proper positioning, layout of flexible electricity cable, weak signal acquisition equipment, low-power wireless communications, and user comfort [45] are crucial factors. The fabric of the smart clothing to be worn, has to be comfortable. In this design, it has been tried to measure only vital and necessary parameters. Now the used sensors and also the location they are placed on the body are described (Figure 2).
(1) Sensors placement
In Table 5, the position and task of each deployed sensor in smart clothing is summarized.
Table 5
ECG: electrocardiogram, EEG: electroencephalogram.
When all sensors are positioned appropriately, each sensor must be wrapped by a flexible covering layer to protect the sensor and to make the device comfortable to be worn by the user. Further textile electrodes touch the user's skin to sense and transmit the data. These electrodes must be sewn on the cloth from the inside. Once the sensors and devices are powered on, they will come into operation. It is possible to wash smart clothing (Figure 3). However, it should be noted that some components are not washable and waterproof, but these can be removed easily by the wearer, and reinstallation is straightforward [44].
There are three major drawbacks to smart clothing:
- Intra-smart-clothing system: In the first step, it is necessary to consider the wearer's physical body shape, type of disease to be monitored, and daily habits [45]. In fact, in many cases, it is necessary to customize the smart clothing for the applicant. In addition, technical feasibility, comfort level, and cost effectiveness are serious concerns for the manufacturer.
- Communications for inter-smart clothing: A device structure design brings the user benefits when it can communicate with the outside world and transmit data. Inter smart-clothing design focuses on the communication problem of interconnecting smart clothing with the outside world. It is the intermediate level of structure device for the closed-loop system of smart clothing to be connected to cloud. The second use of this level could assist connection to a local medical center.
- Beyond-smart-clothing (BSC) on clouds: To complete the procedure of data collection, transmission, and analysis, cloud computing is essential. In fact, according to some pre-defined algorithms, data are sent to a medical center, appropriate decisions are taken by medical doctors, physicians, or other healthcare professionals. In emergency cases, some feedback must be sent to the user to inform him or her about his/her health's status. Thus, cloud computing is integrated in BSC [46]. There are various technological possibilities for the basis of BSC, such as cloud computing, big data, machine learning, etc. [44].
2) Wire-based wearable devices: limited physiological and environmental parameters measurement
In [47], a novel approach to medical monitoring was introduced by Sanfilippo and Pettersen. The methodology is wire-based and many vital signs are measured. This wearable integrated health-monitoring system is based on the e-Health Sensor Platform [48] V2.0, which is the first biometric shield for Arduino and Raspberry Pi. However this device is not licensed for medical health monitoring. The system allows researchers to measure and investigate health through body monitoring by using 10 sensors to observe vital signs and perform motion tracking. EEG, ECG, and body temperature measurement are carried out by these sensors, which are connected to the platform. A push button is considered for emergency cases. Collected data are used in two scenarios. In the first, the user is monitored in real time, and in the second, sensitive data are transmitted to be analyzed for medical diagnosis.
In this paper, a wearable health sensor monitoring system based on a multi-sensor fusion approach is outlined. The implemented device consists of a chest-worn device that embeds a controller board, an ECG sensor, a temperature sensor, an accelerometer, a vibration motor, a color-changing light-emitting diode (LED), and a push-button [47].
The embedded vibration motor makes it possible to actuate distinctive haptic feedback patterns according to the wearer's health state. Haptic feedback, informs the wearer about his or her health status in three different states. When it does not vibrate, it indicates a normal state; through low-frequency and high-frequency vibration, abnormal data observation and potential risk are indicated, respectively [49].
To address privacy concerns, data is encrypted before transmission. Data collected for permanent storage are sent to cloud storage, while data to be visualized in real-time, are sent directly to a laptop or smart phone.
The structural framework is based on a multi-sensor fusion approach. In particular, a client-server pattern is adopted in [47]. A chest-worn device, comprising an Arduino Uno board based on the ATmega328 micro-controller, an Arduino Wi-Fi Shield, e-Health Sensor Shield, a vibrating motor, and push button, operates as a client and remotely communicates with a server. The server is implemented in three levels of logic and communication.
The device structure is implemented in three layers (Figure 4). The bottom and basic layer is Arduino ATmega328. To enable communication capabilities to this proposed wearable device, an Arduino Wi-Fi Shield [50] is stacked on top of the adopted controller board, which forms the second layer. In detail, the Arduino Wi-Fi Shield allows the client to communicate with the server by using the 802.11 wireless specification (Wi-Fi) [48]. The communication between the Arduino Wi-Fi Shield and the Arduino Uno board uses long wirewrap headers that extend through the shield. The third and top layer is implemented when the wearer's biometric data are gathered, and an e-Health Sensor Shield [51] is stacked on top of the adopted communication module.
III. Challenges and Bottlenecks for Medical IoT
Leading wearable devices based on IoT platforms must provide simple, powerful application access to IoT devices. Many platforms and structures have been proposed by the scientific community, and commercial devices are already available for bio-metric/medical parameter measurement. However, there are serious challenges in this way. The following are four key capabilities that leading platforms must enable:
- Simple and secure connectivity: A good IoT platform is expected to provide easy connection of devices and perform device management functions in three levels of data collection, data transmission to a hub, and permanent storage and observation in a medical station. These steps must be secured; therefore, data encryption is necessary.
- Power consumption: To provide the wearer with easy device management and long-term monitoring without interruption, power loss is becoming more important. This is strictly correlated to the number of parameters that are observed, efficient code programming, as well as good data packing, encryption, and compression.
- Wearability: Wearable devices have been designed for various types of bio-medical monitoring to assisting users in living long, healthy lives. This point is more significant when these devices are intended to be worn by elderly users. Therefore, such devices must be easy to wear, easy to carry, and comfortable. These requirements are fulfilled with a light, small, and well-structured device. A wearable device is expected to be small and light weight, and should be able to be used for a long time.
- Reduced risk in data loss: When data is collected by a microcontroller and transmitted to a smartphone or cloud storage, there is a possibility of disconnection and consequently data loss. This must be reduced as much as possible to provide safe health monitoring. It may be possible through temporary data saving (buffering) in the microcontroller providing a large memory.
. CLOUD COMPUTING
Cloud computing delivers computing services such as servers, storage, databases, networking,
software, analytics and intelligence over the internet for faster innovation, flexible resources,
heavy computation, parallel data processing and economies of scale. It empowers the
organizations to concentrate on core business by completely abstracting computation, storage and
network resources to workloads as needed and tap into an abundance of prebuilt services. Figure
3 shows the differences between on-premise and cloud services. It shows the services offered by
each computing layer and differences between them [5].
The array of available cloud computing services is vast, but most fall into one of the following
categories:
SaaS: Software as a Service
Software as a service represents the largest cloud market and most commonly used business
option in cloud services. SaaS delivers applications to the users over the internat. Applications
that are delivered through SaaS are maintained by third-party vendors and interfaces are accessed
by the client through the browser. Since most of SaaS applications run directly from a browser, it
eliminates the need for the client to download or install any software. In SaaS vendor manages
applications, runtime, data, middleware, OS, virtualization, servers, storage and networking
which makes it easy for enterprises to streamline their maintenance and support.
PaaS: Platform as a Service
Platform as a Service model provides hardware and software tools over the internet which are
used by developers to build customized applications. PaaS makes the development, testing and
deployment of applications quick, simple and cost-effective. This model allows business to
design and create applications that are integrated into PaaS software components while the
enterprise operations or thirty-party providers manage OS, virtualization, servers, storages,
networking and the PaaS software itself. These applications are scalable and highly available
since they have cloud characteristics.
IaaS: Infrastructure as a Service
Infrastructure as a Service cloud computing model provides self-servicing platform for accessing,
monitoring and managing remote data center infrastructures such as compute, storage and
networking services to organizations through virtualization technology. IaaS users are
responsible for managing applications, data, runtime, middleware, and OS while providers still
manage virtualization, servers, hard drives, storage, and networking. IaaS provides same
capabilities as data centers without having to maintain them physically [6]. Figure 4 represents
the different cloud computing services been offered.
Data centralization leads to more meaningful reporting, ensures that the same data is available across the organization, and increases your Return Of Investment (ROI).
With a robust and efficient data management system, companies can provide authorized & secured access to stored data. It’s also a better approach to share data securely and seamlessly.
Top 5 Benefits of Data Centralization
Many companies struggle with the management of their information systems and related databases. A primary reason for this is a lack of centralization.
With a centralized data management system like UBS, you can collect, store and retrieve information in a single system safely while having complete access across the company.
The key benefits of having centralized data management are it provide data security, consistency, integrity, operational efficiency, reduces cost, etc.
Here are the top 5 ways to centralize your company’s data?
- Aligning data strategy with business
- Investments in data management
- Accountability, role-based security
- Cross-functional collaboration
- Consistent checks and measuring the impact
You need to know that a centralized data management system incorporates all the processes and procedures used by your company on a daily basis. With centralized data management, you can collect, store and retrieve information in a single system safely, while having complete access across the company.
Let’s understand the above points in more detail.
1. Aligning data strategy with business strategy
The centralized data strategy should be defined within the business context, aligned with the organization’s hierarchy, decision types, and stakeholder needs.
It must align with business strategy to prioritize areas that require more strategic, tactical, and operational decision-making at different ranks such as top executive, senior management, and associate levels.
An effective data strategy should streamline data collection and management for product design and delivery, operational and process improvements, and compliance.
2. Investment in data management
Companies must focus on a robust data management system to support business initiatives and build an effective data strategy.
From a positive point of view for business-critical data, data management eliminates data grains and synchronizes enterprise-wide data from large databases.
Data centralization and management help harmonize, reset, and manage data related to products, customers, assets, suppliers, employees, locations, materials, and references. Effective data management strategy and implementation will simplify the linking process.
3. Accountability and role-based security
Data governance and supervising play a crucial role in providing accountability, managing access control, and optimizing role-based security.
The enterprise data centralization strategy should be equipped with robust data to reduce the risk of improper access, data tampering, and leakage of sensitive information.
Data supervising ensures that data is stored, archived, and backed up to secure against internal issues, data theft, and cyber-attacks. In addition, businesses should remember that work transparency and efficiency helps to grow the business.
4. Cross-functional collaboration
For the data centralization strategy to deliver value, businesses must ensure cross-functional collaboration between product, technology, and business teams.
Building scalable disciplinary teams with diverse, complementary skill sets and experience will promote data competency and data-driven culture across the organization.
Creating a centralized hub or dashboard will enable the relevant teams to access data, share intuitive analytic tools, and generate insightful reports.
This brief communication empowers organizations to uncover actionable insights and allow data literacy across functions. Having a cross-functional collaboration will not only help the organization but may also generate new users.
5. Consistent checks, the impact of the data strategy
The data must be visible and accessible to the right people on demand, but the data management team must ensure that frequent access does not alter its quality and integrity.
Having a strict control framework in place will check and monitor the data quality for inconsistencies. Also, the business must measure the performance of the data strategy to manage it effectively.
Defining proper matrices is critical to understanding the efficiency of the data strategy implemented in handling an HR management system. It helps re-evaluate and refine the data management processes and procedures to ensure optimal data management.
Simulation of alarm strategies
The collected wireless vital sign measurements of patients and clinically observed alarms were used to retrospectively evaluate the performance of the currently used Sensium Vitals® alarm algorithm for detection of AEs. Next, simulation was used to investigate the performance of alternative alarm strategies in the same dataset. For this aim, the original Sensium Vitals® algorithm was first reproduced retrospectively in MATLAB (version 2019b, The MathWorks Inc., Natick, MA, US) adopting the alarm principles described by the manufacturers and default settings. Subsequently, six alternative alarm strategies were explored by modifying the original alarm algorithm, as specified in Table Table1.1. Two of these strategies were based on previously described methods for abnormality detection (I) or prevention of false alarm rates (III), as explained below. The other strategies were introduced based on physiological assumptions (II, IV, V, VI). For each alternative alarm strategy, three (sets of) parameter settings were subsequently tested to investigate and select optimal standard parameter settings (Table (Table1).1). The tested parameter settings were chosen arbitrarily within in a range that was expected suitable, given physiology and default settings of the currently used algorithm.
The first alternative alarm strategy (I) implemented individual thresholds to correct for differences in normal vital signs ranges between patients. For this aim, the first available 24 h of the recording was used to create individual distributions of the vital signs for each patient and identify corresponding upper and lower alarm thresholds for the remaining monitoring period, similar to the approach described by Poole et al. [26].
The second alarm strategy (II) aimed to prevent false alarms, by increasing upper threshold levels in the first four postoperative days where levels for HR, RR and T are typically higher due to the surgical stress response [27, 28].
The third strategy (III) focused on optimization of the annunciation delay, supported by the beneficial results reported in other studies [20, 29, 30]. Accordingly, an increase in the interval length of alarms was simulated, such that vital signs should exceed a threshold for a longer successive period to cause an alarm. With this adaptation, it was aimed to reduce the number of false alarms related to short lasting abnormalities caused by normal variations or movement artifacts.
The fourth (IV) alarm strategy was designed to compensate for increased physical activity level, which leads to increased HR and RR levels as compared to resting state. As patients are most active during daytime, the upper HR and RR threshold was increased for daytime (8 a.m. to 10 p.m.) to prevent false alarms.
Likewise, the fifth alarm strategy (V) corrected for low HR and RR levels that are often observed during sleep [31] by decreasing the corresponding lower threshold during nighttime (10 p.m. to 8 a.m.).
The sixth alarm strategy (VI) assessed vital signs solely based on time trends, as patterns of change are crucial in the detection of clinical deterioration [32]. Accordingly, this alarm strategy generated alarms in case the upward or downward slope calculated over a predefined time window exceeded a certain threshold, without taking the absolute vital sign value into account. Trends were assessed for time windows of multiple hours, as the wireless monitoring system is currently indicated for detection of clinical deterioration and not as surveillance system for acute situations.
Evaluation of alarm strategies
The alarms that were respectively generated in clinical practice or during simulation were defined as true positives (TP) or false positives (FP) to evaluate the performance to detect AEs. Alarms that occurred in the 24 h before diagnostic confirmation and during the treatment period of the AE were classified as TP in case the vital sign abnormality could be physiologically explained by development or presence of the AE. To enable consequent alarm classification, a list of assumed relations between AEs and vital sign abnormalities was composed using clinical guidelines and literature. In case subsequent AEs with overlapping windows of presentation were observed, alarms that could be related to both events were not double counted but allocated only to the event that developed latest in time. As continuous monitoring is aimed to be used as an early warning tool, TP alarms that were generated in the 24 h before diagnostic confirmation of the AE were also investigated as a separate category (TPearly).
The performance of the original alarm strategy and each of the optimized alternative strategies was evaluated using two sensitivity rates (Stotal, Searly), the total alarm rate, and the false discovery rate. Stotal and Searly were defined as the number of AEs for which TP alarms or TPearly were observed respectively, and represent the sensitivity for detection or early detection of AEs. The total alarm rate was calculated as the sum of all alarms divided by the total recording time of all patients, resulting in an average number of alarms/day/patient. The false discovery rate was calculated as the percentage of alarms classified as FP. In addition to these four metrics, we introduced a performance score (P-score) to evaluate the relative improvement in overall performance for each of the alternative alarm strategies as compared to the original alarm strategy, based on the trade-off between early AE detection and total alarm rate. For this aim, sub scores were assigned to the level of increase or decrease in Searly and total alarm rate, as specified in Table Table2.2. The P-score was calculated as the sum of the two sub scores assigned to Searly and total alarm rate respectively. Accordingly, a positive P-score indicates improvement in overall performance as opposed to the original alarm strategy the while a negative P-score indicates impairment.
For each alternative alarm strategy, the parameter set with highest P-score was selected as most optimal and used as standard setting applied to each patient record for further analysis and evaluation. In case of an equal P-score, the setting with lowest false discovery rate or the setting with smallest modification (lowest correction factor) as compared to the original alarm algorithm was selected subsequently. In addition to evaluation of individual alarm strategies, we explored whether combining multiple strategies improved alarm performance. For this aim, all possible combinations of strategies I to V were implemented cumulatively. The trend-based strategy (VI) was not included in these combinations due to its incompatibility with strategies that adapt thresholds for absolute vital sign values. Last, stepwise backward elimination was performed. Accordingly, the strategies that affected the P-score most were removed step-by-step from the combination, starting from the full combination of strategies (I–V). This process was repeated until all combination sizes were tested.
Data encryption and security
principles:
- The complexity of IoT security necessitates a bottom-up, organic process to ensure the outcomes address all existing and potential challenges and issues.[1] The approach should be fluid in nature, defined and refined through discussion with stakeholders.
- Internationally harmonized technical standards are key to enhancing IoT security in the long-term, but they are hard to get right and take time. It is reasonable for approaches to IoT security to start at a national level while working in collaboration with other national, regional, and international bodies.
- Because of the immediacy of the risks and the extended time frame of long-term developments, such as improvements to framework policies and the development of international standards, it is important to start work on educating consumers and for businesses to begin adopting best practices that will reduce the risks of consumer IoT device adoption.
Within this context, the initiative was focused on consumer-level devices as opposed to those that are being utilized at the enterprise level.[2] Throughout 2018 and early 2019, the Enhancing IoT Security multistakeholder group engaged in a series of in-person multistakeholder meetings, focus groups, and webinars and conducted research to develop the following:
- A shared set of definitions and benchmarks around the security of Internet-connected devices.
- Shared guidelines to ensure the security of Internet-connected devices over their lifespan, including the development, manufacturing, communications, and management processes.
- Recommendations to inform national policy related to IoT security in Canada.
Three thematic working groups, Network Resilience, Device Labeling, and Consumer Education and Awareness, were established to inform the process and to develop specific recommendations. The recommendations of these Working Groups cover the technical, policy, and behavioural aspects of IoT security.
device certification plan
- These certifications are typically mandatory in order for electronics product to be sold in a specific market.
- The certifications are applicable to the IoT Device Host and / or IoT Device.
- The certifications usually demonstrate compliance with national regulations that cover, for example, safety aspects, and to ensure device RF emissions do not interfere with other wireless equipment. Examples include RF transmitter and receiver tests, electromagnetic compatibility (EMC), electrical safety and environmental.
- Depending on the intended use of the device, multiple regulatory agency approvals may be required.
- Examples include
Ô China Compulsory Certification (CCC)
Ô Electromagnetic Compatibility (EMC) Directive
2014/30/EU and Radio Equipment
Directive (RED) 2014/53/EU
Ô Federal Communications Commission (FCC)
Part 18
Ô Gijyutsu Kijyun Tekigō Shōmei (Giteki)
Ô Network Access License (NAL) - Depending on the market(s) where the device is intended to be sold or used, multiple regulatory certifications may be required with each market
having its own regulatory body and approval
process.
6.Certification requirements for devices used for IoT fall into three distinct categories, illustrated with examples,
as follows:
Regulatory Certification / Type Approval
Regulatory Certification /
Compliance Telecom Industry Certification
Operator Certification Desktop
Mobile
IoT Device Certification Landscape | GSMA Report
5 IoT Device Certification Landscape | GSMA Report
Industry Certification Schemes - These certifications are typically in addition to the regulatory certification / type approval mentioned previously.
- These certifications check the functionality of the product, and whether the functionality conforms to specific industry standards by agreed conformance test suites, which may include interoperability testing and field testing.
Industry Certification Schemes: Telecoms - The two main Telecoms Industry certification schemes are GCF and PTCRB which have different origins, which is reflected in differences in the way the schemes operate and their scope.
- GCF is a voluntary scheme that uses self-declaration with a quality assurance and certification challenge process. PTCRB is mandatory for devices that will use the networks of operators that are members of the scheme. Each PTCRB certification is verified with tests executed at PTCRB approved labs.
- Geographical scope of the schemes differ, with GCF used worldwide, including by some North American operators, and PTCRB used mainly in North America.
- Both schemes cover testing based on 3GPP standards, SIM/eSIM functionality and antenna performance. PTCRB adds North American specific requirements.
- As well as certification of mobile devices, both schemes also cover certification of IoT Devices and
related components, such as Communication Modules. GCF also includes certification of service layer functionality such as oneM2M in partnership with the TTA. - Both GCF and PTCRB do not currently have a distinct process for IoT Device certification, as both organisations use the same scheme as for mobile devices. However, as IoT devices are typically less complex than mobile devices, the testing involved is significantly less than a smartphone in order to achieve certification.
- The schemes also allow for Communication Module certification which can be integrated into an IoTDevice enabling the re-use of test results.
- Network operators will often require one of the certification schemes to be obtained as part of their acceptance or certification requirements.
Industry Certification Schemes:
Vertical industry Certification
(for example Automotive, Medical)
Î - These schemes may cover additional requirements on top of any regulatory certification and telecoms
certification. - They are related to end user safety and / or verticalspecific needs and environments, such as extreme
operating temperatures and vibrations that are found inside vehicles.
Î Automotive certification examples include IATF 16949 and ISO 9001 applicable to the production
facilities, AEC-Q100, AED-Q200, ISO 26262 applicable to the IoT Device and IoT Device Host.
IoT Device Certification Landscape | GSMA Report
6 IoT Device Certification Landscape | GSMA Report
Î Typically this is in addition to the Telecom Industry certification, where network operators execute additional
interoperability testing specific to their network configuration and network parameter settings. - Some operators may require industry certification, whereas others may treat such approvals as optional. In some
cases, where the network operator accepts the results of Telecom Industry certification, additional operator-specific
tests may not be required. - Often, this testing focuses on in-field performance of the devices, such as radio sensitivity, dropped connection rate,
handover success, data throughput and battery life. - This certification is applicable for IoT Device Hosts, IoT Devices and Communication Modules and Radio Baseband
Chipsets, covering IoT security, Service Layer and Application Layer, depending on the network operator
requirements. - Operator-specific certification may be required in order for the device to be used on a specific network or across
a group of network operators, or in order to be sold via the network operator channels as either manufacturerbranded or white-labelled devices. - For devices that will be roaming onto multiple networks, operator certification is typically only needed on the home
network, i.e. the network that provides the cellular subscription.