Project 1
Part - A
1.
-
List of Disorders
- Osteoporosis: The chances of contracting this disease increase with age, resulting in reduced bone mass and fragile bones, thus increasing the chances of fracture. Low levels of estrogen are a common cause.
- Arthritis: Inflammation of one or more joints. Arthiritis leads to the limited movement of joints and pain.
- Gout: This too is the inflammation of joints, but due to an accumulation of uric acid crystals.
-
- Discussion:
- there are three types of cells intimately associated with bone: osteocytes, osteoblasts, and osteoclasts;
- osteocytes dwell in small lacunae within the bone matrix;
- they are oval in cross section, their longest diameter being roughly parallel to the lamellae of mature bone;Microscopic structure of bone
Woven Bone: (primary bone)
- forms embryonic skeleton, and is largely absent after age 4 yrs;
- woven bone formation is seen in fracture callus in both children and adults;
- woven bone does not contain lamellae, and rather has a relatively disorganized array of collagen and irregular mineralization patternLamellar Bone (secondary bone):
- layering of bone is the hallmark of mature bone;
- it is in compact cortical bone of diaphysis that haversian systems are found;
- nutrients pass thru haversian canals, which run in the direction of the long axis of the bone, to bone cells that lie buried in the thick cortexosteon:
- refers to the bone surrounding the haversian system;
- the haversian canals are surrounded by concentric rings or lamellae, each about 5 micrometers thick;
- histologically, these layers of bone will contrast with one another under polarized light because of the different orientations of
collagen fibers in each layer;
cement lines surround the outer border of each osteon;
- histologically they are seen as the demarcation between the point that bone resorption ceased, and bone formation began;
- collagen fibers and canaliculi do not cross cement lines;
- these lines do not bind adjacent lamellae but rather than separate them;
canaliculi:
- w/in concentric lamellae of mature bone are small lacunae containing osteocytes;
- from lacunae extend fine canaliculi that contain cell processes of osteocytes;
- these processes connect osteocytes to one another and to haversian canal, and are the pathways of nutrition from the canal to the
bone cells;
- canaliculi connect osteocytes within one haversian system only;
- they do not cross cement lines to other systems;
- since canaliculi are much too small to permit passage of RBCs, osteocytes must depend on diffusion & cell pumping mechanisms
for their supply of oxygen & nutrients - Osteoporosis :
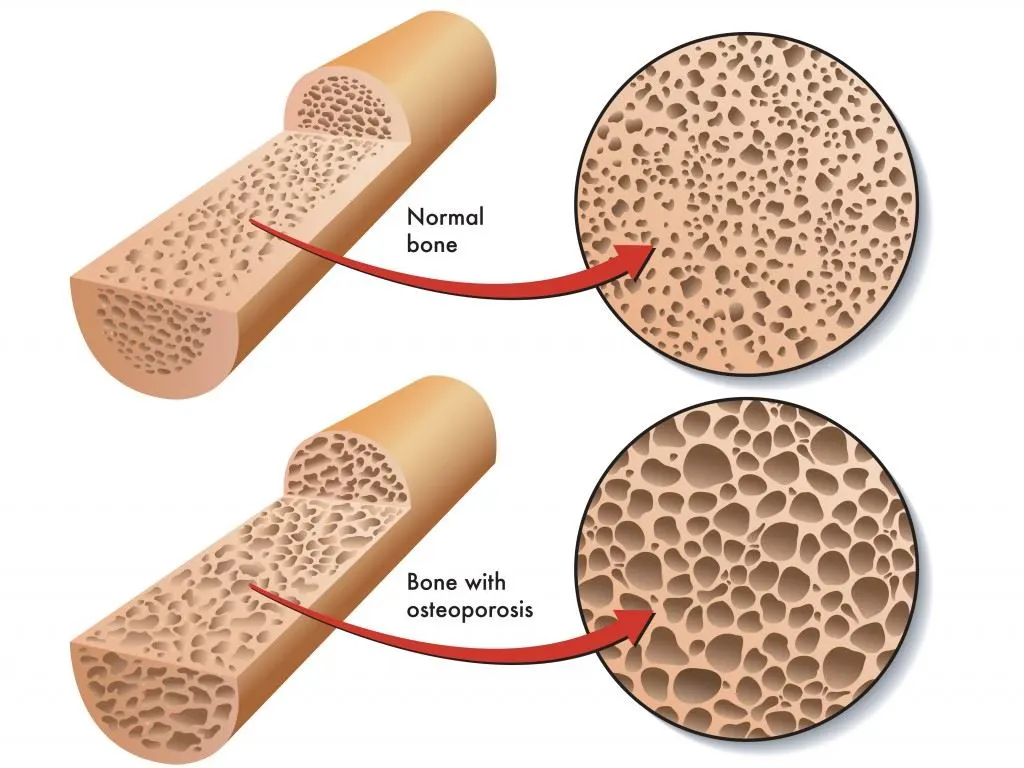
Osteoporosis
Diagnosis :
If they suspect osteoporosis, they will request a bone mineral density scan (BMD).
Bone density scanning uses a type of X-ray known as dual energy X-ray absortptiometry. (DEXA).
DEXA can indicate the risk of osteoporotic fractures. It can also help monitor a person’s response to treatment.
Two types of devices can carry out a DEXA scan:
- A central device: This is a hospital-based scan that measures hip and spine bone mineral density while the individual lies on a table.
- A peripheral device: This is a mobile machine that tests bone in the wrist, heel, or finger.
A DEXA scan is a non-invasive test that measures bone mineral density to assess if a person is at risk of osteoporosis or fracture. DEXA stands for dual energy x-ray absorptiometry—a mouthful of a term that actually tells a lot about this procedure, in which two X-ray beams are aimed at the bones. While a regular X-ray can show changes in bone density (osteopenia) after bone loss of about 40%, a DEXA scan can detect changes as small as 1%, making it more sensitive and accurate. The DEXA is sometimes referred to as a central DEXA scan, bone densitometry scan, or a DXA scan.1

Purpose of Test
A DEXA scan detects weak or brittle bones to help predict the odds of a future fracture and, sometimes, to determine if someone should be taking medication to slow bone loss.1 After an initial DEXA scan, subsequent scans can be done to compare the progression of bone loss—in other words, comparing a baseline scan with a second scan can show if bone density is improving, worsening, or staying the same.
A DEXA scan also can be used to assess how well osteoporosis treatment is working. In addition, after a fracture, a DEXA scan can assess if the break was likely due to osteoporosis.2
Other reasons to have a DEXA scan include:
- A break or bone loss in your spine showed up in an X-ray
- You have back pain that could be caused by a spine fracture
- You've lost a half-inch or more of height within one year
- You've had a total height loss of an inch and a half
- Women who've reached menopause and are not taking estrogen
- People with a personal or maternal history of hip fracture
- Smokers or people whose mothers smoked while pregnant
- Post-menopausal women who are tall (over 5 feet, 7 inches) or thin (weigh less than 125 pounds)
- Men with clinical conditions associated with bone loss, such as rheumatoid arthritis or chronic kidney disease
- People who take medications known to cause bone loss, including corticosteroids such as prednisone (a steroid that interferes with the bone-rebuilding process), various anti-seizure medications such as Dilantin (phenytoin) and certain barbiturates, and high-dose thyroid replacement drugs
- People with type 1 (juvenile or insulin-dependent) diabetes, liver disease, kidney disease, or a family history of osteoporosis
- Those who have high bone turnover, which shows up as excessive collagen in urine samples
- People who have a thyroid condition, such as hyperthyroidism, or a parathyroid condition, such as hyperparathyroidism
- Transplant patients, who are at increased risk of osteoporosis due to anti-rejection medications they may be taking
- People who've had a fracture after only mild trauma
Blood supply :
Blood supply to the long bones comes from these three main sources:
- Nutrient artery system
- Metaphyseal-epiphyseal system
- Periosteal system
The nutrient artery system is a high-pressure system that branches from major systemic arteries. It enters through the cortex via the nutrient foramen and then migrates into the medullary canal. There it branches into ascending and descending branches that then further branch out into arterioles and supply the inner 2/3 of bone within the Haversian system.
The metaphyseal-epiphyseal arteries arise from the periarticular plexus, that is found around the joint area of a long bone.
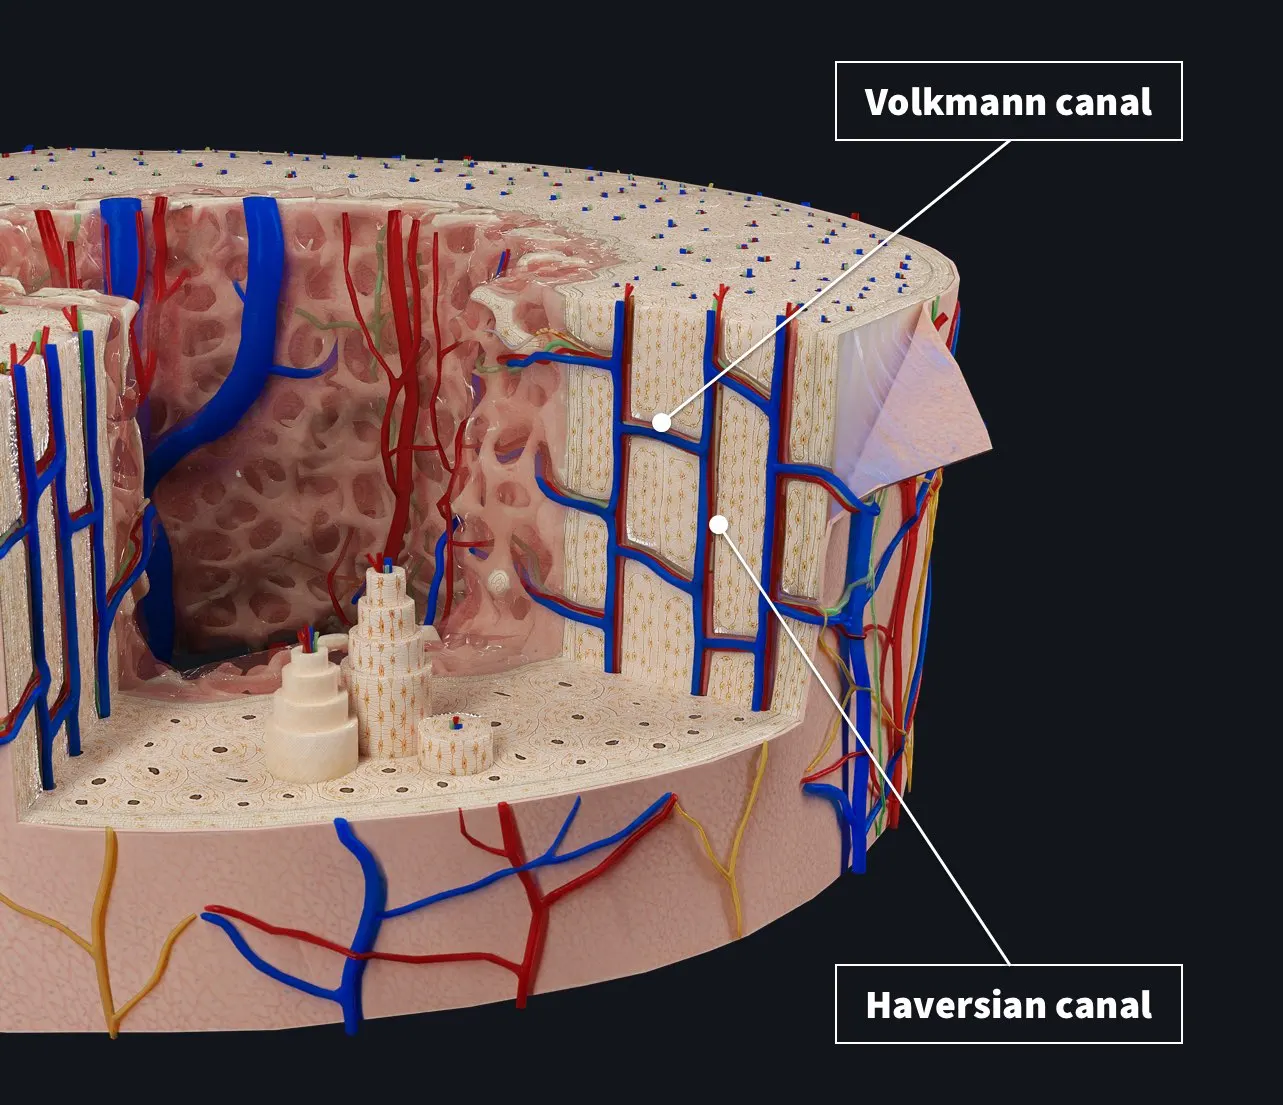
The periosteal artery system is a low-pressure system that supplies the outer 1/3 of bone and is connected through Haversian and Volkmann canals. These canals are part of the osteon structure of the cortex.
2. Acute pancreatitis
Acute pancreatitis requires hospitalization of the patient for treatment. Standard treatment of acute pancreatitis involves pain management and close monitoring of health parameters for severe signs or symptoms. You may require supportive treatment to manage fluid, nutrition, and oxygen. Treatment of acute pancreatitis infection depends on the stages of the condition:
Mild
pancreatitis
Complications may not develop in most mild cases of acute pancreatitis. Intravenous drip to maintain fluid balance and to inject powerful painkillers is necessary in mild cases of acute pancreatitis. A catheter may be essential to monitor urine output. Doctors may insert a tube through the nose into the stomach for feeding. You may start feeling better within a week after the treatment of a mild attack.
Severe acute
pancreatitis
In severe acute pancreatitis, there is a possibility of one or more complications. Admission to the Intensive Care Unit may be necessary to treat complications of acute pancreatitis. Ventilator support may be vital if the patient is having breathing difficulty in severe acute pancreatitis infection.
Treating the
underlying cause
Surgical removal of gallstones is essential if the complications are because of acute gallstone pancreatitis. Doctors may perform gallbladder removal surgery if necessary. In pancreatitis, swelling may be because of infection or damage to the pancreatic tissues. Doctors may treat the infection with antibiotics. You may need surgery to remove the infected tissues. Doctors may use needle biopsy to diagnose necrotizing pancreatitis to remove the dead tissues of the pancreases.
Your doctor can diagnose AP by using blood tests and scans. The blood test looks for enzymes (amylase and lipase) leaking from the pancreas. An ultrasound, CT, or MRI scan allows your doctor to see any abnormalities in or around your pancreas
A CT (computed tomography) scan, also called a CAT scan, is a type of specialized X-ray. The scan can show cross-sectional images of a specific area of the body.
With a CT scan, the machine circles the body and sends the images to a computer, where they’re viewed by a technician.
An abdominal CT scan helps your doctor see the organs, blood vessels, and bones in your abdominal cavity. The multiple images provided give your doctor many different views of your body.
Keep reading to learn why your doctor may order an abdominal CT scan, how to prepare for your procedure, and any possible risks and complications.
Abdominal CT scans are used when a doctor suspects that something might be wrong in the abdominal area but can’t find enough information through a physical exam or lab tests.
Some of the reasons doctor may want you to have an abdominal CT scan include:
- abdominal pain
- a mass in your abdomen that you can feel
- kidney stones (to check for size and location of the stones)
- unexplained weight loss
- infections, such as appendicitis
- to check for intestinal obstruction
- inflammation of the intestines, such as Crohn’s disease
- injuries following trauma
- recent cancer diagnosis
A typical abdominal CT scan takes from 10 to 30 minutes. It’s performed in a hospital’s radiology department or a clinic that specializes in diagnostic procedures.
- Once you’re dressed in your hospital gown, a CT technician will have you lie down on the procedure table. Depending on the reason for your scan, you may be hooked up to an IV so that contrast dye can be put into your veins. You’ll probably feel a warm sensation throughout your body when the dye is infused into your veins.
- The technician may require you to lie in a specific position during the test. They may use pillows or straps to make sure you stay in the right position long enough to get a good quality image. You may also have to hold your breath briefly during parts of the scan.
- Using a remote control from a separate room, the technician will move the table into the CT machine, which looks like a giant doughnut made of plastic and metal. You’ll most likely go through the machine several times.
- After a round of scans, you may be required to wait while the technician reviews the images to make sure they’re clear enough for your doctor to read.
3.
Chronic obstructive pulmonary disease (COPD)
Chronic obstructive pulmonary disease (COPD) is a common lung disease. Having COPD makes it hard to breathe.
There are two main forms of COPD:
- Chronic bronchitis, which involves a long-term cough with mucus
- Emphysema, which involves damage to the lungs over time
Most people with COPD have a combination of both conditions.
Causes
Smoking is the main cause of COPD. The more a person smokes, the more likely that person will develop COPD. But some people smoke for years and never get COPD.
If a person has a rare condition in which they lack a protein called alpha-1 antitrypsin, they can develop emphysema even without smoking.
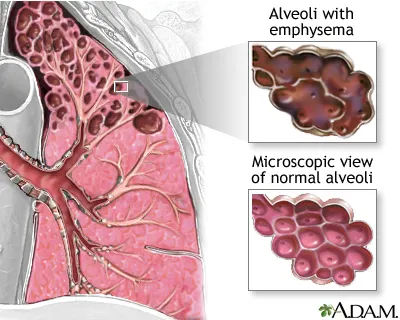
Other risk factors for COPD are:
- Exposure to certain gases or fumes in the workplace
- Exposure to heavy amounts of secondhand smoke and pollution
- Frequent use of a cooking fire without proper ventilation.
- Treatment for COPD
- The first and most important treatment of COPD in smokers is to stop smoking. Medications and other therapies are available tohelp treat nicotine addiction and to help you stop smoking. Formore help on stopping smoking, see the ATS Patient informationSeries fact sheets on Tobacco.
Medications can also be prescribed to help relieve symptoms
of COPD and to prevent symptom flares (called exacerbations)
that can lead to further loss of lung function. - Some generalclasses of medications include those that aim to widen the
airways (bronchodilators), reduce swelling in the airways (antiinflammatory drugs, such as steroids), and/or treat infections
(antibiotics). Other than antibiotics, most COPD medications
should be taken every day, usually for life. Stay as healthy aspossible. Avoid contact with those who are sick, wash hands often, get a yearly flu vaccine, and get pneumonia and COVID-19 vaccines when recommended by your healthcare provider.
In some people, COPD can also cause the oxygen level in the
blood to be low. If this occurs, a person can be given supplemental
oxygen. Breathlessness should not be confused with low oxygen
levels. People with COPD can experience shortness of breath or
have a hard time breathing even if they have good oxygen levels.Therefore, breathlessness is not always a good guide for whether you need to use oxygen (See ATS Patient Information Series fact
sheet on Breathlessness). - Proper nutrition and staying in good physical shape are also important not just for symptom relief but also for your quality of life. Pulmonary rehabilitation programs offer supervised exercise and education for those with breathing problems and should be a part of a comprehensive treatment plan for anyone with COPD. Community support groups can provide education and opportunities for COPD patients and their caregivers to share their experience with other people with COPD and families. In some cases, surgical procedures such as lung volume reduction
surgery or lung transplantation may be options to consider (See
ATS Patient Information Series fact sheets on Surgery for COPD
and Lung Transplantation).
4. cirrhosis
surgical manegement :
-
Laboratory tests. Your doctor may order blood tests to check for signs of liver malfunction, such as excess bilirubin, as well as for certain enzymes that may indicate liver damage. To assess kidney function, your blood is checked for creatinine. You'll be screened for the hepatitis viruses. Your international normalized ratio (INR) is also checked for your blood's ability to clot.
Based on the blood test results, your doctor may be able to diagnose the underlying cause of cirrhosis. He or she can also use blood tests to help identify how serious your cirrhosis is.
- Imaging tests. Magnetic resonance elastography (MRE) may be recommended. This noninvasive advanced imaging test detects hardening or stiffening of the liver. Other imaging tests, such as MRI, CT and ultrasound, may also be done.
- Biopsy. A tissue sample (biopsy) is not necessarily needed for diagnosis. However, your doctor may use it to identify the severity, extent and cause of liver damage.
If you have cirrhosis, your doctor is likely to recommend regular diagnostic tests to monitor for signs of disease progression or complications, especially esophageal varices and liver cancer. Noninvasive tests are becoming more widely available for monitoring.
Surgical risk is increased in patients with cirrhosis. The magnitude of perioperative risk correlates with the degree of hepatic decompensation.
Stratification by Child's Class
Since the 1970s, the standard for assessing perioperative morbidity and mortality in patients with cirrhosis has been the CTP scoring system, which is based on the patient's serum bilirubin and albumin levels, prothrombin time, and severity of encephalopathy and ascites (1). The studies that led to this standard have all been retrospective and limited to a small number of highly selected patients, but the results have been remarkably consistent. Two of the most important studies, separated by 13 years, reported nearly identical results: mortality rates for patients undergoing surgery were 10% for those with Child class A, 30% for those with Child class B, and 76–82% for those with Child class C cirrhosis (Table 3) (9, 10). In addition to predicting perioperative mortality, the Child class correlates with the frequency of postoperative complications, which include liver failure, worsening encephalopathy, bleeding, infection, renal failure, hypoxia and intractable ascites.
TABLE 3
Mortality Rates Associated With Specific Types of Surgery in Patients With Cirrhosis
| Type of Surgery | Mortality |
||||
|---|---|---|---|---|---|
| Overall | Child Class |
MELD Score | |||
| A | B | C | |||
| Appendectomy | 9% | NA | NA | NA | NA |
| Cardiac | 16–17% | 0–3% | 42–50% | 100% | NA |
| Cholecystectomy | 1–3% | 0.5% | 3% | NA | <8 = 0% ≥8 = 6% |
| Colorectal cancer surgery | 12.5% | 6% | 13% | 27% | NA |
| Esophagectomy | 17% | NA | NA | NA | NA |
| Hepatic resection | 9% | 9% | NA* | NA | <9 = 0% ≥9 = 29% |
| Major abdominal surgery | 26–30% | 10% | 30–31% | 76–82% | NA |
| Total knee arthroplasty | 0% | 0% | NA | NA | NA |
| Treatment of hepatic hydrothorax with talc | 39% | NA | NA | NA | NA |
*The exact number of Child class B patients was not available for this study; however, the overwhelming majority of patients had Child class A cirrhosis.
Even in patients with Child class A cirrhosis, the risk of perioperative morbidity is increased when there is associated portal hypertension. Postoperative morbidity in such patients, and possibly in patients with Child class B and C cirrhosis, may be reduced by preoperative placement of a transjugular intrahepatic portosystemic shunt (TIPS) (11–13).
Several other factors can increase the perioperative risk above and beyond the Child class. Emergency surgery is associated with a higher mortality rate than non-emergent surgery: 22% versus 10% for patients in Child class A; 38% versus 30% for those in Child class B; and 100% versus 82% for those in Child class C (10). A diagnosis of chronic obstructive lung disease and surgery on the respiratory tract are also independent risk factors for perioperative mortality in patients with cirrhosis (14).
A general consensus is that elective surgery is well tolerated in patients with Child class A cirrhosis, permissible with preoperative preparation in patients with Child class B cirrhosis (except those undergoing extensive hepatic resection or cardiac surgery, see later), and contraindicated in patients with Child class C cirrhosis (15).
Pre-operative patient preparation and surgical techniques
Preoperatively, patients with coagulopathy were given vitamin K, and fresh frozen plasma (FFP) if international normalization ratio (INR) was elevated (given pre-induction), and platelets if platelet count was less than 50,000/μL. Furthermore, control of ascites, nutritional support, and upgrading of the liver condition were done in patients with higher CTP grades. In CTP class late B, and C patients; a conservative treatment was our 1st choice, however, its failure pushed us to do emergency LC with PC trial in some cases. Anesthesia that was performed by the anesthetic author of the manuscript was induced with Diprivan, Fentanyl, muscle relaxant and maintained with inhalation non-hepatotoxic anesthetics (i.e. Isoflurane or Sevoflurane) supplemented with muscle relaxant and Fentanyl. LC and PC were done by the surgical and the intervention radiology authors of the manuscript respectively.
The standard 4-trocar technique was applied for LC maintaining pneumoperitoneum at a pressure of 14 mmHg with some modifications [1]: Application of a 5th port in some cases for elevation of the hypertrophied left lateral liver segment [2], The subxiphoid port was placed more to the right of the midline, while the umbilical port was put on the right, left of the midline or below the umbilicus by open Hasson technique to avoid injury to the falciform ligament recanalized umbilical vein [3].Abdominal wall collaterals were assessed pre-operatively by abdominal CT; moreover, trans-illumination of the abdominal wall during port placement was done to identify these collaterals preventing catastrophic bleeding [4], Avoiding excessive traction to prevent avulsion of gallbladder from its bed, aspiration of gallbladder content (empyema or mucocele) to facilitate its grasping, and avoiding blunt dissection Fig. 1 [5] careful dissection by using either Harmonic device (Ethicon Endo-Surgery, Cincinnati, OH) in some cases (its use was according to its availability or intra-operative findings (i.e. numerous collaterals and/or marked adhesions)), Fig. 3, Fig. 4A or monopolar electrocautery in other cases, Fig. 4B moreover, good hemostasis of gallbladder bed was done by using Argon device, Fig. 5Aoxidized cellulose (Gelfoam) (Pfizer, New York, NY), surgicel (Johnson & Johnson, New Brunswick, NJ) Fig. 5B and/or radiofrequency ablation (Habeeb sealer), furthermore, preparation of sufficient amount of FFP, platelets, and packed red blood cells (PRBCs) was done to be used when needed.
Stratification by MELD Score
The MELD score was created to predict mortality after TIPS, then implemented to risk stratify patients awaiting liver transplantation, and more recently utilized to predict perioperative mortality. (16) The MELD score is a linear regression model based on a patient's serum bilirubin and creatinine levels and international normalized ratio (INR). The MELD score has several distinct advantages over the Child classification: it is objective, weights the variables, and does not rely on arbitrary cutoff values. Each one-point increase in the MELD score makes an incremental contribution to risk, thereby suggesting that the MELD score increases precision in predicting postoperative mortality (17).
A number of studies have examined the MELD score as a predictor of surgical mortality in patients with cirrhosis (see Table 3). In a retrospective study of 140 patients with cirrhosis who underwent surgery, a 1% increase in mortality for each one-point increase in the MELD score from 5 to 20 and a 2% increase in mortality for each one-point increase in the MELD score above 20 was observed (18). The largest retrospective study of the MELD score as a predictor of perioperative mortality, by Teh and colleagues (19), evaluated 772 patients with cirrhosis who underwent abdominal (other than laparoscopic cholecystectomy), orthopedic, and cardiovascular surgery. Patients' median preoperative MELD score was 8, and few had a MELD score greater than 15. In addition, most patients had a platelet count greater than 60,000mm3/L and an INR less than 1.5. In this selected cohort, patients with a MELD score of 7 or less had a mortality rate of 5.7%; patients with a MELD score of 8 to 11 had a mortality rate of 10.3%; and patients with a MELD score of 12–15 had a mortality rate of 25.4% (Figure 1). The increase in relative risk of death was almost linear for MELD scores greater than 8.
POSTOPERATIVE MONITORING
Postoperatively, patients with cirrhosis need to be monitored for the development of signs of hepatic decompensation, including encephalopathy, coagulopathy, ascites, worsening jaundice and renal dysfunction. When any of these indicators is found, supportive therapy should be initiated immediately. The prothrombin time is the single best indicator of hepatic synthetic function. An elevated serum bilirubin can indicate worsening hepatic function but can be elevated for other reasons, including blood transfusions, resorption of extravasated blood or infection. Renal function must be monitored closely. When renal dysfunction is found, the cause should be established and treatment initiated.
Hypoglycemia may occur in patients with decompensated cirrhosis or acute liver failure as a result of depleted hepatic glycogen stores and impaired gluconeogenesis. Serum glucose levels should be monitored closely when postoperative liver failure is suspected.
Careful attention should be paid to the assessment of intravascular volume, which is often difficult to assess in the setting of extravascular volume overload. Intravascular volume maintenance minimizes the risk of hepatic and renal under-perfusion. On the other hand, infusion of too much crystalloid may lead to acute hepatic congestion, increased venous oozing and pulmonary edema, and to postoperative ascites, peripheral edema and wound dehiscence.
5. Recent advance techniques used in COPD :
During recent years, several major advances have occurred in the comprehension of respiratory physiology in COPD. Many may have significant clinical implications regarding the disease definition and diagnosis, estimation of prognosis using functional indices, assessment of therapeutic indications and response to treatments. They mostly relate to spirometry, exercise testing, pulmonary mechanics and respiratory muscles.
Spirometry
Optimal criteria to define COPD-related airflow obstruction
The definition of obstruction remains a highly controversial issue. Current Global Initiative for Chronic Obstructive Lung Disease (GOLD) guidelines continue to define airflow limitation by a fixed FEV1/forced vital capacity (FVC) threshold of 0.7, independently of age and sex. This is in marked contradiction with American Thoracic Society (ATS)/European Respiratory Society (ERS) guidelines, which clearly recommend that the lower limit of normal (LLN) criterion is used. Several large series in which investigators assessed lung function in adults challenge the GOLD guidelines. The first study [27], performed in 14,506 adults, found that the fixed ratio (as compared to the 1993 European Community for Steel and Coal (ECSC) study [28]) has a high negative but a low positive predictive value, particularly in patients aged >50 yrs (fig. 1⇓): the false positive rate was 33% in the 61–70 yr age range. Similarly, in the NHANES-III (Third National Health and Nutrition Examination Survey) population, the proportion of older adults misclassified by the fixed ratio was nearly one-fifth, whereas nearly one-half of young adults were false-negative with GOLD guidelines, in comparison with the fifth percentile criteria [29]. A third study compared the GOLD and British Thoracic Society (BTS) guidelines (FEV1/FVC <0.7 for both, BTS requiring also a FEV1 <80% predicted) to published equations (including ECSC/ERS) and their corresponding LLN [30]. The prevalence of airway obstruction according to these criteria was evaluated in the NHANES survey, a health survey in England (UK) and a longitudinal study in Dutch population. With most prediction equations, the LLN was <0.7 at a mean age of 42 yrs in males and 48 yrs for females. The prevalence of obstruction with the 0.7 criterion reached 45% in healthy subjects aged 60 yrs or more. Using LLN derived from prediction equations lowered the prevalence to between 12.3% and 15.5% in healthy lifelong nonsmokers. Underestimation of airflow obstruction in younger patients with the GOLD criteria was confirmed in a longitudinal study [31]. Among adults aged 20–44 yrs included in the European Community Respiratory Health Survey (1991–1993) and re-evaluated in 1999–2002, the LLN criteria detected 5.1% of patients with airflow obstruction, among whom only 45.6% were below the 0.7 cut-off. Subjects with airflow obstruction that were missed by the fixed ratio were younger and 64% were females. During follow-up, the proportion of subjects exhibiting a FEV1 <80% pred, chronic cough or phlegm, or being treated for respiratory problems was significantly higher in misidentified subjects than in those without airflow obstruction by both criteria.
New diagnostic techniques
High-resolution computed tomography (HRCT)Other Section
X-ray computed tomography (CT) has been in commercial use since 1972 (3), and has been revolutionary in providing insight into pulmonary structure and function in vivo. The technology involves an X-ray beam source with a row of detectors positioned opposite—the source and detectors are assembled in a circular arrangement that rotates around the patient through 180 degrees. Measuring the attenuation of narrow X-ray beams as they pass through tissues of varying densities allows the construction of a 2-dimensional (x,y) axial ‘slice’ through the body. The digitised image slices are comprised of pixels with relative ‘densities’ [measured in Hounsfield Units (HU)] that are representative of the tissue density in that location. Early scanners used relatively thick, contiguous slices that were obtained along the cranio-caudal (z) axis as the patient was moved stepwise through the scanner.
High-resolution CT achieves its increased spatial resolution by the use of thinner detectors, which allows the effective thickness of the axial slices to be reduced, usually to around 1 mm. The physical size of the X-ray detectors is therefore one of the determinants of resolution, while scanning technique is the other and more dominant determinant of spatial resolution. The high-resolution technique traditionally involves axial or 2-dimensional scanning, i.e., subjects are stationary during a single tube rotation to acquire a single cross-sectional slice. Because of the increased time and radiation required to perform contiguous thin slices, the slices are typically separated along the z axis by an interval of around 10 mm, which minimises total radiation exposure but images only 10 percent of the lung. It is therefore suitable for imaging the lung parenchyma but not for detecting, for example, mass lesions.
These days, almost all CT scans are performed in ‘helical’ or ‘spiral’ mode, rather than the older axial technique. That is, the patient is moved continuously through the scanner during tube rotation, effectively producing a ‘cork-screw’ motion. In this way, 3-dimensional or volumetric data is obtained; the faster the patient is moved through the rotating tube (pitch), the faster the acquisition time and the lower the radiation exposure. However, this effectively produces greater blurring of the images and reduces spatial resolution. Hence imaging technique, including tube current and voltage, once again has a large effect on spatial resolution.
Post-processing of the raw image data produces reconstructions in three orthogonal planes, which are most commonly displayed as axial images. Reconstruction also involves algorithms to produce images that are optimised for diagnostic viewing, such as ‘high-resolution reconstruction algorithms’. These produce sharper but noisier images. Advances in CT technology have led to faster tube rotation, greater detector sensitivity and more rows of detectors – now up to 128 rows. This has greatly reduced acquisition time and reduced breath artifact; computer algorithms are able to correct for artifacts related to image inconsistency and motion (4). Axial slices of any thickness can be reconstructed, down to around 0.5 mm thickness (see Figure 1). However, at this level, spatial resolution is determined more by scanning technique (e.g., table speed) than by reconstructed slice thickness. There may therefore be no major advantage in such thin reconstructions. Modern post-processing techniques also allow true 3-dimensional reconstruction of the entire lung, airways and vasculature. Whether these are clinically useful is arguable.

Assessment of emphysema
HRCT is ideal for the detection and characterisation of emphysema (5). Moreover, it is very straightforward to use HRCT images to quantify the extent of emphysema. Older, standardised visual scoring systems to quantify emphysema (6) were subject to a high degree of inter- and intra-rater variability (7). More recent computer-automated quantification tools have removed the subjectivity of scoring (7). Emphysematous lung is represented by image voxels (the unit of a 3-dimensional image dataset) of density less than around –900 HU, which equates to a density of around 0.1 g/mL (water has a density of 1 g/mL). Identification of all voxels of density less than this threshold is a process commonly known as ‘density masking’, and the volume of the emphysematous lung can be calculated by multiplying the voxel numbers by the known volume of the voxels (8). A commonly used index is the percentage of low-attenuation areas (LAA%), which expresses the emphysema volume as a proportion of total lung volume measured by CT. The LAA% has been shown to correlate with FEV1 (9-11), diffusing capacity for carbon monoxide (DLCO) (9), the frequency of COPD exacerbations (12), BODE index and quality of life scores (13). These relationships confirm that the severity of emphysema is a determinant of the severity of airflow limitation as well as the clinical expression of disease.
A proposed clinical application of quantitative CT is in the longitudinal monitoring of emphysema progression. In the ECLIPSE study, which was a 3-year prospective, multi-centre observational study of COPD patients, emphysema progressed and became more extensive over the study period (14). The observations also confirmed that the extent of emphysema predicted the rate of decline of FEV1 (15). Although it may be useful in identifying the so-called ‘emphysematous phenotype’, the ECLIPSE study also re-emphasised the marked clinical heterogeneity among COPD patients (16). More work is therefore needed to determine precisely how changes in CT emphysema over time translate into clinically important outcomes.
The LAA% gives an estimate of emphysema quantity, but not its distribution. The importance of emphysema distribution was demonstrated in the NETT (National Emphysema Treatment Trial) study of patients undergoing lung volume reduction surgery (LVRS). In this study, patients who had predominantly upper lobe emphysema (i.e., localised or heterogeneous emphysema, so-named because of the obvious differences in emphysematous and relatively preserved regions in the same lung) had improved survival following LVRS compared to the control group. In contrast, those in whom emphysema was not localised but rather spread out over a large proportion of the lung had poorer clinical outcomes (17).
In addition to this spatial heterogeneity, emphysematous lesions also exhibit so-called ‘fractal geometry’. This is measured by identifying emphysematous clusters, i.e., a discreet and isolated zone of emphysema. In COPD, there is a large number of small emphysematous lesions but only a small number of large lesions or cysts. Plotting a cumulative frequency of emphysematous lesion size in log-log space results in a linear relationship with a negative slope (18). The slope of that relationship is the ‘fractal dimension’, with a more negative slope indicating a more heterogeneous distribution of emphysema zone sizes. As an example of its clinical significance, Coxson et al. (19) showed that the fractal dimension derived from the pre-operative CT predicted the change in exercise capacity following LVRS. Although this complex CT assessment of emphysema appears to have some clinical significance, its potential role in routine clinical practice remains unclear.
Assessment of airways
Airways are also visible in HRCT image data, down to approximately generation 6 or 7. In COPD, changes in small airways (terminal and respiratory bronchioles) are considered to be the among the earliest signs of disease (20) and precede the development of emphysema (21). However, CT airway measurement is much more difficult than measurement of emphysema for a number of reasons. Firstly, airway branching is asymmetrical (in terms of length and calibre of bronchi) and hence ‘functional’ classification of individual airways cannot be made by simple counting of generations (22). Indeed, the small airways (0-2 mm in diameter) can be found anywhere between the 4th and 14th generations (22). Secondly, the measurable parameters of airway geometry (such as airway wall thickness and luminal area) vary greatly by anatomical location (23). Finally, since the major site of airflow obstruction in COPD is in airways with dimensions less than 2 mm (20,21), the primary area of pathology is generally below the resolution of conventional HRCT.
Early attempts at quantitative analysis of visualised (generally large to medium sized) airways involved manual tracing of internal luminal area (Ai), outer area (Ao) and the calculation of wall area (Aw). Computer algorithms using a density mask have been used to automate this process, whereby circles surrounding the airway lumen are progressively ‘eroded’ based on density measures until the airway wall and lumen are identified (24). Another method known as the full-width-half-maximum method has been used to identify internal and external wall edges. This principle uses density analysis along radial ‘spokes’ from the centroid of the lumen, and identifies the wall edge as the point where density is half way between the local minimum and local maximum along each spoke (10). A well-documented problem is that CT measurement systematically over-estimates Aw and underestimates Ai, a feature that alters with airway angle and becomes more pronounced with decreasing airway calibre (24); mathematical corrections can be applied to overcome this error. Automated airway measurements have been validated for larger airways (down to the 6th generation) (25,26), but concerns regarding accuracy continue to limit their use.
Measurement of the small airways is even more problematic. Although large airway wall thickness correlates with symptoms (27) and lung function (10,25) in COPD, and may be predictive of small airway abnormalities (28), direct measurement of small airway geometry by CT has remained elusive. ‘Air trapping’ is an indirect HRCT measurement of small airway dysfunction, where lung lobules remain inflated due to airway obstruction and hence show a less-than-normal increase in attenuation during expiration, creating a mosaic pattern of attenuation. However, this phenomenon is observed to a degree even in healthy, non-smoking individuals without airflow obstruction (29,30). In COPD, this method is further complicated by the presence of emphysema, which itself shows low-attenuation during expiration (31). Although attempts at quantifying air trapping in the presence of COPD have been made (31,32), more validation studies are needed to determine the best method. For now, at least in the clinical setting, it seems that air trapping on CT will remain a more qualitative marker of small airways disease, and probably adds little to the diagnosis or monitoring in COPD.
Ventilation CT
Although anatomical information from CT is of value for diagnosis and assessment of disease severity, there is likely added benefit when it is combined with imaging-derived measurement of lung function. For example, the distribution of inhaled xenon (Xe) gas (which is radiopaque, and distributes into the airways and alveoli on inhalation) can be measured by its CT attenuation. The CT density of these Xe-containing airspaces increases linearly with Xe concentration (33). In this way, specific ventilation (i.e., ventilation per unit lung volume) can be measured and the regional distribution of ventilation explored. New dual-energy (i.e., two X-ray sources) CT allows both dynamic and static evaluation of regional ventilation, and simultaneous acquisition of anatomical and ventilation images (34). This eliminates the problems of serial scanning, such as differences in breath-hold volume affecting density, and spatial misregistration of the two scans (35). Dual-energy Xe gas ventilation scanning has been shown to reliably quantify both emphysema and airways disease (36).
Limitations of CT
In addition to problems with spatial resolution, CT has other important limitations. For example, there are minimal data regarding normal ranges for airway dimensions (37) and currently no consensus standards for validation and quality control of CT airway measurement—a prerequisite for high-quality, longitudinal studies. Perhaps the most important limitation of CT is the risk posed by ionising radiation, particularly with serial scanning (38). Quantitative measurements using current-generation detectors with low-dose protocols may be acceptable for certain applications (39) but the reduced signal-to-noise ratio poses an additional challenge when assessing small airways (40,41).
Ultra-high-resolution imagingOther Section
Like all diagnostic tools, imaging techniques need to be verified against a gold standard test. In the case of COPD, this would be histopathological evaluation of lung tissue. However, even as a gold standard, histopathology itself has problems: tissue changes from fixation, cutting and drying as the specimen is processed cause measurement error; the small size of specimens may introduce sampling error; and analysis is generally performed in two (or even single) dimensions, giving only estimates of the 3-dimensional structure (42). The use of ultra-high-resolution imaging techniques is aimed at countering these problems.
Micro-computed tomography (micro-CT)
Micro-CT is similar to conventional CT in that it uses an X-ray source and detectors that are arranged around the study object. Like conventional CT, full volumetric data is captured. However, the source and detectors are brought much closer to the specimen, and the specimen itself is rotated while the X-ray source and detectors stay stationary. This allows exceptionally higher resolution (down to 1 µm per voxel), which is ideal for studying the lung microstructure including that of the small airways. The trade-offs are that only small specimens, i.e., excised tissue or small animals, can be imaged. Furthermore, the samples are exposed to high radiation doses that are damaging to living tissue.
Micro-CT was first used to image lung parenchyma by Watz et al. (43), who used a hot formalin vapour fixation technique and silver nitrate staining to provide the necessary contrast. This provided spectacular images of alveoli and terminal airways, and even allowed a “virtual bronchoscopy” through an alveolar duct (43). The technique has subsequently been validated against light microscopy in mouse lungs (44). It has also been used to generate gold-standard airway measurements from explanted lung to calibrate 3-dimensional airway measurements made by whole body HRCT (45). Figure 2 demonstrates the spectacular detail obtained using micro-CT of the lung. In COPD, micro-CT has been used to demonstrate the loss of terminal bronchioles in early-stage disease, which has been suggested to precede the microscopic emphysematous destruction of the alveoli (21).

Although living, in vivo human studies are precluded (due to both specimen size and the radiation dose), micro-CT has provided fascinating insights into the structural changes in COPD. The technology, in its currently form, will likely remain limited to research. It may play a future role in, for example, developing disease-modifying therapies in animal models.
Synchrotron imaging
This form of imaging utilises the properties of particle beams, e.g., electrons, in a particle accelerator. The particles are in continuous motion at near the speed of light, held in line by electromagnetic fields. When the particles are accelerated further they emit X-rays with a wide energy range, allowing a wide range of samples to be imaged, and a high photon flux, which allows fast acquisition times. The result is an image with resolution in the 1-10 µm range (46), which is ideally suited to studying the microstructure of fine tissues such as the lung.
The technique has been used to define the structure of both mouse (47) and human (48) lung acini ex vivo, as well as in vivo whole mouse lungs (49). The high temporal resolution also makes functional imaging possible, including pulmonary acinar mechanics (50) and regional ventilation (51,52). In COPD mouse models, it has been used to identify early emphysematous changes (53,54). While the anatomical detail is impressive, synchrotron imaging is yet to provide significant functional information on human lungs, being hampered by the limitations of specimen size (necessitating excised tissue or small animals only), radiation damage to tissues, and the need for a particle accelerator.
Nuclear medicine imagingOther Section
Unlike CT imaging methods, which are based on the relative absorbance of radiation transmitted through the tissues from an external source, nuclear medicine techniques utilise tracers that emit radiation and are introduced into the organs. This has been used to image a variety of body tissues and organs, including bone, the heart and the brain. Nuclear medicine scanners are in routine clinical use for the diagnosis and staging of malignancy. They have also long been used for the diagnosis of pulmonary embolism (PE)—this involves intravenous injection of radioisotopes to the pulmonary vasculature and inhalation to the peripheral airspaces, thus giving functional images of ventilation and perfusion.
Positron emission tomography (PET)
PET is a 3-dimensional nuclear imaging technique, which utilises radioisotopes that emit positrons as they decay. A positron is a sub-atomic particle found in the nucleus, with the same molecular weight as an electron. As the positron makes its way out of the nucleus, it encounters a free electron—these two oppositely-charged particles combine and ‘annihilate’ each other. In the process, two identical beams of gamma-radiation are emitted at 180 degrees to each other—beams detected at or very near the same time are considered to be ‘coincident’ i.e., from the same source. The location of the source particle can therefore be determined geometrically from coincident beams, being located on a straight line between the two detectors. However, this localisation is affected by beam scatter, the presence of random coincidences, and by attenuation as the beams travel through tissues of different densities. Corrections for this image noise can be made during image processing, which includes the use of a tissue density map i.e., a CT scan. Many scanners incorporate multi-detector CT (PET-CT) so that, in addition to providing a tissue density map for attenuation correction, organ function can be superimposed onto the CT images. This image co-registration has an obvious application in oncology for localisation of active tumour cells for targeted treatment.
The most commonly used PET radioisotope is fluorine-18, which has a half-life of approximately 110 minutes. This isotope is attached to fluorodeoxyglucose (FDG, a glucose analogue) to form the radiotracer 18F-FDG. The radiotracer is taken up by metabolically active tissue—a property used to identify cancerous tissue in the lungs and surrounding structures. In COPD, 18F-FDG has been used to demonstrate an increase in neutrophilic inflammation in the lungs compared to controls and to those with alpha-1 antitrypsin deficiency-associated emphysema (55). This provides interesting insights into COPD pathophysiology and is a non-invasive, in vivo measurement. However, it is also potentially useful in studies of new therapies targeting neutrophils, given their role in the pathogenesis and pathophysiology of COPD (56).
Regional ventilation can also be measured by PET using the PET isotope nitrogen-13 (13NN) gas dissolved in saline. A peripheral venous injection of this tracer enters the lung via the pulmonary arterial circulation. Due to its low tissue solubility, the 13NN then rapidly diffuses across the alveolar membrane. An initial breath-hold during injection allows the 13NN to enter the lung in direct proportion to blood flow, which allows measurement of regional perfusion. Regional ventilation can subsequently be measured by the decrease in 13NN activity over time as the subject breathes, clearing the 13NN in direct proportion to ventilation (57). Combining this information thus produces the regional distribution of lung ventilation/perfusion ratios (V/Q). Quantification of regional V/Q by PET has been shown to correlate closely with global measures of gas exchange such as arterial partial pressure of oxygen (PaO2) (58). Using this 13NN technique in COPD, Brudin and colleagues (59) reported that high V/Q tended to be more common in subjects with an emphysematous phenotype, whereas low V/Q was more common in those with a small airways disease phenotype. This is consistent with the archetypal concept of ‘pink puffers’ and ‘blue bloaters’.
While much of the focus in COPD is on airways disease and changes in regional ventilation, there has been an increasing focus on the role of the pulmonary vasculature in this disease. Vidal Melo et al. (60) found that regional heterogeneity in Q was increased in patients with mild COPD compared to healthy controls, in a manner that was independent of changes in regional tissue density. This very interesting finding suggests that regional changes in pulmonary blood flow, perhaps due to inflammation, may precede lung parenchymal changes in COPD. This may have utility as a biomarker for early disease.
One limitation of PET, with its short half-life radioisotopes, is the need for a cyclotron and radiopharmaceutical formulation often on-site. Additionally, for repeated studies, the radioisotope has to decay enough to avoid signal contamination. Adjustments following a ‘baseline’ scan prior to repeat administration help overcome this problem, however rapid, repeat testing is generally not possible. The spatial resolution of PET does not allow imaging of individual gas exchange units, although it is probably sufficient to separate physiologically meaningful differences in regional ventilation.
In spite of these limitations, and its relatively recent inception, PET may have a significant future in the study of COPD. The recent findings regarding regional distribution of blood flow may provide insight into the role of vascular remodeling, especially with regard to longitudinal changes and therapies targeted at this process.
Single-photon emission computed tomography (SPECT)
SPECT is similar to PET in that a radiotracer is introduced to the body, and the radiation it emits is detected externally. However there are several key differences. SPECT radioisotopes emit a single gamma-beam as they decay, as opposed to the two gamma beams emitted simultaneously from PET isotopes. This results in a lower radiation exposure to the patient, at the expense of an increased acquisition time per image. Increased scanning time may decrease resolution due to movement artifact, although there have been attempts to overcome this with breath hold/respiratory gating (61). The spatial resolution of SPECT is less than that of PET, however it is more widely available, and SPECT radiotracers are easier and cheaper to manufacture. SPECT has been a major advance in nuclear imaging for suspected PE (62), as opposed to the traditional planar lung scintigraphy. The more recent appearance of SPECT-CT fusion has helped overcome a lot of the resolution and anatomical registration problems, and can provide true 3D assessment of regional lung function (63,64).
In addition to its diagnostic role for PE, SPECT can give us insights into pulmonary physiology, both with respect to ventilation and perfusion. Perfusion scanning is generally performed using 99m-technecium labeled macro-aggregated albumin (99mTc-MAA), which lodges in the pulmonary circulation after peripheral injection. Ventilation scanning requires inhalation of gaseous radioisotopes or radiolabeled particulate aerosols. A true gas distributes throughout the whole lung, and differences in its regional distribution reflect differences in regional ventilation. Dynamic SPECT could therefore potentially give information on the time course of ventilation in different lung regions. Both 81mKr (65) and 133Xe (66) have been used to demonstrate ventilation heterogeneity in COPD.
Unlike true gases, particulate aerosol tracers are ‘deposited’ in the lung and have the advantage that imaging can be performed without the tracer continuously redistributing. Also, aerosols will not distribute by collateral ventilation between lung units, which is increased in COPD compared with healthy lungs. However, aerosol particles of a diameter 0.5-1 µm are 1,000 times larger than gas molecules and are therefore transported by convective ventilation only (67). The distribution of radioaerosols therefore neglects diffusive ventilation, which is the predominant mode of gas transport within acini beyond the terminal bronchiole (68). In COPD, airway narrowing and emphysematous destruction likely brings the convection-diffusion front more centrally so that a larger volume of the lung ventilates by diffusion compared with healthy lungs. Therefore, the interpretation of inhaled radioaerosols distributions in COPD should take these physiological changes into account (69).
A commonly used aerosol tracer is 99m-technecium-labelled diethylene triamine pentaacetic acid (99mTc-DTPA). The generated particle size is around 1 µm but this increases on entry into the airways due to agglomeration. These larger particles deposit onto large airways, particularly at airway branch points, causing ‘hot-spots’ on the ventilation image (70). Technegas is a 99mTc-labelled, aerosolised ultra-fine carbon particle of approximately 200 nm diameter. It is used routinely in Australia (where it was invented) and other countries in V/Q scanning for the diagnosis of PE. Due to its small particle size, the distribution of Technegas approximates that of a true gas (71), even in the presence of severe airflow obstruction (72) (Figure 3). Technegas deposits more homogenously, and is less susceptible to central airway deposition or movement after inhalation, than 99mTc-DTPA (73).

Magnetic resonance imaging (MRI)Other Section
MRI has the advantage of not requiring ionising radiation. Its usefulness for lung imaging has traditionally been limited by technical factors and, consequently, there has been much less MRI lung imaging in research and clinical practice compared with the modalities already discussed. The technique employs large magnetic fields, which alter the behavior of individual atoms. Conventional MRI utilises the nuclear spin properties of hydrogen atoms, found in abundance in water. In their natural state, hydrogen ions (or protons) spin on an axis in random orientations. The application of a strong and uniform magnetic field causes them to align parallel or anti-parallel to the field. When the magnetic field is switched off, the spinning protons return to their natural state and in the process release a burst of radiofrequency energy. It is this energy that is detected by the MRI scanner, and is used to construct the image. MRI has excellent anatomical resolution in tissues of high water content, such as the brain. However the lung, being mostly air, has a low density of hydrogen ions, meaning low signal intensity and poor signal-to-noise ratio. Conventional proton MRI images of the lung therefore have low contrast and contain little meaningful information. Additionally, being comprised of air-filled alveolar sacs, the lung has millions of air-tissue interfaces. Each of these causes decay of the radiofrequency signal as it travels through the lung, known as ‘susceptibility artifact’, which contributes to poor signal intensity (81). Such inherent limitations have left the lung relatively unexplored by MRI. However, the large potential for MRI imaging of the lung has been recognised for decades (82) and thus many attempts have been made to overcome these barriers.
Inhaled noble gas MRI
Inhaled noble gases have been used to overcome the aforementioned limitations (83). Unlike particulate aerosols, gases undergo ‘self-diffusion’ by random Brownian motion, where the gas molecules continually move further apart until stopped by a physical boundary. The speed and direction of movement is determined by the physical properties of the gas, and the likelihood of colliding with a neighbouring gas particle i.e., the local concentration of the gas. An example of a noble gas ventilation agent is hyperpolarised helium-3 which, unlike air, is highly excitable by a magnetic field and thus provides excellent MRI contrast. It diffuses freely in air at a rate of 0.88 cm2/s, which means that, over a timecourse of 2 ms, an individual molecule will travel 0.59 mm. Given that the typical acinar size is 0.3 mm, the diffusive movement of a molecule of 3He in an acinus will be limited by the alveolar boundaries within the 2 ms timeframe—that is, its diffusion will be ‘restricted’ from 0.88 to 0.2 cm2/s. The restricted gas molecule movement is measurable by MRI, and is known as the ‘apparent diffusion coefficient (ADC)’. A high ADC indicates that the alveolar walls are further apart, i.e., there is alveolar destruction or acinar expansion, which is an early sign of emphysema (84). The technique has been validated against histological specimens (2). It is increased in smokers who still have a normal FEV1, suggest that alveolar expansion and early emphysema are present even without clinical manifestation of disease (85). The ADC also correlates very closely with standard lung function measures including FEV1/FVC ratio, TLC and RV (85). In more advanced disease, the mean ADC correlates strongly with FEV1 (86) and DLCO (87), in fact more strongly than HRCT measures of emphysema (86,87).
From a functional perspective, ventilation can also be assessed using the properties of inhaled noble gases. Inhalation of the hyperpolarised gas distributes reasonably homogeneously in healthy young adults, but is heterogeneous in otherwise healthy elderly subjects (81). Regions of absent MRI signal, which indicate non- or poorly-ventilated lung units, have been shown to correlate with emphysema that is detectable by CT or the ADC (88). Ventilation defects may also be observed even in the absence of anatomically gross emphysema visible by CT (89,90). In this case, small airways disease, mucous plugging or a combination of both small airways diseases and microscopic emphysema are possible explanations for absent ventilation. This suggests that, like PET and SPECT, functional disturbances measured by MRI may be more sensitive markers of early abnormalities in COPD, compared with anatomical imaging by HRCT.
The ability of hyperpolarised 129Xe to diffuse across the alveolar membrane into the circulation allows gas exchange to be measured. There is a large chemical shift of 129Xe between the gas compartment, the dissolved (tissue and plasma) compartment and the red blood cells (91). By detecting the change in resonance frequency between these compartments, measures of the alveolar membrane thickness (91) and blood uptake (92) can be made. This technique has been used to demonstrate the influence of posture on regional perfusion heterogeneity (93) as well as ventilation heterogeneity (94) in COPD.
Oxygen-enhanced MRI
Although the use of hyperpolarised noble gases has greatly advanced the use of MRI for lung imaging, these gases are expensive to use, requiring specialised laser polarising equipment and dedicated detectors. 3He in particular is in limited and restrictive supply. There is therefore a need for simpler and less expensive contrast agents. Oxygen was suggested as a MRI contrast agent by Edelman (95) over 15 years ago as a way of overcoming the inherent limitations of conventional proton MRI and avoiding the problems of hyperpolarised gases. Ohno and Hatabu (96) have written a detailed review of the theory and application of oxygen-enhanced MRI. In basic terms, molecular oxygen is weakly paramagnetic and, in the concentrations found in air and in blood, provides little MR signal. The inhalation of 100% oxygen produces a high concentration of oxygen in alveolar tissue and in blood, where is it predominantly dissolved in plasma. The result is an increase in the signal intensity, which then allows visualisation of the pulmonary parenchyma. The difference between room-air and oxygen-enhanced images represents ventilation to that area. Edelman’s original publication (95) clearly showed ventilation defects in a patient with emphysema. Ohno and colleagues (97) showed that oxygen-enhanced MRI was as good as CT at quantifying pulmonary emphysema across a wide range of severities, and correlated reasonably well with FEV1 and DLCO. Recent work in subjects with COPD has shown increased heterogeneity of V/Q distribution measured by oxygen-enhanced MRI even in those without CT-defined emphysema (98), which varies with the severity of COPD (99).
The advantages of oxygen-enhanced MRI (OE-MRI) are that it is a simple, low-cost and safe alternative to hyperpolarised gas MRI. One of the limitations is that the gas itself is not directly visualised, but rather the tissue and blood, so that OE-MRI is only an indirect measure of ventilation. Another limitation is that the absorption of oxygen by circulating blood removes it from the lung unit, meaning there would inevitably be a difference between the wash-in and wash-out phases if they were measured. Additionally, the administration of 100% oxygen to patients, particularly those with advanced COPD, may alter the fundamental pulmonary physiology that we are attempting to measure (96).
Emerging imaging modalitiesOther Section
Optical coherence tomography (OCT)
OCT has emerged from the field of interventional pulmonology. It involves the measurement of lung structure from an endobronchial approach. Analogous to B-mode ultrasound but utilising light waves rather than sound waves, OCT involves the insertion of a near-infrared optical probe into the airway, with a sensor to detect back-scattered and reflected light waves. A detailed description of the physics of OCT is present in Huang’s seminal review of the topic (103). OCT images have sufficient resolution to distinguish between different tissue types within the airways, i.e., mucosa, sub-mucosa, lamina propria, cartilage, airway smooth muscle and alveoli. This ability of OCT can therefore potentially identify malignant tissue at the time of bronchoscopy, where the structural components of tissues are altered in their organisation, content and reflective properties (104).
Although there are few studies in subjects with COPD, OCT is ideally placed to measure the anatomical properties of small airways, being limited only by the physical reach of the probe and by the need for repeated measurements in different areas to obtain representative sampling. Miniaturised probes can be introduced down to the level of the terminal bronchiole (105,106). Coxson and colleagues demonstrated an excellent correlation between airway dimension measured by OCT and by CT (107). OCT may give more accurate measurement of airways size since, in this study, CT-measured dimensions tended to be larger than the OCT measurements. Furthermore, OCT airway dimensions measured at the 5th generation bronchi showed a strong negative correlation with the subject’s FEV1, and had greater discriminatory power for airflow obstruction than CT measurements (107). There was also an increase in %wall area and an increase the density of subepithelial structures in subjects with a lower FEV1 (107). Kirby et al. (108) reported a strong negative correlation between airway wall area and FEV1 in males COPD subjects but not in females, which is an interesting observation that may be relevant to the observed differences in disease behavior between the sexes .
Electrical impedance tomography (EIT)
As its name suggests, EIT measures differences in impedance to the flow of an electrical current through different tissues. A typical setup involves a set of surface electrodes, usually 16 to 32, positioned around a body structure. Through a pair of electrodes (the ‘drive pair’) a small current is applied. The potential difference between each pair of adjacent electrodes is then recorded, and hence the resistivity or impedance at that location can be determined. The process is repeated with each pair of electrodes acting as the drive pair, and a spatial map of resistivity is developed. This technique is ideally suited to pulmonary monitoring for several reasons. Firstly, the lungs, being filled with air, have naturally high impedance and are subject to large changes in volume during respiration. This gives a relatively large ‘swing’ in impedance that can be used to monitor breathing patterns and interventions. The change in electrical lung impedance is proportional to the change in gas content, which has been validated against other imaging modalities (111-113). Secondly, a decrease in impedance from initially high values could be used to detect focal consolidation/collapse or more diffuse changes in, for example, acute respiratory distress syndrome (ARDS). Thirdly, the short acquisition time provides enough temporal resolution for real-time monitoring of the lungs over long periods, as opposed to quasi-dynamic imaging of ventilation CT or nuclear medicine. Finally, being small and portable, EIT can be used in a variety of physical settings.
Part -b
1.
This is the most serious type of skull fracture and involves a break in the bone at the base of the skull. Patients with this type of fracture frequently have bruises around their eyes and behind their ears. They may also have clear fluid draining from their noses or ears. This fluid, called cerebrospinal fluid (CSF), is normally held closely around the brain within the dura mater. CSF may leak if the dura mater is torn. Patients with basilar skull fractures usually require close observation in the hospital.
Also, a skull fracture can be referred to as either compound or closed. In a compound fracture, bone exits and is visible through the skin, or a deep wound exposes the bone through the skin. In a closed fracture, bone is broken, but the skin is intact.
A compound fracture is considered an emergency. Seek immediate medical attention for this type of fracture.
Other terms used to describe a skull fracture are:
- Greenstick: The break is an incomplete fracture and the broken bone is not completely separated.
- Comminuted: The break is in three or more pieces.
Symptoms
The following are the most common symptoms of a skull fracture. However, each person may experience symptoms differently.
- Pain in the injured area
- Swelling in the injured area
- Obvious depression or abnormality in the injured area
- Warmth, bruising, or redness in the injured area
- Blood or clear fluid draining from the ears or nose
- Bruising behind the ears or around the eyes
- Facial weakness
Diagnosis
A diagnosis relies on physical examination and imaging studies of the head. During the examination, the physician obtains a complete medical history of the patient and asks how the injury occurred.
Imaging studies may include X-ray, magnetic resonance imaging (MRI) or computed tomography (CT) scan of the head. The preferred diagnostic imaging test is CT scan because it can show highly detailed images of the bone, tissue, and other structures in the head. Also, these imaging studies are used to check for possible injury to the brain.
Microscopy anatomy of skull
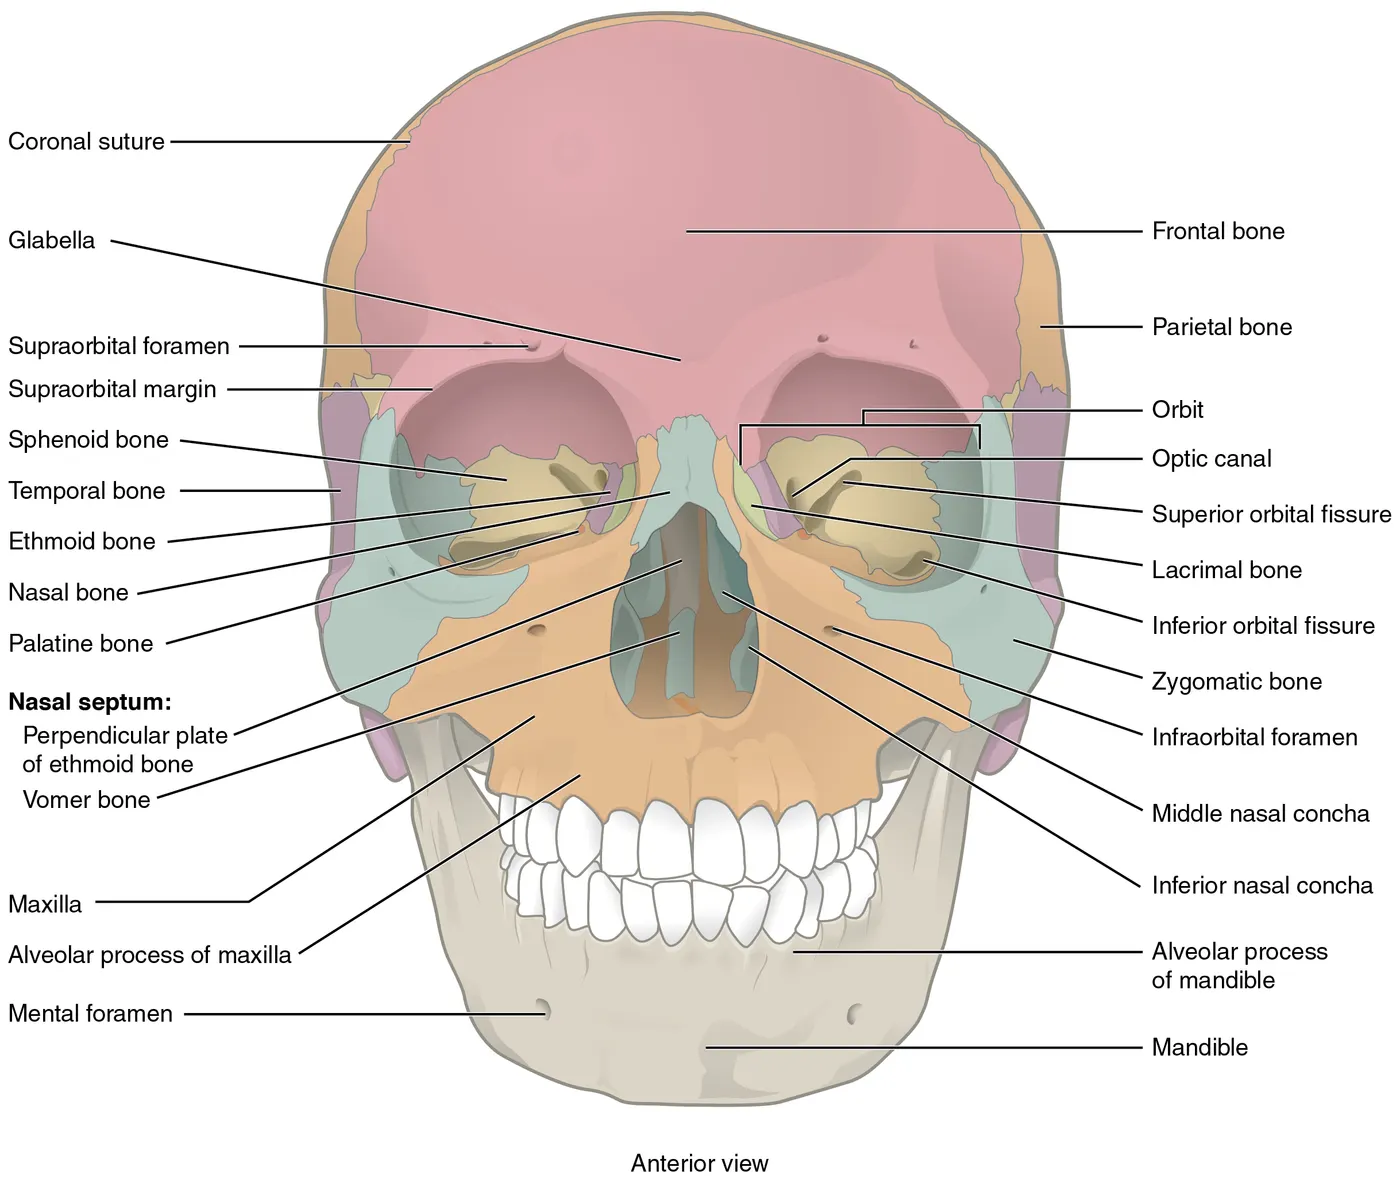
The cranium (skull) is the skeletal structure of the head that supports the face and protects the brain. It is subdivided into the facial bones and the brain case, or cranial vault . The facial bones underlie the facial structures, form the nasal cavity, enclose the eyeballs, and support the teeth of the upper and lower jaws. The rounded brain case surrounds and protects the brain and houses the middle and inner ear structures.
In the adult, the skull consists of 22 individual bones, 21 of which are immobile and united into a single unit. The 22nd bone is the mandible (lower jaw), which is the only moveable bone of the skull.
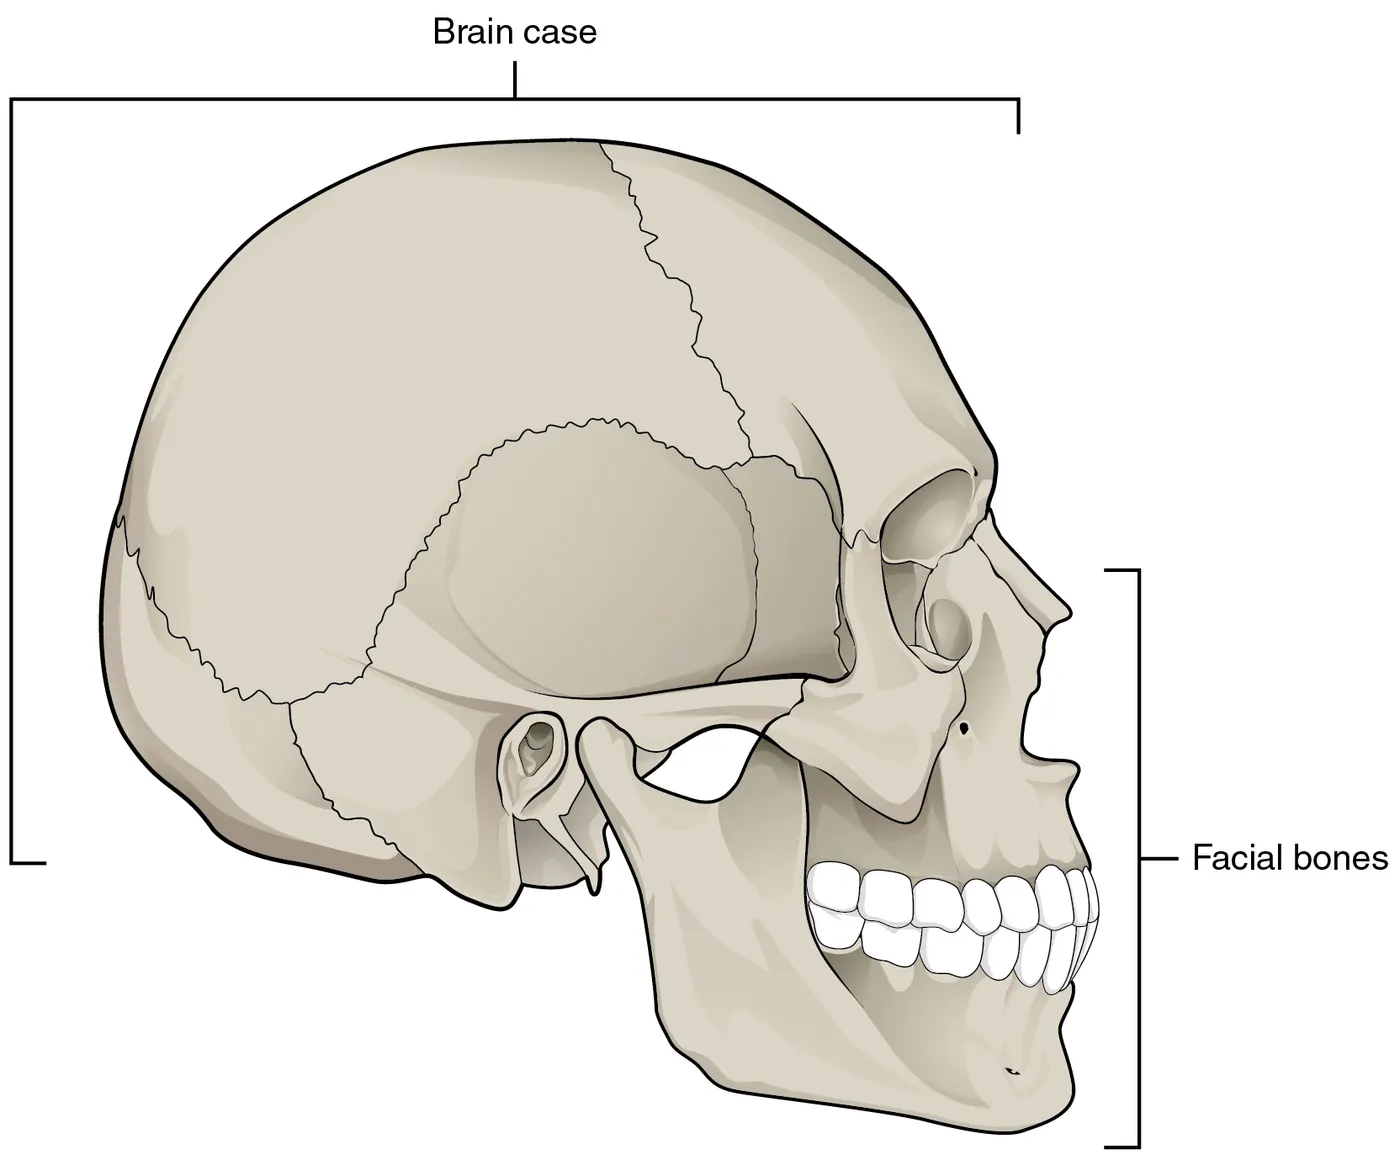
of the forehead. Below the orbit is the infraorbital foramen, which is the point of emergence for a sensory nerve that supplies the anterior face below the orbit.
blood supply in the brain :
bout fifteen percent (15%) of the daily cardiac output is utilized by the brain. Owing to the high oxygen and nutrient demand of the organ, it is supplied by two arterial systems:
- The anterior circuit is supplied by the internal carotid arteries
- The posterior circuit is supplied by the vertebrobasilar system.
The focus of this article will be to discuss the major arteries that supply the brain.
More details about the development, course and their target regions of the individual vessels can be found in their respective articles.
| Development | 3rd - 7th gestational weeks |
| Anterior circulation | Internal carotid arteries Anterior cerebral arteries Anterior communicating arteries Middle cerebral arteries |
| Carotid artery | Branch of the common carotid artery Cincinnati classification and Newer 4 part classification Mnemonic (excludes C1): Please Let Children Consume Our Candy |
| Posterior circuit | Posterior cerebral arteries Posterior communicating arteries Vertebral arteries Basilar artery |
| Vertebral arteries | Branches: posterior inferior cerebellar artery (PICA), anterior and posterior spinal, meningeal and medullary arteries |
| Basilar arteries | Branches: Anterior inferior cerebellar, Superior cerebellar, Internal auditory (Labyrinthine). Becomes the posterior cerebral artery |
| Circle of Willis | Union of anterior and posterior circulation In the subarachnoid space, in the interpeduncular cistern Surrounds optic chiasm and infundibulum |
| Clinical Significance | Anterior circulation stroke Posterior circulation stroke |
bone implant
Bone implants have to withstand considerable stress. Therefore an essential test must show whether the metal does suffer a reduction of stability during the intended production of a prosthesis, or if it maintains its strength. Heating for the purpose of binding a bioactive layer must be kept under critical limits to preserve the internal structure of the metal. The laser-induced process of fixing the bioceramic powder binds these small particles very effectively. A very significant property of the ultrashort pulses must be emphasized here. Shorter laser pulses cause an ablation only in a very thin surface layer. There is hardly any heat transfer into deeper layers underneath the ablated volume. One sometimes talks about ‘cold’ ablation. The immediate surrounding does not suffer much heating.
It must be investigated if the marginal (heat) influence of the ceramic powder fixation to the metal has any negative effect on the mechanical stability. One established method for studying the material strength is the rotating bending fatigue test. This statistical method applied to specially prepared samples (hourglass rods) is already described elsewhere (Symietz, 2012). A brief outline of the experiment and the results is given here. The samples were rods of medical grade Ti6Al4V (Merete Medical GmbH, Berlin, Germany) as shown in Fig. 4.13. The so-called hourglass rods have a reduced diameter in the middle, where they will break under too much stress. A set of 20 samples was necessary to approach the critical mechanical stress in steps. The rods were fastened into a device that allowed turning them around their symmetry axis with a frequency of 73.7 Hz. For each run, lasting for more than one day, a constant four-point bending moment was adjusted. The thinner central section of each rod was exposed to alternating positive and negative stress, with the maximum absolute value on the surface of this middle part. This material wear caused by alternating compression and tension simulates an ageing process of the metal. A final number of 107 rotation cycles defines the desired survival lifetime of the samples. This is a step-by-step approach by adjusting a predetermined upper or lower stress level. The previous result (survival = unbroken rod, failure = broken rod) dictates the choice for the next experiment. Normally 20 rods are enough to find a stress value around which the individual test runs level off.