Project 1 - Data Cleaning and Transformation using Pivot table and Charts for the Report on requirement of Team Hiring
Summary of Products Sales in sheet b
Getting sales data with respect to status and product line in sheet c
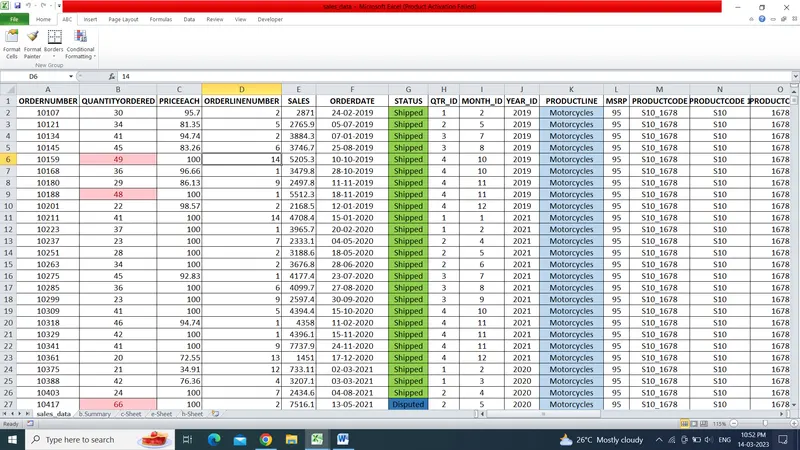
Making Customized ribbon by name ABC for formatting data
Quantity ordered by each Country in Year 2019,2020 and 2021 for different Quarters in sheet e
Presenting data in different colours for values Status and ProductLine using conditional formatting
Calculated the total sales of all “Shipped”, “Cancelled”, “Disputed”, “In Process”, “On Hold”, “Resolved” products in sheet h using pivot table
two new fields are added in data sheet name as Productcode1 and Productcode2 Separated text using left and right formula
Highlighted the top 10% values of QuantityOrdered field using Conditional Formatting