Project 1 - Data Cleaning and Transformation using Pivot table and Charts for the Report on requirement of Team Hiring
I have attached Excel Sheet named "Project_sales_data" . Kindly find the attachment.
Question a:Do proper formatting of the data with using borders, font size and appropriate alignment of the content.
Answer: Kindly find the formatted data in the attached excel in Worksheet named "Main Data".
Question b: Make summary of Products Sales by providing
- Total Sum of Sales
- Average of Sales
- Standard Deviation of Sales
- Variance of Sales
- Maximum Sales
- Minimum Sales
Answer: Kindly find answer in the attached excel in Worksheet named "Summary of Sales"
Question c: Analyse the sales happened by product line & status using pivot table
Answer: Kindly find answer in the attached excel in Worksheet named "Sales Analysis".
Question d: Make Customized Tab by naming ABC and keep few data formatting commands in the newly created Tab.
Answer: Kindly find below screenshots for reference.
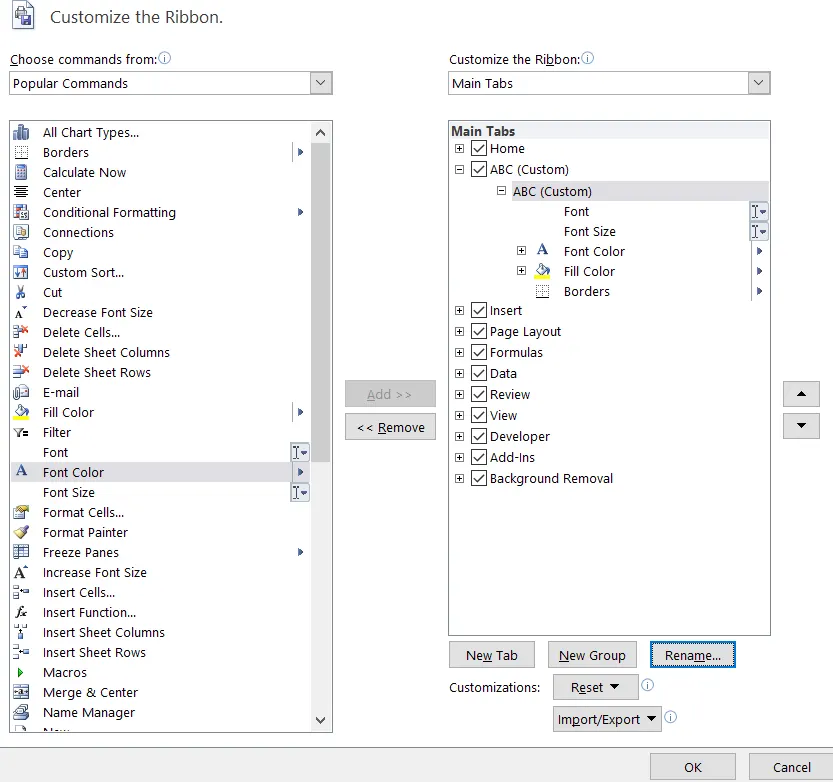
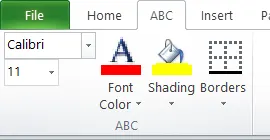
Question e:Analyse the Quantities ordered by each Country in Year 2019,2020 and 2021 for different Quarters using Pivot Table.
Answer: Kindly find answer in the attached excel in Worksheet named "Quantity Ordered".
Question f:Present the data in different colours for values in field Status and ProductLine using conditional formatting.
Answer: Kindly find the conditional formatted data in the attached excel in Worksheet named "Main Data".
Question g:change values of 2003 to 2019, 2004 to 2020 and 2005 to 2021 by using proper date formatting options.
Answer: Kindly find changed values in the attached excel in Worksheet named "Main Data"
Question h: Calculate the total sales of all “Shipped”, “Cancelled”, “Disputed”, “In Process”, “On Hold”, “Resolved” products. (Hint:Use pivot table or sumif function)
Answer: Kindly find answer in the attached excel in Worksheet named "Total Sales".
Question i: Split the productcode field into two using text functions Example :S10_1678 -> S10 in one column and 1678 in another column.
Answer: Kindly find the splitted code in the attached excel in the Worksheet named "Main Data" and the result is present in "Z"or"PRODUCTCODE_1" and "AA"or"PRODUCTCODE_2" columns
Question j: Highlight the top 10% values of QuantityOrdered field using Conditional Formatting
Answer: Kindly find the highlighed values in the attached excel in Worksheet named "Main Data"