Project 1 - COVID-19 Vaccinations Trend Analysis
Project 1 - COVID-19 Vaccinations Trend Analysis
Please find the attached files Detailed Documentations (attach a Word file and also paste in the text box) Power BI Report /.PBIX file Present the project like a Case Study using PowerPoint I have completed the project and attached all these files also, and copy-pasted the project report in the text box please check them…
Please find the attached files
Detailed Documentations (attach a Word file and also paste it in the text box)
Power BI Report /.PBIX file
Present the project like a Case Study using PowerPoint
I have completed the project and attached all these files also and copy-pasted the project report in the text box please check them thankyou!
Project Report on Covid-19 analysis
(Images are in a Word file)
By
P. Karthika Bharani
[email protected]
Table of contents
o Aim
o Introduction
o Problem statement
o Methodology
o Analysis (Data sheets about it)
o Insights
o Recommendations.
o Conclusions
Aim:
This project aims to analyze data in detail on vaccinated peoples on vaccinated on people based on country and year fully vaccinated people by country in 2021 -2022.
Introduction:
This project shows its total number of vaccinated people and also shows the source name, daily vaccinated people, and also shows website details. Through the data analysis of data. We can find data on the total vaccination details. The main objective of this data can find the total vaccination details. the main objective of this project is to analyze data on covid vaccination details.
Problem Statement:
The Covid-19 pandemic is the most crucial health disaster that has surrounded the world for the past year. predicting the covid-19 vaccination trend analysis has become a challenging issue.
- We can find out how many peoples are daily vaccinated.
- Total vaccinations by each year.
- See the number of people vaccinated per hundred.
- See how many peoples are fully vaccinated based on country.
- We can see the vaccinated people based on daily updates.
- See what are all the different vaccines are there.
Data Pre-Processing and Cleaning:
In this step first, we clean the data with the help of a power query editor. We clean the data in a particular manner, use the first row as a header, replace the duplicate values, and also arranging the data in a specific format. And also, some missing values. In this, we can clean data.
Data Interpretation:
After cleaning the data, we can add the data into power bi with the help of the close and load options in the Power query editor. In the data, interpretation found some important information. In this, data we can replace null values with 0.
Data Visualization:
In visualization, with the help of power bi desktop software make graphs and charts and also calculate the sum of all vaccinations based on different criteria. Criteria based on country or also iso code. And also see the data model.
DASHBOARD:
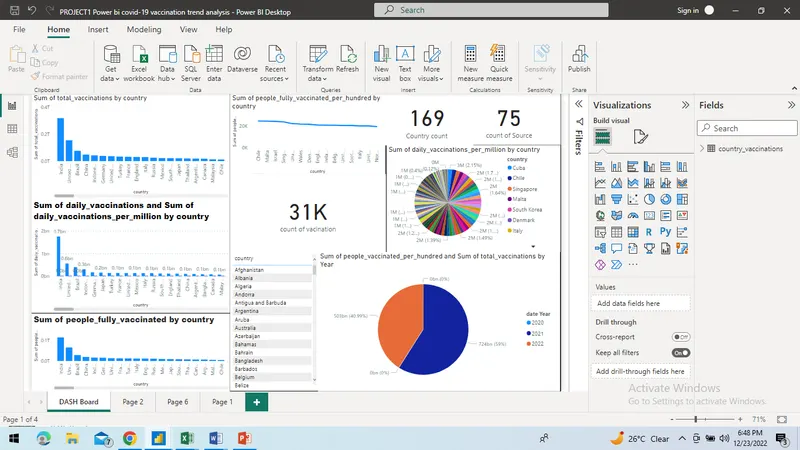
Analysis:
- From the above visualization find some points.
- The dataset is available for 2021 and 2022.
- The total of 223 countries are present in vaccination.
- In 2021 total of 60.79% vaccination was completed.
- In 2022 total of 39.2% vaccinated completed.
- Total of 81 source names are present in the given data.
- China, India, United States are the top countries that completed the vaccination.
- Top 10 countries where most people are vaccinated.
Insights:
- In conclusion, we can take a look at the final report for further analysis.
- Countriesfullully vaccination.
- See the top 10 sources.
Recommendations:
- We can perform operations with various categories.
- We can collect ct good dataset for analysis.
- To analyze the data for more effective and create the proper format of the chart.
- We can analyze the data of the overall world.
Conclusions:
In China and India in these two countries, most people are vaccinated. In this project, we can see how many peoples are vaccinated. And understands daily vaccination, fully vaccinated people's total vaccination per hour, and total vaccinations per million.