Project 1 - COVID-19 Vaccinations Trend Analysis
Aim: This projects aims to analyze the data in detail on vaccinated people and fully vaccinated people by country in starting 2020 till the year 2022.
Introduction: The Covid 19 pandamic casued by Corona Virus, believed to be originating from China, Caused several fatalities throughout the world. The entire world witnessed country wide lockdowns. The healthcare system throught the world witnessed a real test, with hospitals running in over occupancy and no vaccine at hand to treat the virus.
Starting 2021, vaccines became available after successful trial runs and government approvals. An effort was made several health organizations to bring a stop to this pandemic.
Problem statement: In this project we analyzed the following
1. Top fully vaccinated countries
2. Top countries with total vaccination
3. Vaccinations by year
4. Number of vaccines used, and their names
5. Average daily vaccinations by country
Methadology:
1. The first step is to format the data in the excel file provided. We need to make sure the data type and format is uniform in its respective column.
2. It is also necessary to clean the data. Functions like "text to columns" was also used to seperate data using delimiters.
3. The file was imported into power BI using the Get data option.
4. The data is transformed using options like append columns, merge columns. The relationship between two tables is also established
5. The report view of power Bi is the space where we can use different visualization tools to present the data in a interactive dashboard form. After transforming our data, we can make use of tools to visualize the dashboard.
Analysis:
This analysis covers vaccinations across 223 different countries worldwide.
First, we analyze two areas, and those will be Total vaccinations by each country and fully vaccinatated populations in those
After filtering out top 10 countries whose population is fully vaccinated, and top 20 countries with total vaccinations, we get the following results:
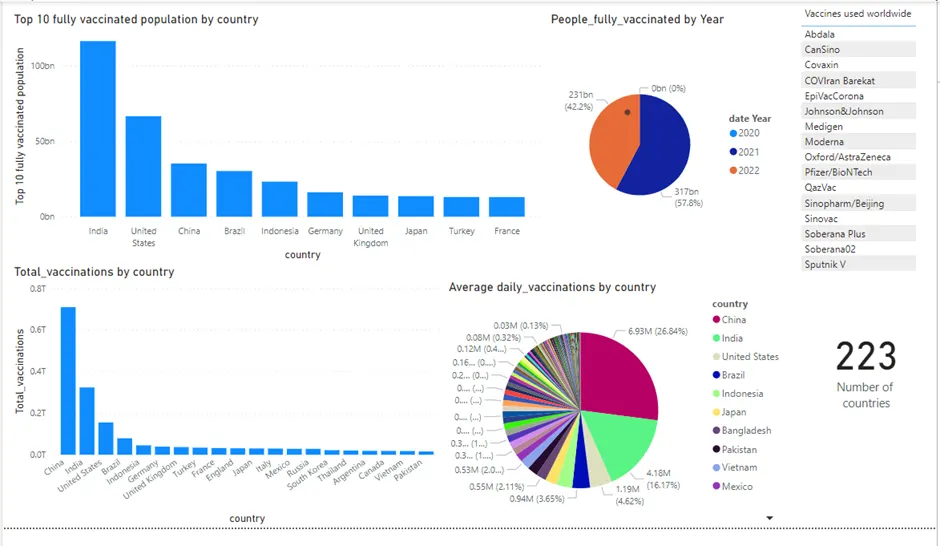
The dashboard also covers the analysis of average daily vaccinations from the year 2020 to 2022. China emerges as the country with most number of average daily vaccinations
It was observed that Johnson & Johnson was the vaccine used by the most number of countries worldwide, except in parts like Asia, Russia and Australia, as evident in the results below:
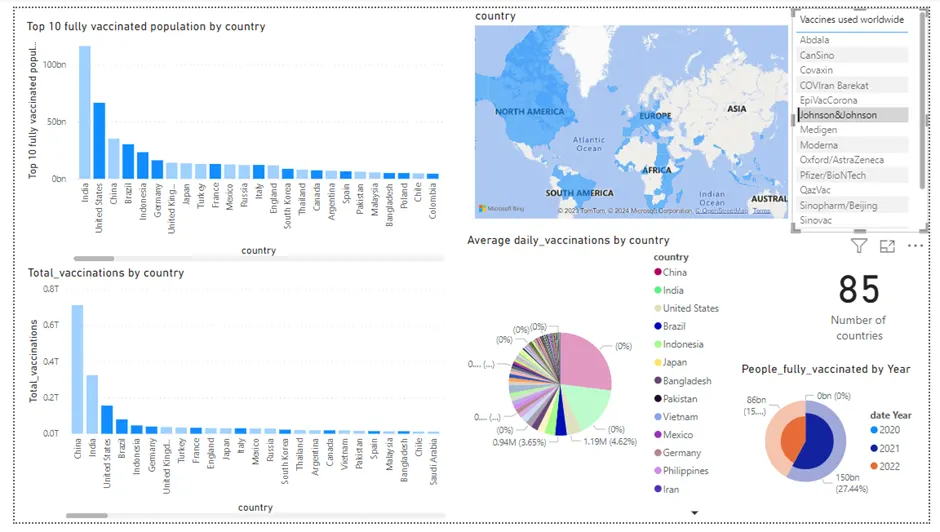
The dashboard also shows that most number of people were fully vaccinated in the year 2021.
Insights:
1. The data shows how quickly after the outbreak, the vaccinations were done at rapid pace, with most of the people being fully vaccinated in next year right after the pandemic year.
2. China was leading total vaccinations while India hs the most number of fully vaccinated population.
Recommendation:
1. The data about volume of vaccine dose can also be added to determine which was the most used vaccine.
Conclusion:
Through the provided data and analysis on the same, we came to know which countries used the most number of vaccination to control the outbreak within the time frame, and what kind of vaccines were used all over to fight the pandemic.