Project 1 - COVID-19 Vaccinations Trend Analysis
REPORT ON
COVID-19 VACCINATIONS TREND ANALYSIS
SUBMITTED BY: NANDHUMON T. K
AIM
The aim of the project is to analyse the trends and patterns related to COVID-19 vaccinations on a global scale by utilizing Power BI, a powerful business intelligence tool, to gather, clean, and transform vaccination data, and then create insightful visualizations and reports. By conducting a comprehensive analysis of vaccination data, the project seeks to gain insights into the progress, challenges, and impact of vaccination campaigns. This information can be used to inform public health strategies, identify areas for improvement, and contribute to ongoing efforts to combat the COVID-19 pandemic.
INTRODUCTION
The COVID-19 pandemic has had a profound impact on societies worldwide, leading to significant disruptions in daily life and posing a major threat to public health. Vaccinations against the virus have emerged as a crucial tool in controlling its spread and mitigating the associated risks. Monitoring and analysing the trends and patterns related to COVID-19 vaccinations are essential for understanding the progress, challenges, and impact of vaccination campaigns.
By harnessing the capabilities of Power BI, we can transform raw vaccination data into actionable information, facilitating evidence-based decision-making and informed policy recommendations. The project aims to provide a comprehensive understanding of COVID-19 vaccination trends, including vaccination rates, coverage, temporal patterns, geographical variations, and demographic disparities.
Through a comprehensive analysis and visualization of COVID-19 vaccination data, this project seeks to be a valuable resource for understanding the progress, challenges, and opportunities related to COVID-19 vaccinations, with the ultimate goal of saving lives and restoring societal well-being.
PROBLEM STATEMENT
The COVID-19 pandemic has created an urgent need for a comprehensive analysis of vaccination trends to aid in the effective management of the vaccination campaigns. However, there is a lack of readily accessible and user-friendly tools to analyse and visualize COVID-19 vaccination data. This poses a significant challenge for policymakers, public health agencies, and researchers who require actionable insights to monitor the progress, identify bottlenecks, and make informed decisions regarding vaccination strategies.
To address this problem, the project aims to leverage Power BI, a powerful data visualization and analysis tool, to develop an interactive and intuitive platform for COVID-19 Vaccinations Trend Analysis. This platform will provide a centralized hub for collecting, analysing, and visualizing vaccination data, allowing stakeholders to gain valuable insights into the vaccination campaign's progress and impact.
We need to find the answers for
- What are the 10 countries in terms of total vaccinations?
- What are the 10 countries with lowest total vaccinations rates?
- What are the most commonly used vaccines across countries?
- What are the top 10 countries in terms of daily vaccinations?
METHODOLOGY
- Data Cleaning:
- Collect the data from the source and transform it using the power query in power BI.
- Clean the data by removing any null values – replaced it with zero, inconsistent formatting such as column names.
- Perform data transformations and aggregations as needed to prepare the data for analysis.
- Created a table namely Date using DAX, CALENDAR from date of the “Country vaccinations” Table
- Data Interpretation:
- In the “Country Vaccinations” Table consists of country wise vaccination data, which include the fully vaccinated list of people yearly, monthly and daily basis.
- Which contain certain rows with null values.
- Visualisations:
- Create Visualisations like bar chart, Line chart etc based on the data
- Dashboard Creation:
- Arrange the visualizations in a logical and intuitive manner, ensuring easy navigation and understanding.
ANALYSIS
Created the following visualisation for better analysis of the Covid Vaccine Trend.
- Line Chart for the People Vaccinated by Date
- Clustered Bar Chart for the Top 10 Countries with fully vaccinated
- Stacked Column Chart for Top 10 Countries with Daily Vaccinations
- Map View for the Total Vaccinations
- Donut Chart for vaccine used country wise
- Clustered Bar Chart for the Bottom 10 Countries with fully vaccinated
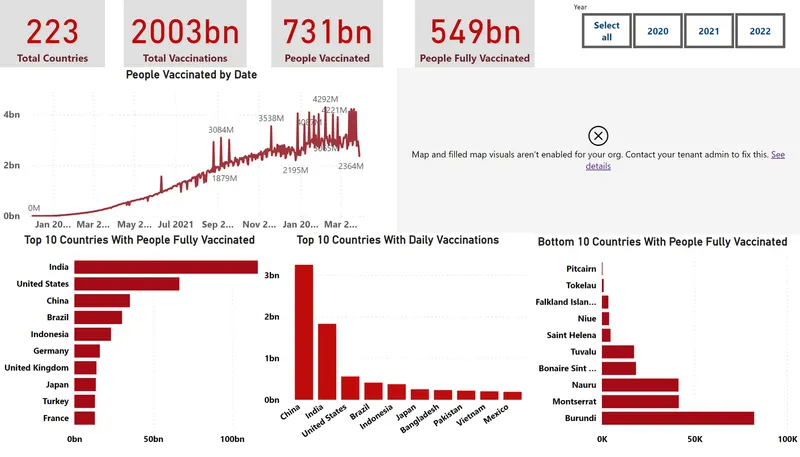
The list comprises 223 countries, with a cumulative total of 2,003 billion vaccinations administered. Among these vaccinations, 731 billion correspond to the number of individuals who received at least one dose, while 549 billion individuals have been fully vaccinated.
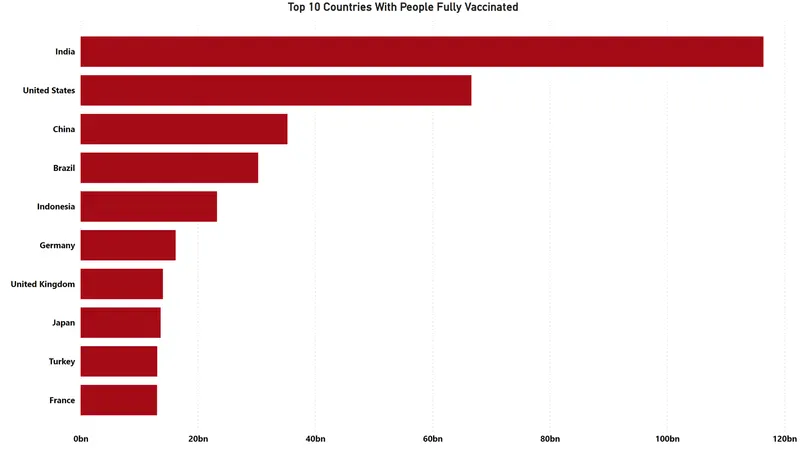
Based on the bar chart analysis, the data reveals the ranking of countries based on their fully vaccinated population. India emerges as the leading country with the highest number of fully vaccinated individuals. The United States follows in the second position, while China secures the third position.
The bar chart visually demonstrates the comparative performance of these countries in terms of achieving full vaccination coverage. India's significant progress in administering vaccinations is evident, positioning it as the frontrunner. The United States also exhibits commendable efforts in vaccinating its population, securing a strong second position. Meanwhile, China's vaccination campaign places it in the top three countries for fully vaccinated individuals.
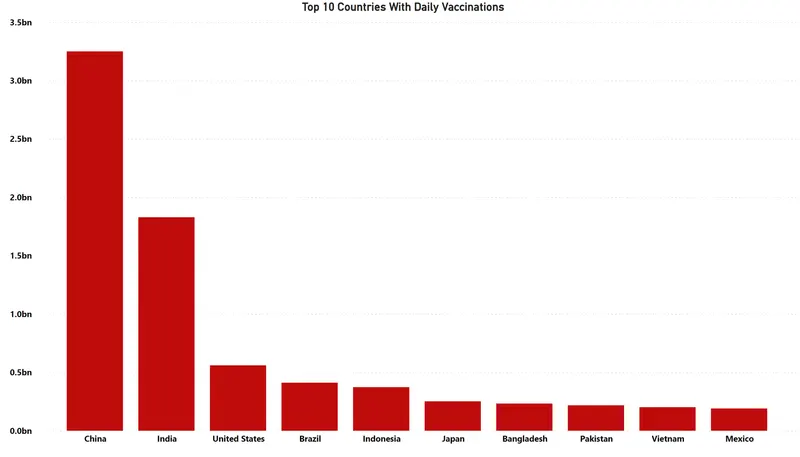
The analysis of daily vaccinations reveals that China currently dominates the first position, followed by India in second place, and the USA in third place. This information is derived from the data presented in the bar chart, which visually represents the daily vaccination numbers for these countries.
China's consistent high daily vaccination rate has contributed to its leading position. India, while in second place, has also made notable progress in its vaccination efforts. The USA, currently in third place, has also demonstrated commendable progress in its vaccination campaign.
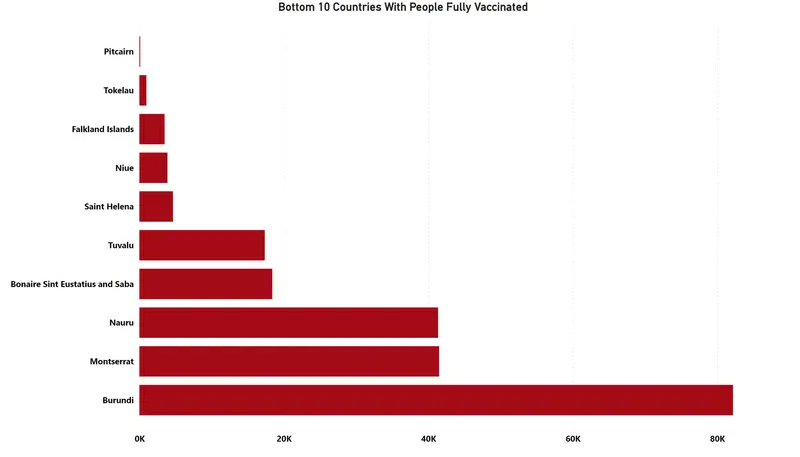
The bar chart illustrates the ranking of countries based on their fully vaccinated population. In this ranking, Pitcairn is positioned at the bottom, followed by Tokelau in second-to-last place, and Falkland Islands in third-to-last place.
The data presented indicates that Pitcairn has the lowest percentage of its population fully vaccinated among the countries analysed. Tokelau and Falkland Islands follow closely behind in terms of lower vaccination rates.
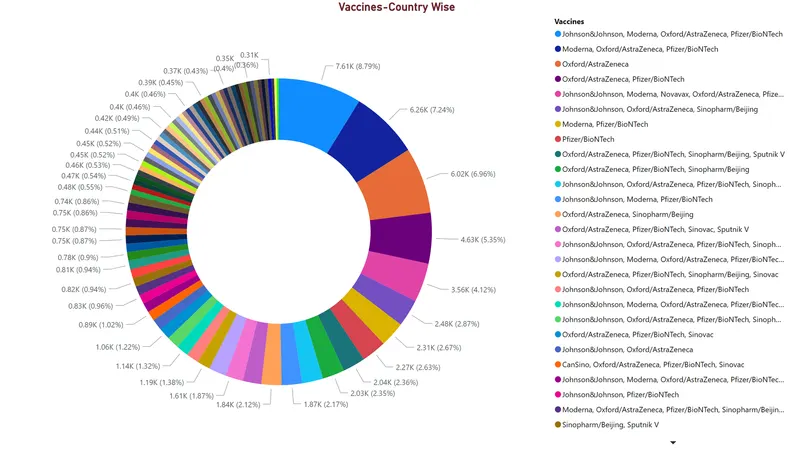
The above donut chart gives the idea about vaccine that used in the countries. Johnson & Johnson, Moderna, Oxford/AstraZeneca and Pfizer/BioNTech are the list of vaccine used mostly.
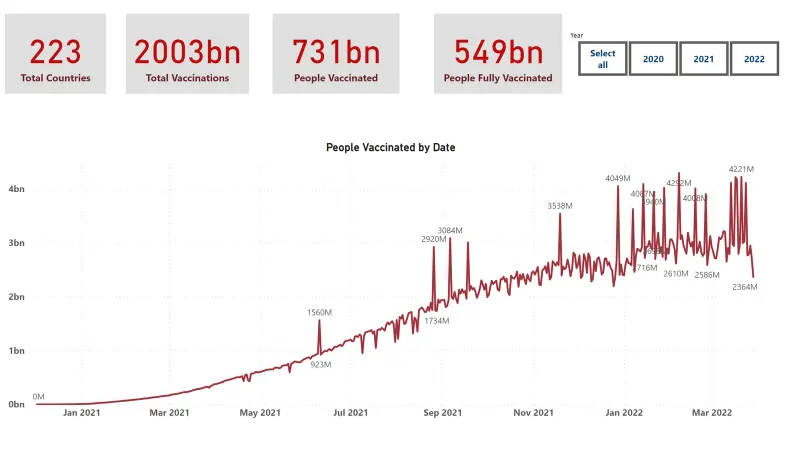
The above line graph shows the people got vaccinated on the daily basis. In February 2022 got the highest rate of vaccination.
INSIGHTS
- Country Rankings for Fully Vaccinated Population:
Based on the bar chart analysis, India emerges as the leading country with the highest number of fully vaccinated individuals. The United States follows in the second position, while China secures the third position. These rankings indicate the relative success of these countries in achieving full vaccination coverage.
- Comparative Performance of Countries:
The bar chart visually demonstrates the comparative performance of countries in terms of fully vaccinated population. India's significant progress in administering vaccinations is evident, positioning it as the frontrunner. The United States also exhibits commendable efforts in vaccinating its population, securing a strong second position. China's vaccination campaign places it among the top three countries for fully vaccinated individuals.
- Daily Vaccination Rankings:
The analysis of daily vaccinations reveals that China currently dominates the first position, followed by India in second place, and the USA in third place. These rankings are derived from the data presented in the bar chart, which visually represents the daily vaccination numbers for these countries. China's consistent high daily vaccination rate has contributed to its leading position, while India and the USA have also made notable progress in their vaccination efforts.
- Bottom-ranking Countries for Fully Vaccinated Population:
The bar chart indicates the ranking of countries based on their fully vaccinated population. Pitcairn is positioned at the bottom, followed by Tokelau in second-to-last place, and Falkland Islands in third-to-last place. These countries have the lowest percentage of their population fully vaccinated among the countries analysed, indicating lower vaccination rates.
- Most Commonly Used Vaccines:
The donut chart provides an overview of the vaccines used in the countries. Johnson & Johnson, Moderna, Oxford/AstraZeneca, and Pfizer/BioNTech are the vaccines most commonly used. This information gives an idea of the vaccine preferences and usage patterns among the analysed countries.
- Vaccination Rate Trends:
The line graph shows the number of people vaccinated on a daily basis. The highest rate of vaccination occurred in February 2022, indicating a peak in vaccination efforts during that period. This information helps identify the time frame when vaccination campaigns were most intensive.
RECOMMENDATIONS
- Further investigate the reasons behind India's success:
Explore the factors contributing to India's leading position in terms of fully vaccinated individuals. Analyze their vaccination strategies, distribution network, and public awareness campaigns to identify best practices that can be implemented in other countries.
- Study the vaccination efforts of the United States:
Examine the successful vaccination campaign of the United States, which secured the second position in terms of fully vaccinated individuals. Understand their vaccination rollout plan, public-private partnerships, and communication strategies to identify key learnings applicable in other regions.
- Assess China's daily vaccination dominance:
Investigate China's consistent top position in daily vaccinations. Understand their vaccination infrastructure, distribution efficiency, and any unique approaches that have contributed to their success. Analyze the feasibility of implementing similar strategies in other countries.
- Focus on countries with low vaccination rates:
Pay attention to countries at the bottom of the ranking in terms of fully vaccinated population, such as Pitcairn, Tokelau, and Falkland Islands. Identify the challenges they face, including supply constraints, hesitancy issues, or logistical difficulties, and provide targeted support and resources to help increase vaccination rates in these regions.
- Explore vaccine distribution patterns:
Analyze the donut chart showcasing the distribution of vaccine types used in different countries. Investigate the reasons behind the dominance of vaccines from Johnson & Johnson, Moderna, Oxford/AstraZeneca, and Pfizer/BioNTech. Assess the availability, effectiveness, and accessibility of these vaccines to determine their impact on vaccination trends.
- Investigate the spike in February 2022:
Analyze the line graph depicting the daily vaccinations and explore the reasons behind the peak in February 2022. Examine any specific events, campaigns, or policy changes during that period that may have influenced the surge in vaccination rates. Identify successful strategies employed during that time and assess their potential for replication in future vaccination drives.
- Monitor and update the analysis regularly:
Keep the analysis up-to-date by collecting the latest data on vaccination rates, new vaccines, and any significant developments in different countries. Continuously refine the analysis methodology to capture relevant insights and ensure the findings remain accurate and relevant.
CONCLUSION
- Vaccination Coverage: The analysis reveals that a total of 2,003 billion vaccinations have been administered across 223 countries. Out of these, 731 billion individuals have received at least one dose, while 549 billion individuals have been fully vaccinated.
- Leading Countries: India emerges as the leading country in terms of fully vaccinated individuals, followed by the United States and China. India's significant progress in administering vaccinations is notable, with the United States also demonstrating commendable efforts.
- Daily Vaccinations: China currently holds the first position in terms of daily vaccination numbers, followed by India and the United States. The bar chart visually represents this data, highlighting China's consistent high daily vaccination rate.
- Lowest Vaccination Rates: Pitcairn ranks at the bottom in terms of the percentage of its population that is fully vaccinated. Tokelau and Falkland Islands also exhibit lower vaccination rates compared to other countries.
- Commonly Used Vaccines: The donut chart provides an overview of the vaccines predominantly used in the analysed countries, including Johnson & Johnson, Moderna, Oxford/AstraZeneca, and Pfizer/BioNTech.
- Vaccination Rate by Time: The line graph indicates the daily vaccinations over time. In February 2022, the highest rate of vaccination was recorded, demonstrating a peak in the vaccination efforts during that period.