Project 1 - COVID-19 Vaccinations Trend Analysis
COVID-19 Vaccinations Trend Analysis
Analysis & visualization
AIM:
• COVID-19 Vaccinations Trend Analysis
• To analyze and interpret data related to the COVID-19 vaccination efforts globally or in a particular region. The analysis aims to uncover trends, patterns, and insights in the data that could be useful to various stakeholders such as health organizations, policymakers, and the general public.
INTRODUCTION
• The purpose of this presentation is to provide an analysis of the COVID-19 vaccination efforts globally or in a particular region. Will be examining the data related to vaccination rates, vaccines, vaccine distribution, demographics of those vaccinated, and any other relevant variables. By doing so, aim to identify trends, patterns, and insights that could be useful to various stakeholders such as health organizations, policymakers, and the general public.
•
• Analysing and visualizing the latest situation of “Covid19 Vaccination” around the world. We will use POWER BI for data visualization & for data analysis.
PROBLEM STATEMENTS:
• Analysis preparation
• What vaccines are used in each country?
• Which vaccines used most?
• How many are vaccinated?
• How the vaccination progressed
METHODOLOGY:
• The methodology for a COVID-19 vaccinations trend analysis using Power BI involves collecting and cleaning data from reliable sources, creating a data model, visualizing the data using interactive charts and graphs.
• performing statistical analysis using the DAX language, interpreting the results, and creating a report summarizing the findings.
• Power BI can help streamline the analysis process, improve the quality of analysis, and make it easier to communicate findings to stakeholders.
Columns in dataset:
• Country
• ISO Code
• Date
• Total number of vaccinations
• People vaccinated.
• People fully vaccinated.
• Daily vaccinations (raw)
• Daily vaccinations
• Total vaccinations per hundred
• People vaccinated per hundred.
• People fully vaccinated per hundred.
• Number of vaccinations per day
• Daily vaccinations per million
• Vaccines used in the country.
TOTAL VACCINATIONS BY COUNTRY:
China accounted for 35.42% of Sum of total vaccinations.
Across all 223 countries,
The sum of total vaccinations ranged from 348 to 709452663700.
Total vaccinations by country:
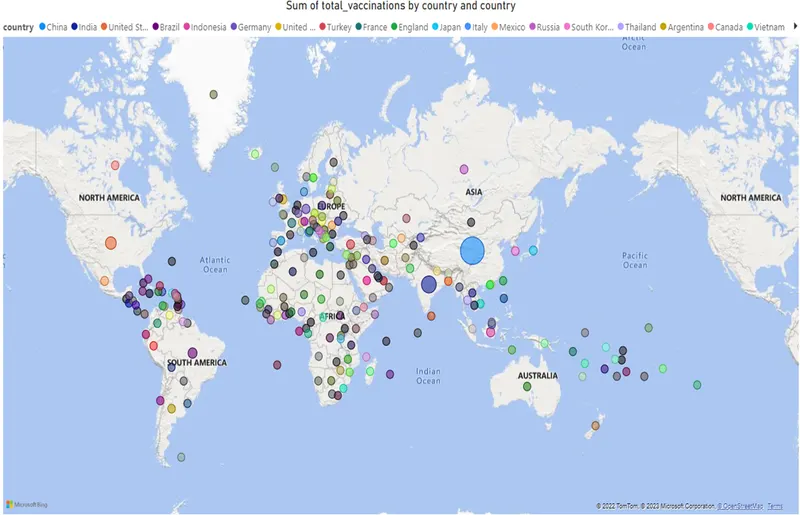
China accounted for 35.42% of Sum of total_vaccinations.
Across all 223 country,
Sum of total_vaccinations ranged from 348 to 709452663700.
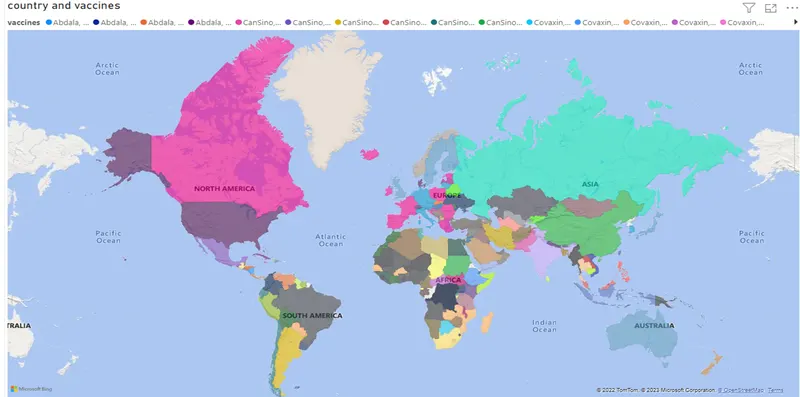
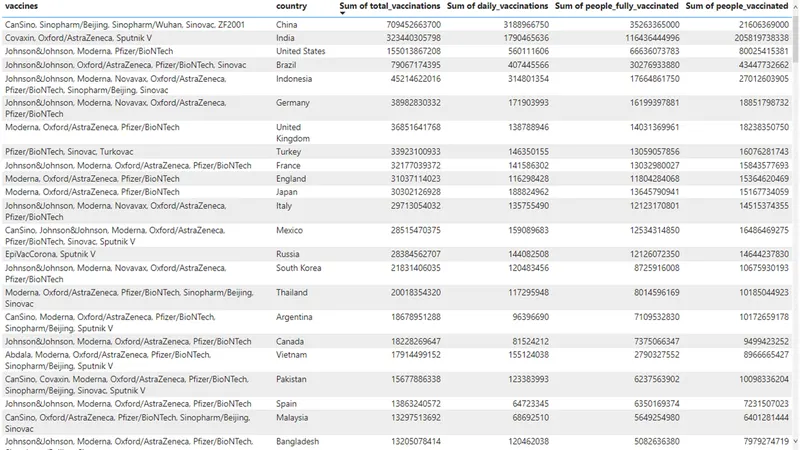
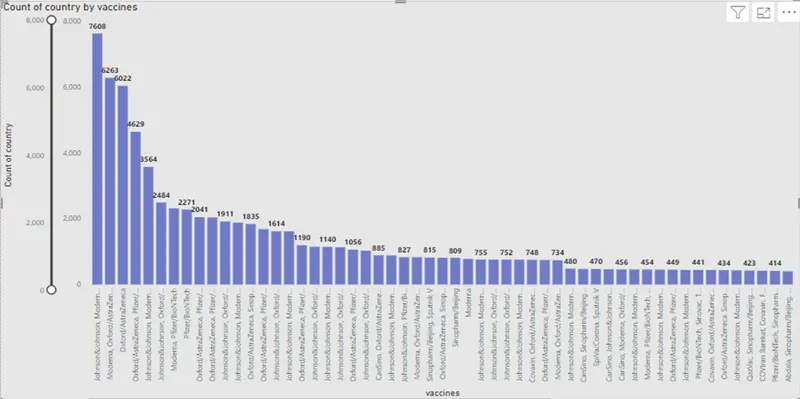
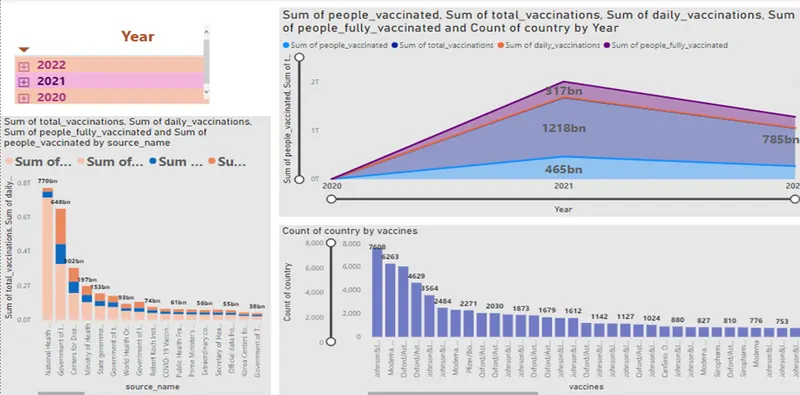
- Johnson&Johnson, Moderna, Oxford/AstraZeneca, Pfizer/Bio NTech had the highest Count of country at 7608, followed by Moderna, Oxford/AstraZeneca, Pfizer/Bio NTech and Johnson&Johnson, Moderna, Novavax, Oxford/AstraZeneca, Pfizer/Bio NTech. EpiVacCorona, Oxford/AstraZeneca, QazVac, Sinopharm/Beijing, Sputnik V, ZF2001 had the lowest Count of country at 3.
- Across all 84 vaccines, Count of country ranged from 3 to 6,349
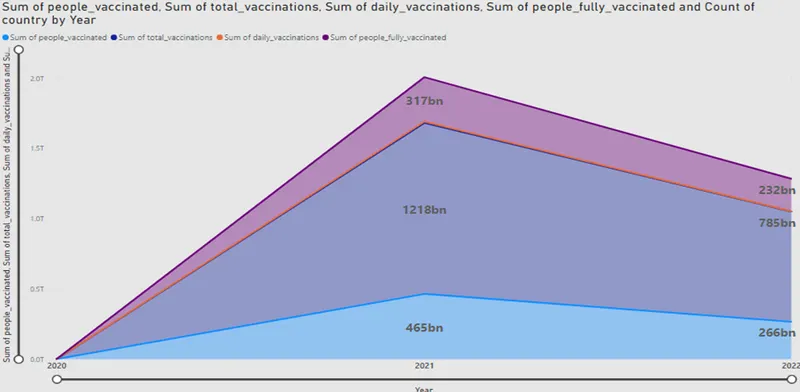
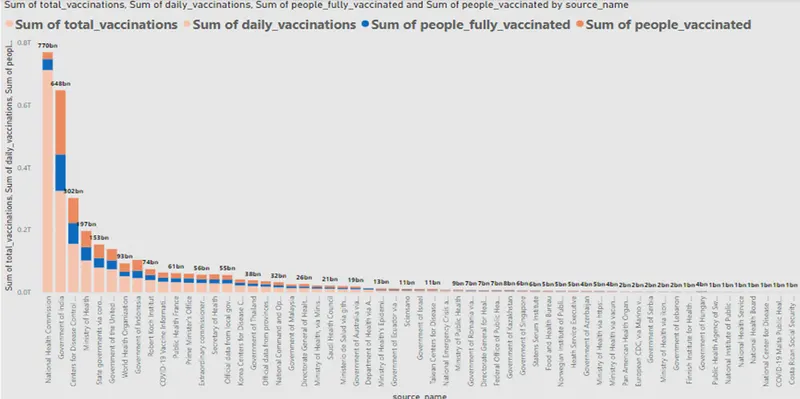
Across all 81 source_name, Sum of total_vaccinations ranged from 14163 to 709452663700, Sum of people_fully_vaccinated ranged from 3492 to 116436444996, and Sum of daily_vaccinations ranged from 424 to 3188966750.
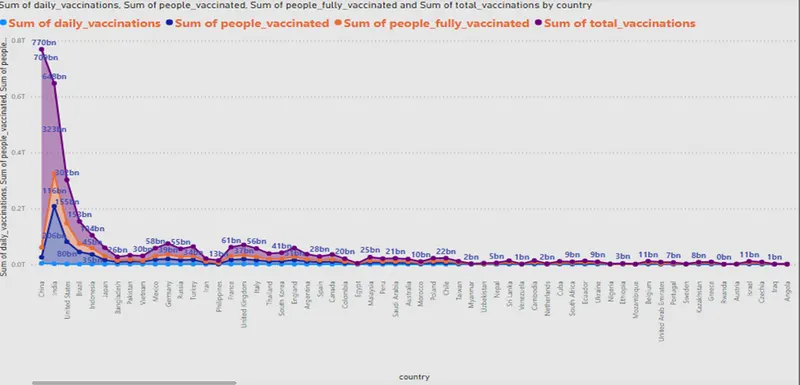
Across all 223 country, Sum of total_vaccinations ranged from 348 to 709452663700, Sum of people_fully_vaccinated ranged from 113 to 116436444996, and Sum of daily_vaccinations ranged from 2 to 3188966750
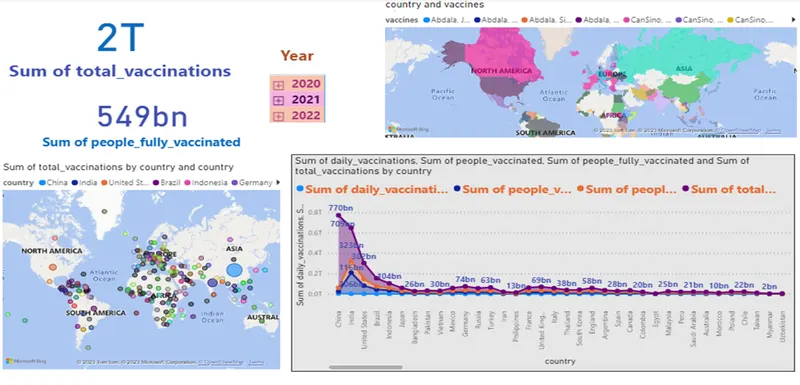
DASHBOARD 1 AND 2:
INSIGHTS:
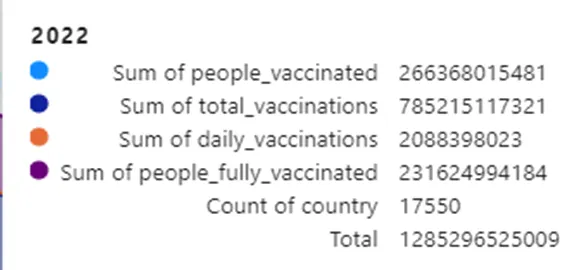
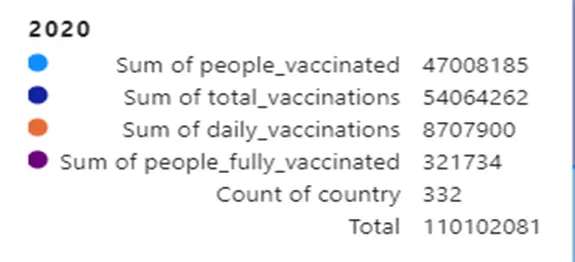
• Total Vaccinations: The total number of COVID-19 vaccine doses administered in a specific region or country are 54 million to 7.8 billion from the year 2020 to 2022.
• People Fully Vaccinated: The number of individuals who have received the complete course of a COVID-19 vaccine, which may require one or more doses depending on the vaccine are 321734 to 2.3 billion from the year 2020 to 2022.
• Daily Vaccinations: The average number of COVID-19 vaccine doses administered each day in a specific region or country are from 8.7 million in 2020 to 2.1 billion in 2022.
• People Vaccinated: The number of individuals who have received at least one dose of a COVID-19 vaccine but may not have completed the full course of the vaccine 47 million in 2020 to 266 million in 2022.
• Increasing Vaccination Rates: The total number of COVID-19 vaccine doses administered has increased significantly from 54 million in 2020 to 7.8 billion in 2022. This indicates a significant increase in vaccination efforts globally.
CONCLUSION:
• China, India, United States has highest rate of vaccinations according to the data.
• Johnson&Johnson, Moderna, Oxford/AstraZeneca, Pfizer/Bio NTech had the highest Count of country at 6,349, followed by Moderna, Oxford/AstraZeneca, Pfizer/Bio NTech and Johnson&Johnson, Moderna, Novavax.
• According to the data the Vaccinations increased from 2020 to 2021 and decreased from 2021 to 2022 by this we can assume that the COVID-19 cases are reduced.
• It can be concluded that the global vaccination effort against COVID-19 has been significant and increasing over the years. The total number of vaccine doses administered, the number of individuals who have received the complete course of the vaccine, the average daily vaccinations, and the number of individuals who have received at least one dose have all significantly increased from 2020 to 2022.