Project 1_Comparative study of different storey buildings for Seismic forces
Comparision 1
Aim: To compare the effect of stiffness on natural period of buildings E & F and G & H using ETABS
Building E:
1. Opening New model
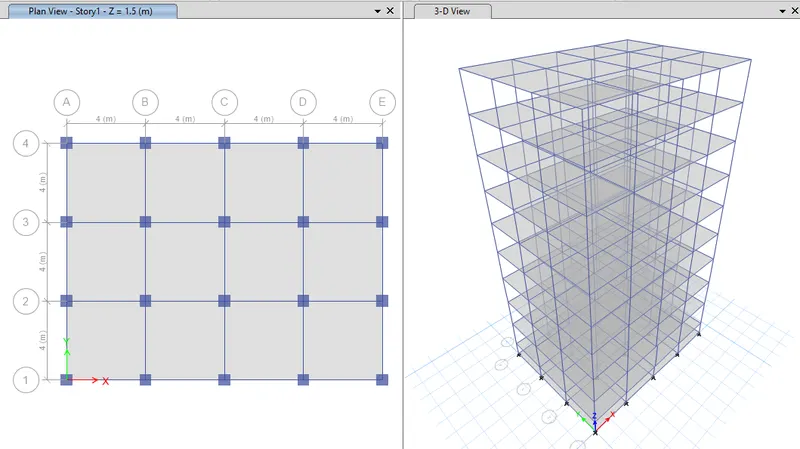
2. Setting the Building E & F storey as 10 and number of bays in X direction as 4 and in Y direction as 3
3. Defining the section property of column as 400X400mm for upper 5 storeys,Bottom 5 storeys as 600X600mm
4. And also defining the other section properties of Beam and slab
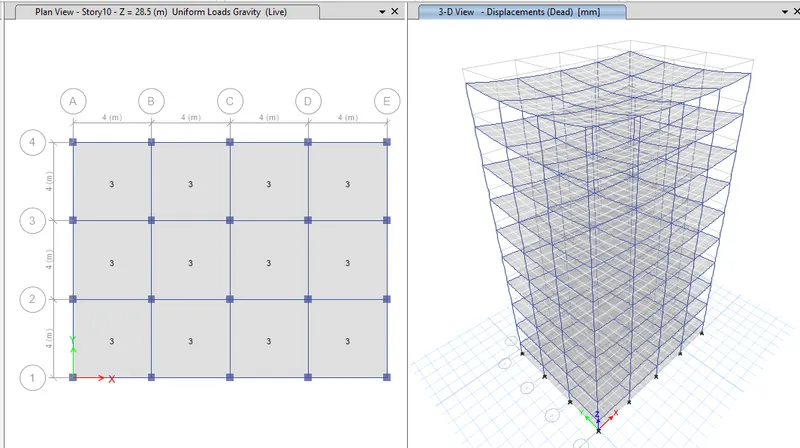
5. Assigning the Live load as 3kN/m2 .
6..Run the analysis
7. In Display tab selecting the show table option
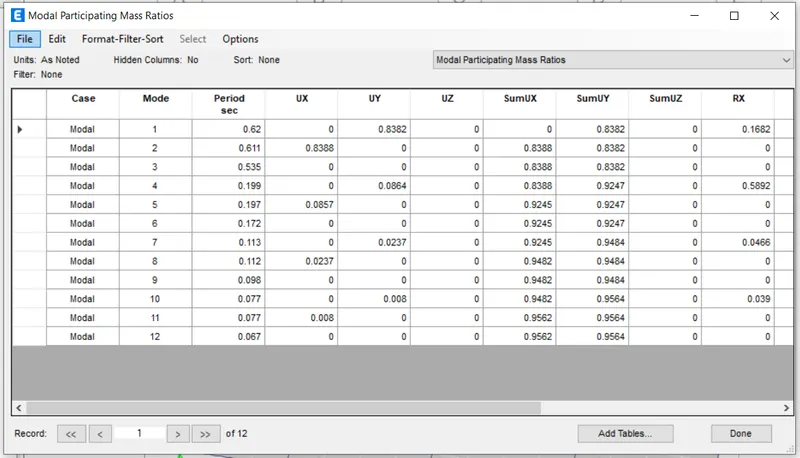
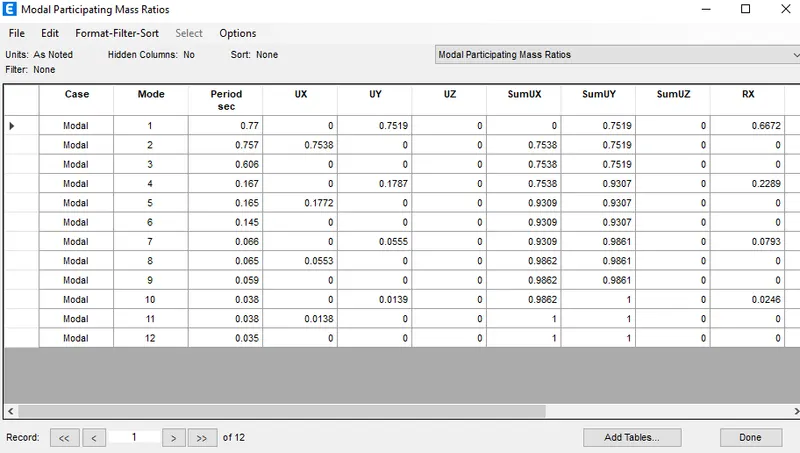
8. Checking in the modal participating ratio
Building F:
1. Opening New model
2. Setting the Building E & F storey as 10 and number of bays in X direction as 4 and in Y direction as 3
3. Defining the section property of column as 600X600mm
4. And also defining the other section properties of Beam and slab
5. Assigning the Live load as 3kN/m2 .
6..Run the analysis
7. In Display tab selecting the show table option
8. Checking in the modal participating ratio
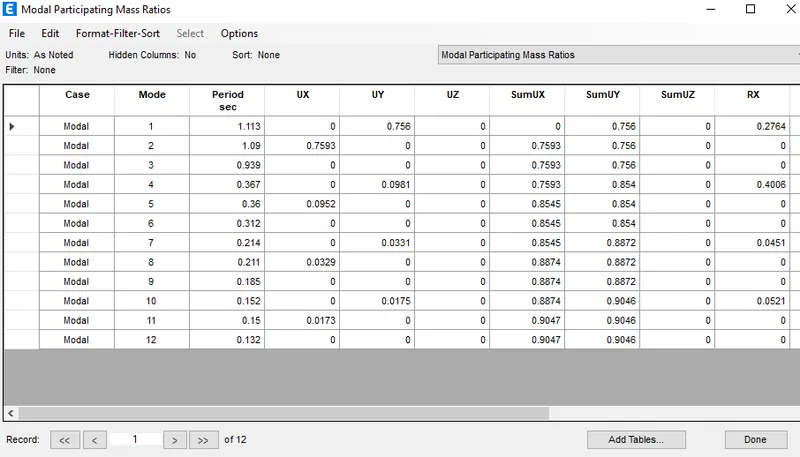
Building G:
1. Opening New model
2. Setting the Building E & F storey as 10 and number of bays in X direction as 4 and in Y direction as 3
3. Defining the section property of column as 400X400mm for upper 5 storeys,Middle 10 storeys as 600X600mm and Bottom 10 storey as 800X800mm
4. And also defining the other section properties of Beam and slab
5. Assigning the Live load as 3kN/m2 .
6..Run the analysis
7. In Display tab selecting the show table option
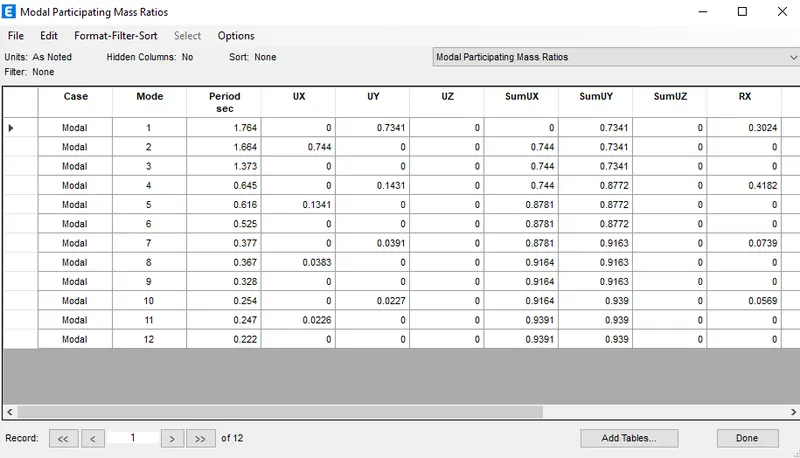
8. Checking in the modal participating ratio
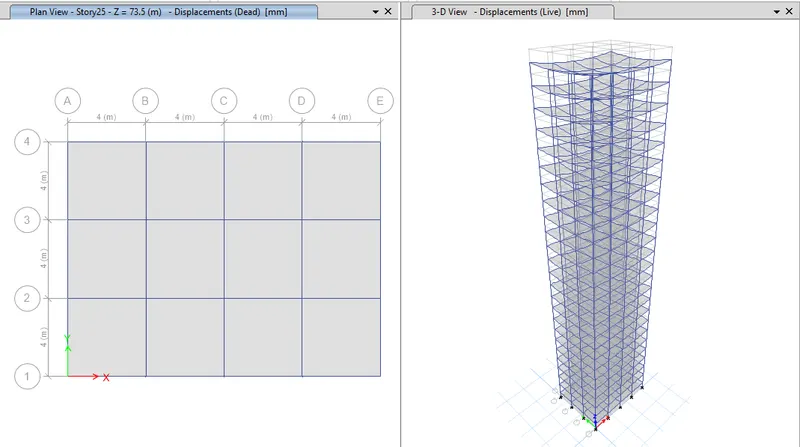
Building H:
1. Opening New model
2. Setting the Building E & F storey as 10 and number of bays in X direction as 4 and in Y direction as 3
3. Defining the section property of column as 600X600mm
4. And also defining the other section properties of Beam and slab
5. Assigning the Live load as 3kN/m2 .
6..Run the analysis
7. In Display tab selecting the show table option
8. Checking in the modal participating ratio
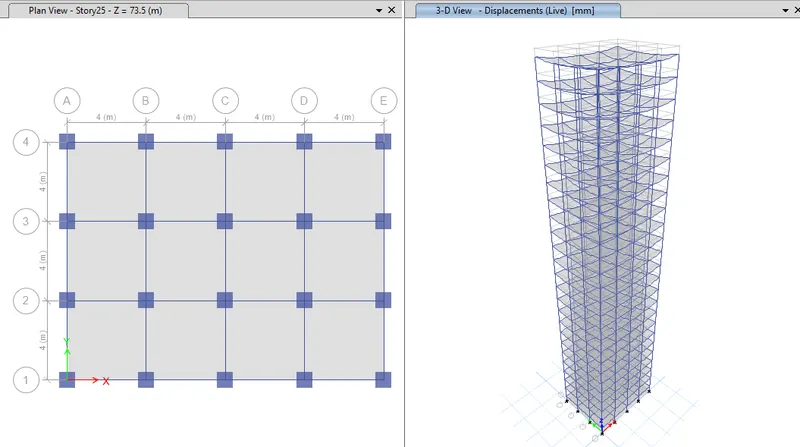
Conclusion:
Time period of E=0.77
Time period of F=1.113
Time period of G=1.764
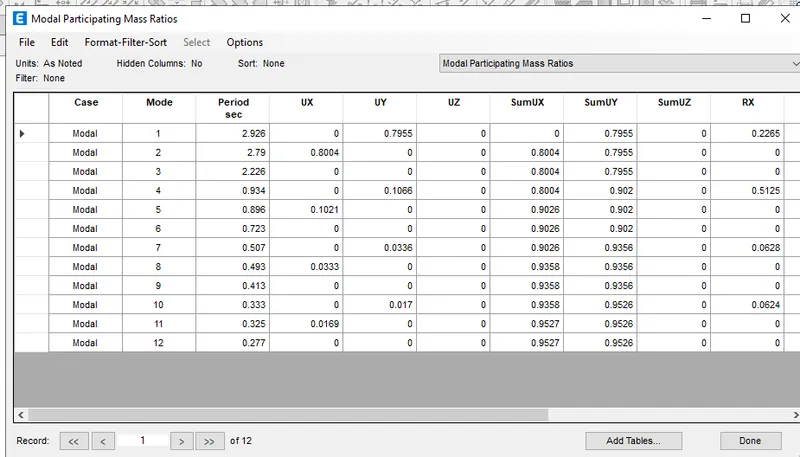
Time period of H= 2.926
As the Height and the sectional dimensions of the column and building changes the Time period also varies
Comparision 2
Aim: To compare the effect of mass on natural period of buildings H,J and K using ETABS
Building H:
1. Opening New model
2. Setting the Building H storey as 25 and number of bays in X direction as 4 and in Y direction as 3
3. Defining the section property of column as 800X800mm
4. And also defining the other section properties of Beam and slab
5. Assigning the Live load as 3kN/m2 .
6..Run the analysis
7. In Display tab selecting the show table option
8. Checking in the modal participating ratio
Building J:
1. Opening New model
2. Setting the Building J storey as 25 and number of bays in X direction as 4 and in Y direction as 3
3. Defining the section property of column as 800X800mm
4. And also defining the other section properties of Beam and slab
5. Assigning the Live load as 3.3kN/m2 .
6..Run the analysis
7. In Display tab selecting the show table option
8. Checking in the modal participating ratio
Building K:
1. Opening New model
2. Setting the Building J storey as 25 and number of bays in X direction as 4 and in Y direction as 3
3. Defining the section property of column as 800X800mm
4. And also defining the other section properties of Beam and slab
5. Assigning the Live load as 3.6kN/m2 .
6..Run the analysis
7. In Display tab selecting the show table option
8. Checking in the modal participating ratio
Conclusion:
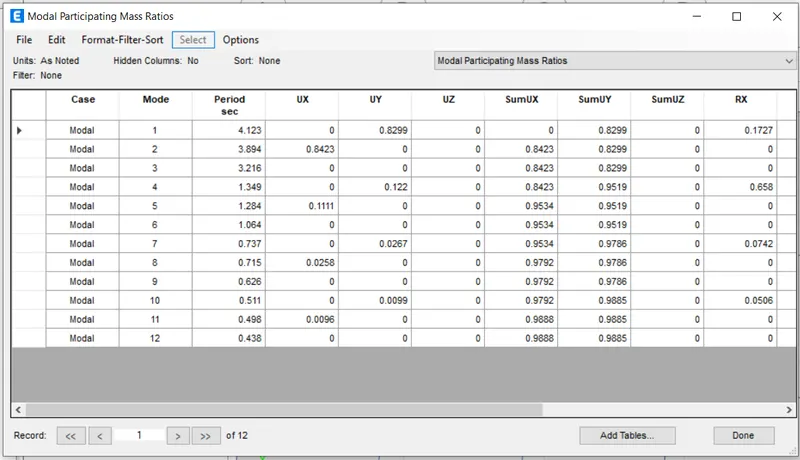
Time period of H=2.962
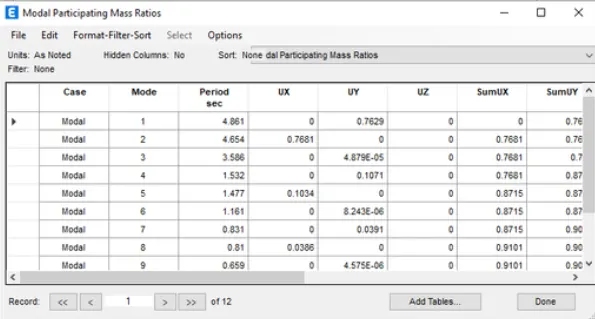
Time period of J=4.861
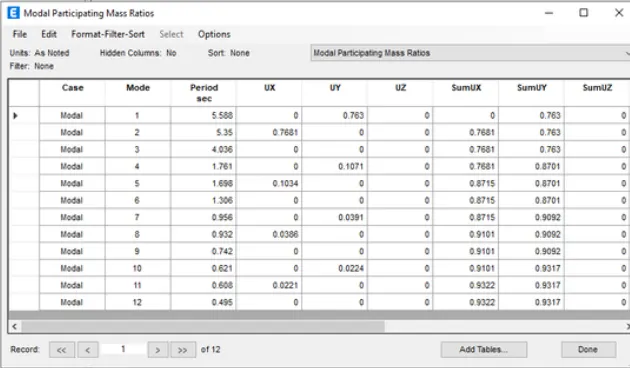
Time period of K=5.588
As the mass of the building is gradually increased that is the like load is incremented 10% and 20% the natural period also increases
Comparision 3
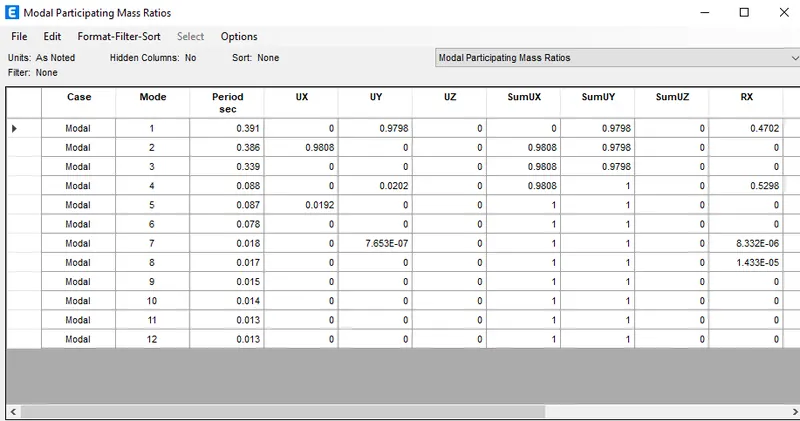
Aim: To compare the effect of Height on natural period of buildings A , B, F & H using ETABS
Building A:
1. Opening New model
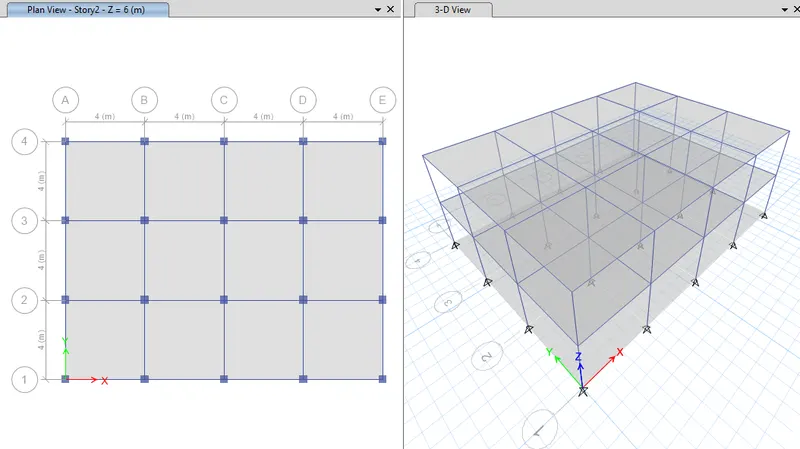
2. Setting the Building A storey as 2 and number of bays in X direction as 4 and in Y direction as 3
3. Defining the section property of column as 400X400mm
4. And also defining the other section properties of Beam and slab
5. Assigning the Live load as 3kN/m2 .
6..Run the analysis
7. In Display tab selecting the show table option
8. Checking in the modal participating ratio
Building B:
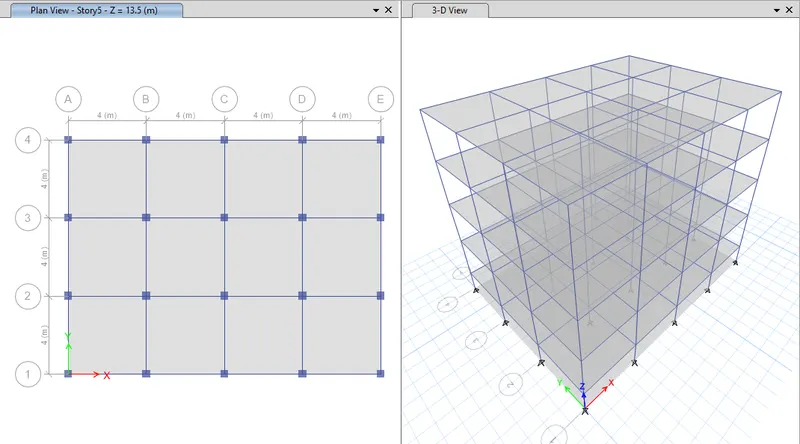
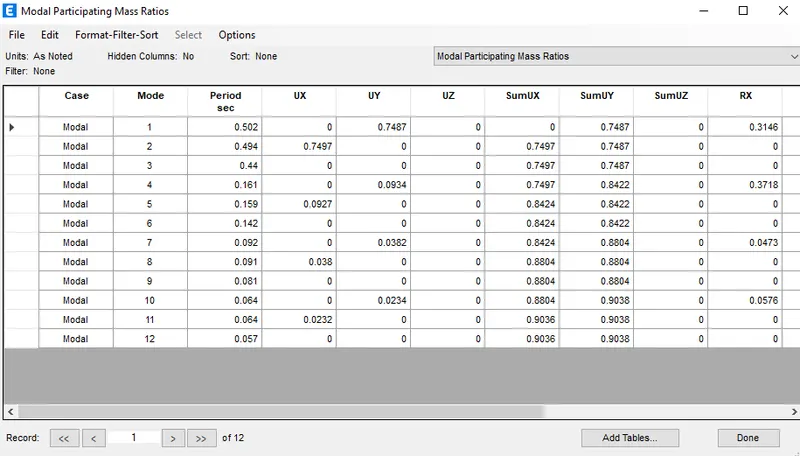
1. Opening New model
2. Setting the Building B storey as 5 and number of bays in X direction as 4 and in Y direction as 3
3. Defining the section property of column as 400X400mm
4. And also defining the other section properties of Beam and slab
5. Assigning the Live load as 3kN/m2 .
6..Run the analysis
7. In Display tab selecting the show table option
8. Checking in the modal participating ratio
Building F:
1. Opening New model
2. Setting the Building E & F storey as 10 and number of bays in X direction as 4 and in Y direction as 3
3. Defining the section property of column as 600X600mm
4. And also defining the other section properties of Beam and slab
5. Assigning the Live load as 3kN/m2 .
6..Run the analysis
7. In Display tab selecting the show table option
8. Checking in the modal participating ratio
Building H:
1. Opening New model
2. Setting the Building H storey as 25 and number of bays in X direction as 4 and in Y direction as 3
3. Defining the section property of column as 800X800mm
4. And also defining the other section properties of Beam and slab
5. Assigning the Live load as 3kN/m2 .
6..Run the analysis
7. In Display tab selecting the show table option
8. Checking in the modal participating ratio
Conclusion:
Time period of A=0.391
Time period of B=0.502
Time period of F=1.113
Time period of H= 2.926
COMPARISION 4
Aim: To compare the effect of Height on natural period of buildings B, C & D using ETABS
Building B:
1. Opening New model
2. Setting the Building B storey as 5 and number of bays in X direction as 4 and in Y direction as 3
3. Defining the section property of column as 400X400mm
4. And also defining the other section properties of Beam and slab
5. Assigning the Live load as 3kN/m2 .
6..Run the analysis
7. In Display tab selecting the show table option
8. Checking in the modal participating ratio
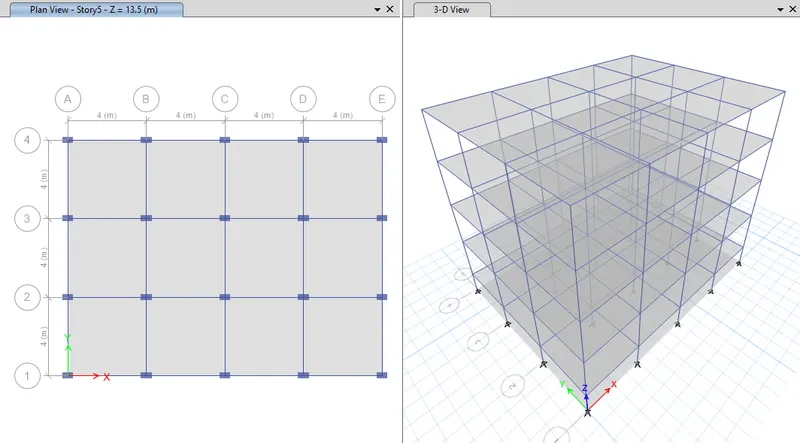
Building C:
1. Opening New model
2. Setting the Building C storey as 5 and number of bays in X direction as 4 and in Y direction as 3
3. Defining the section property of column as 550X300mm
4. And also defining the other section properties of Beam and slab
5. Assigning the Live load as 3kN/m2 .
6..Run the analysis
7. In Display tab selecting the show table option
8. Checking in the modal participating ratio
Building D:
1. Opening New model
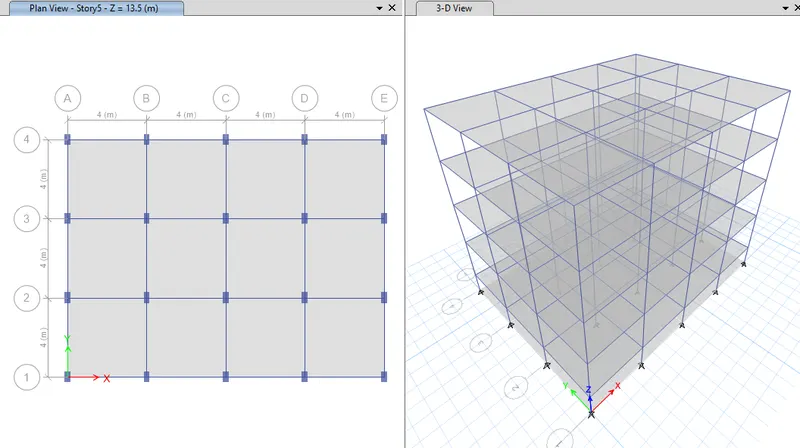
2. Setting the Building D storey as 5 and number of bays in X direction as 4 and in Y direction as 3
3. Defining the section property of column as 300X550mm
4. And also defining the other section properties of Beam and slab
5. Assigning the Live load as 3kN/m2 .
6..Run the analysis
7. In Display tab selecting the show table option
8. Checking in the modal participating ratio
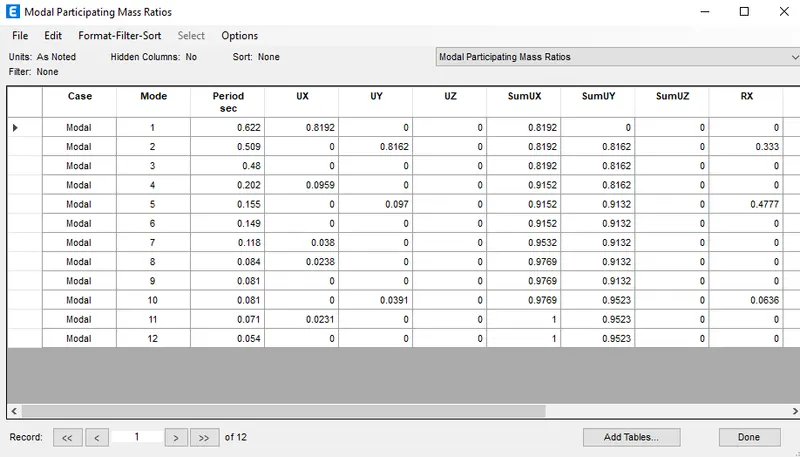
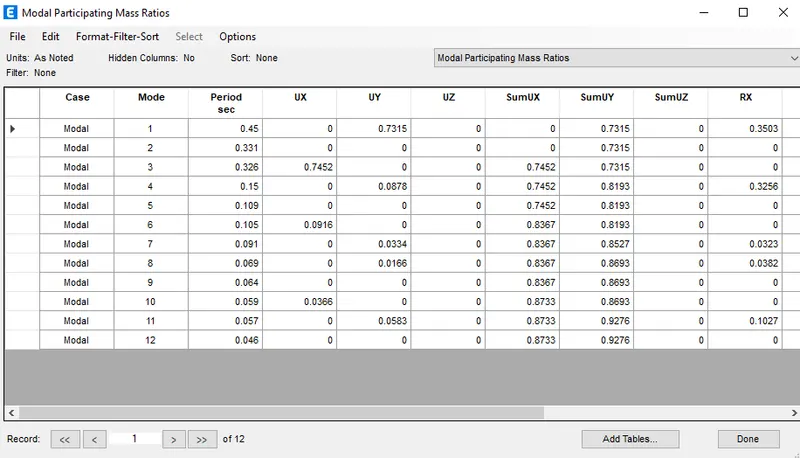
Time period of B=0.502
Time period of C=0.450
Time period of D= 0.622
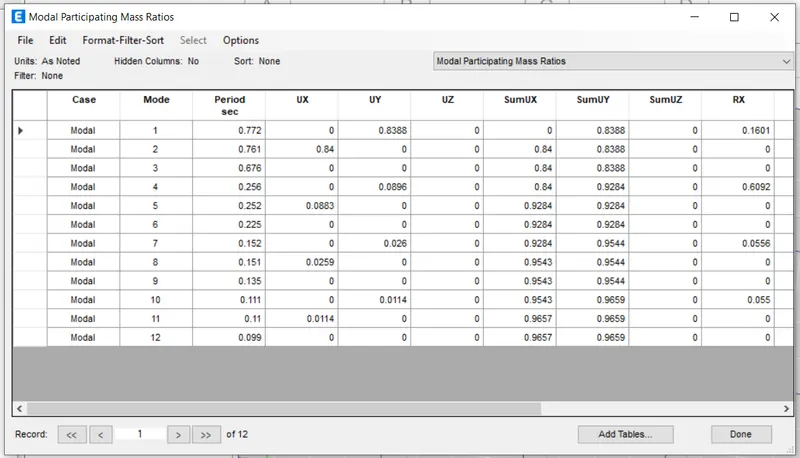
- Effect of Flexural Stiffness of Structural Elements on mode shapes:
- Compare fundamental mode shape
- of Building B in two situations when flexural stiffness of beams relative to that of adjoining columns is very small versus when it is large.
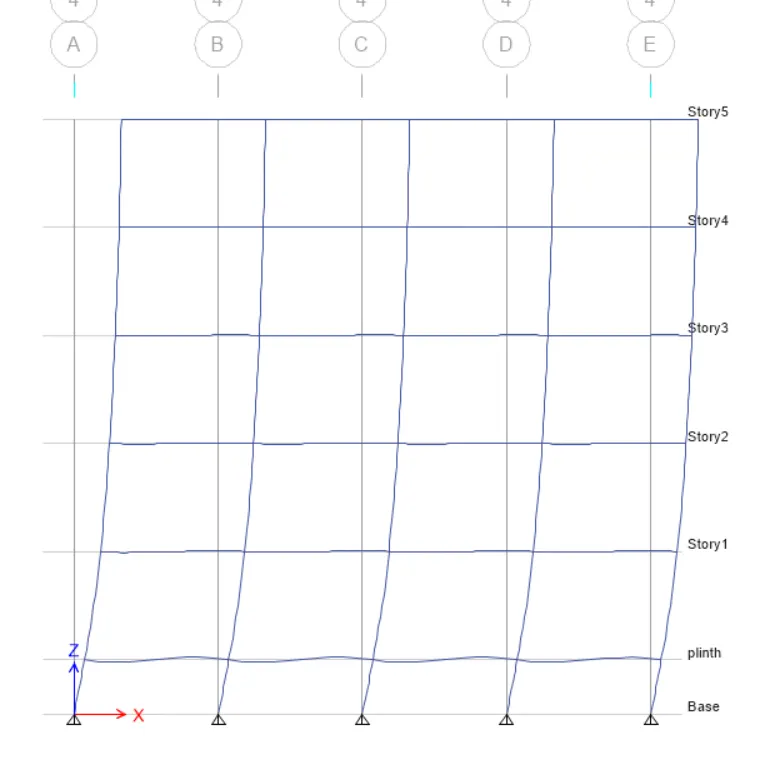
When flexural stiffness of beams is smaller than adjoining columns:
MODE 1:
MODE 2:
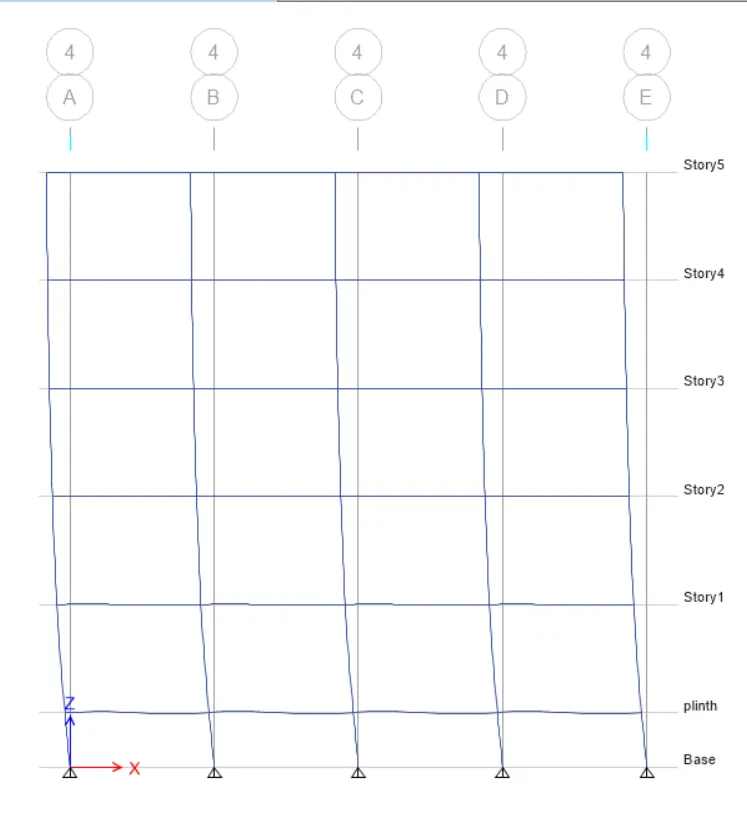
MODE 3:
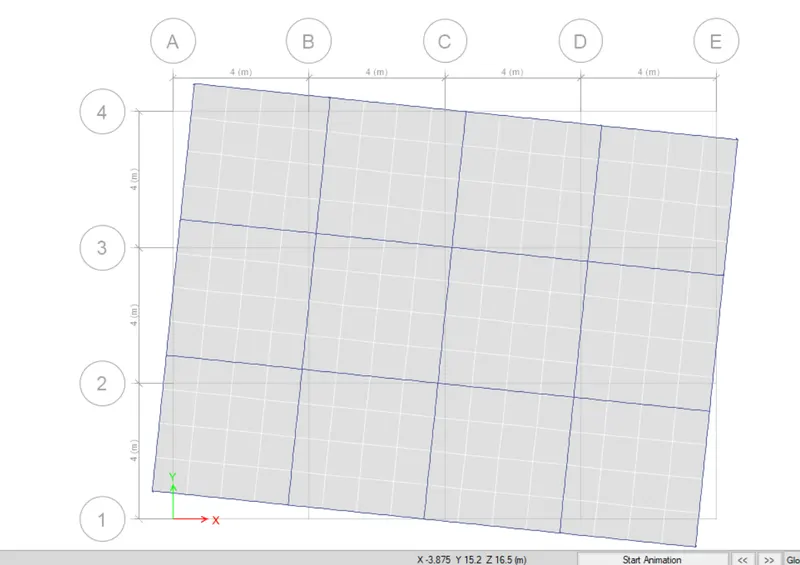
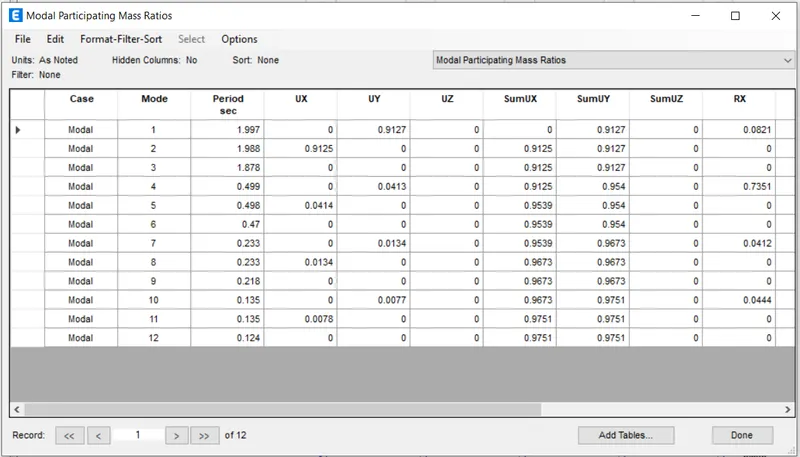
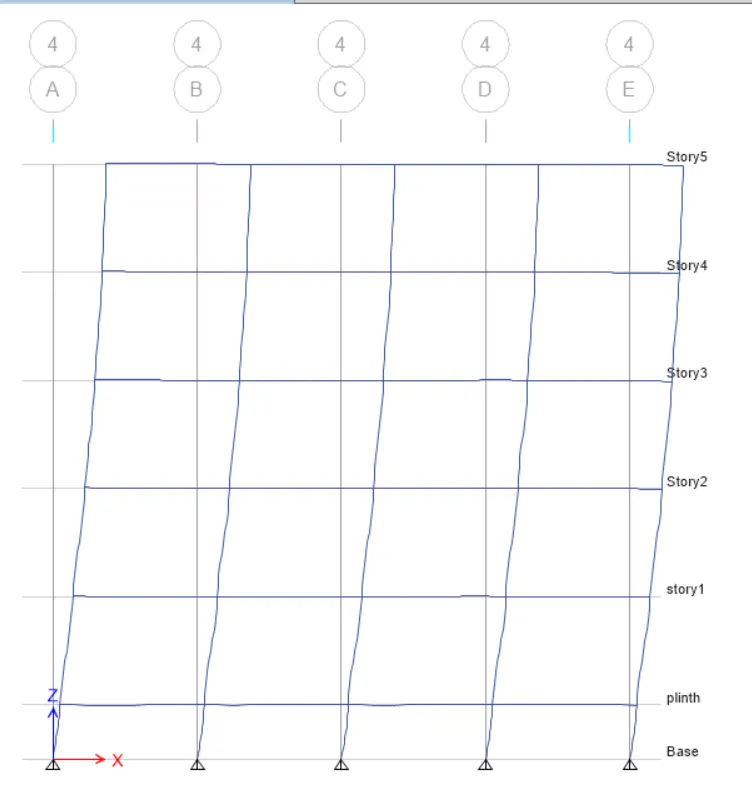
When the flexural stiffness of beams is larger than adjoining columns:
MODE 1:
MODE 2:
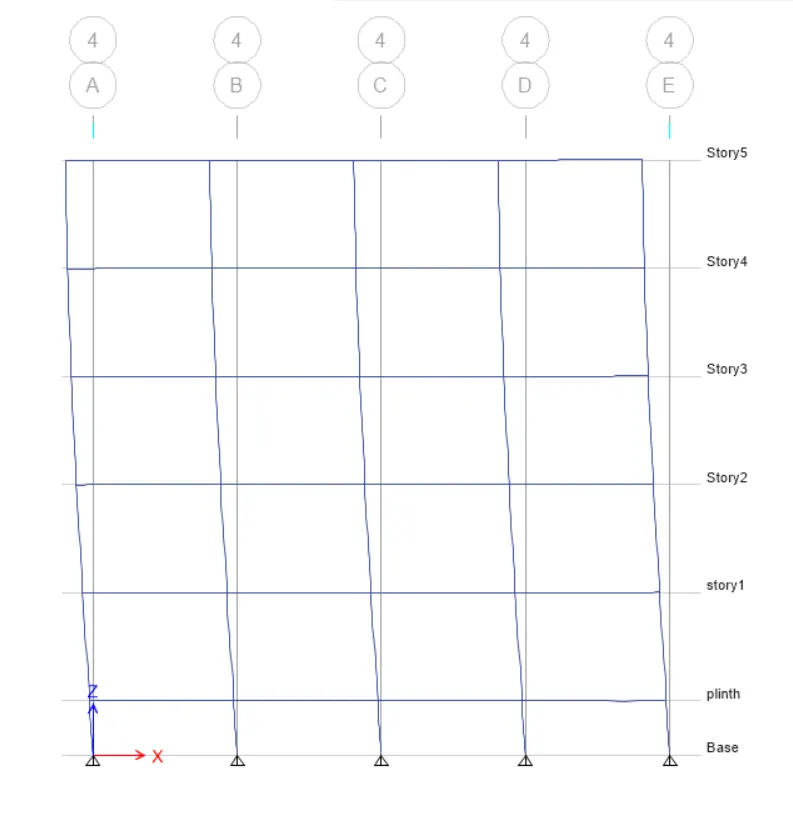
MODE 3:
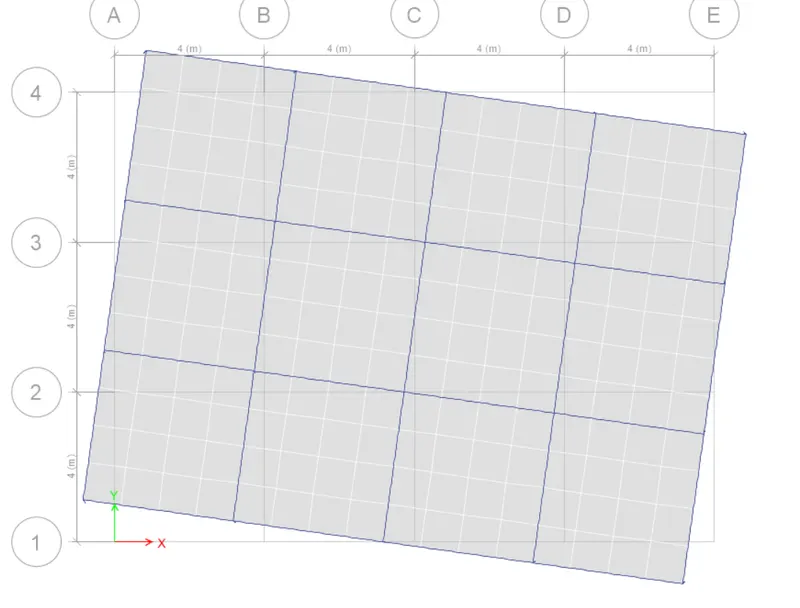
ALL MODES :
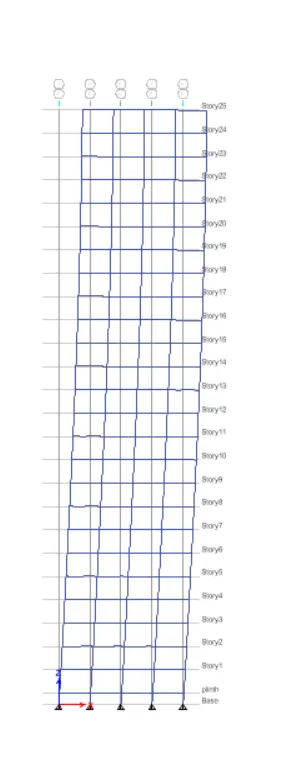
- Effect of Axial Stiffness of Vertical Members on mode shapes:
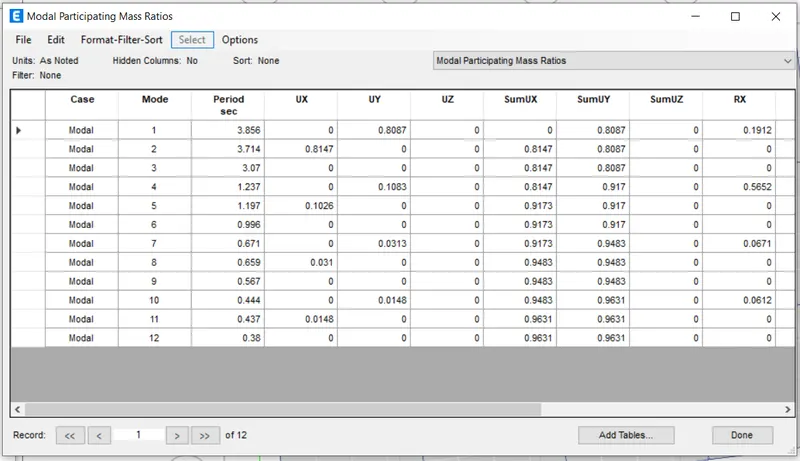
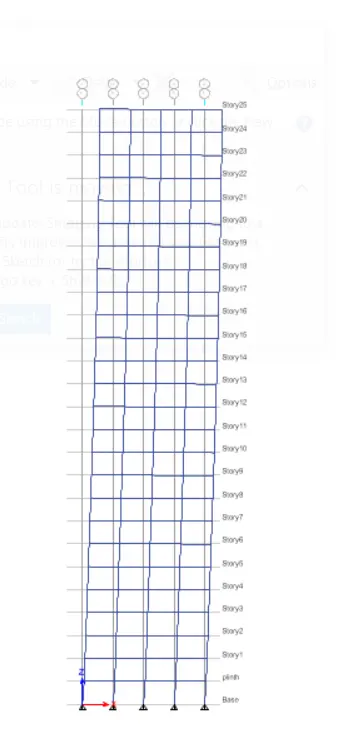
- Compare fundamental mode shape of Building H
- in two situations when axial cross-sectional area of columns is very small versus when it is large.
when axial cross sectional area of columns is very large.
MODE 1:
MODE 2:
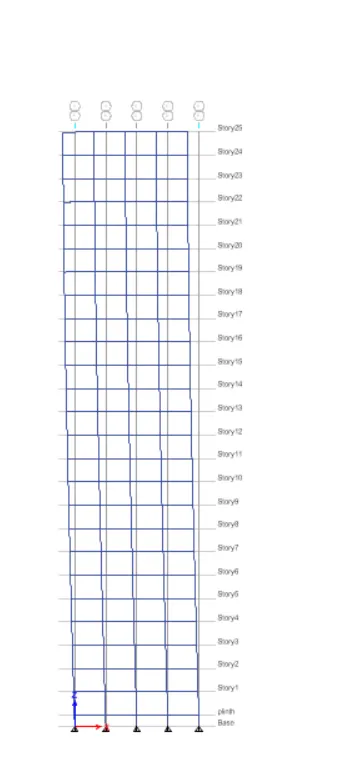
MODE 3:
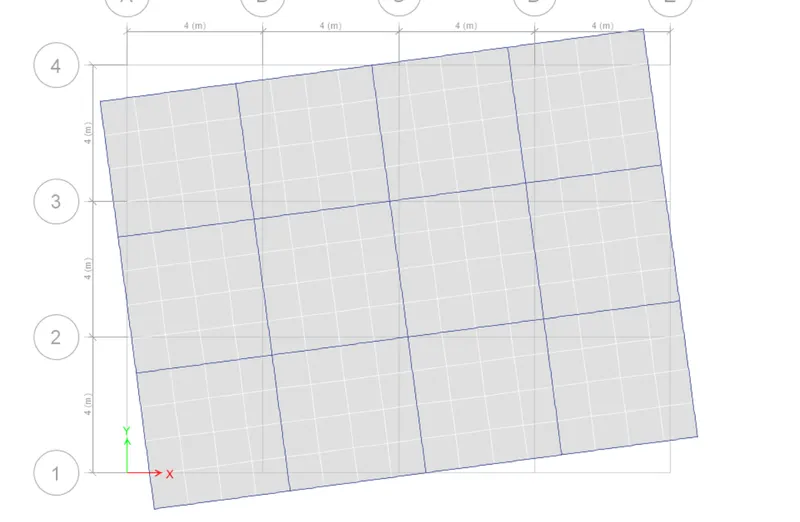
ALL MODES :
when axial cross section of column is very small.
MODE 1:
MODE 2:
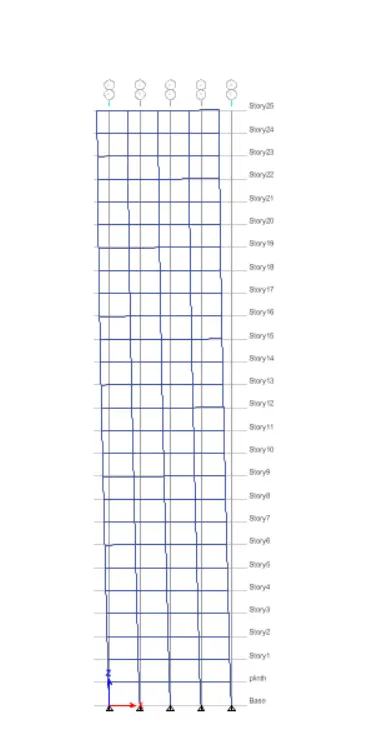
MODE 3:
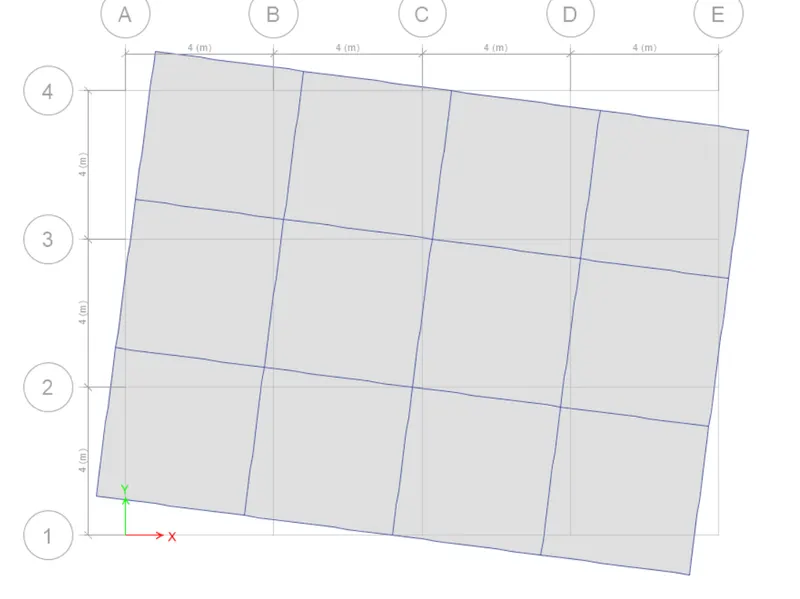
ALL MODES :
- Effect of Degree of Fixity at column bases on mode shape:
- Compare fundamental mode shape of Building B in two situations when base of columns is pinned versus when it is fixed.
when the supports are pinned.
MODE 1:
MODE 2:
MODE 3:
ALL MODES :
- Effect of Degree of Fixity at column bases on mode shape:
- Compare fundamental mode shape of Building B in two situations when base of columns is pinned versus when it is fixed.
when supports are fixed.
MODE 1:
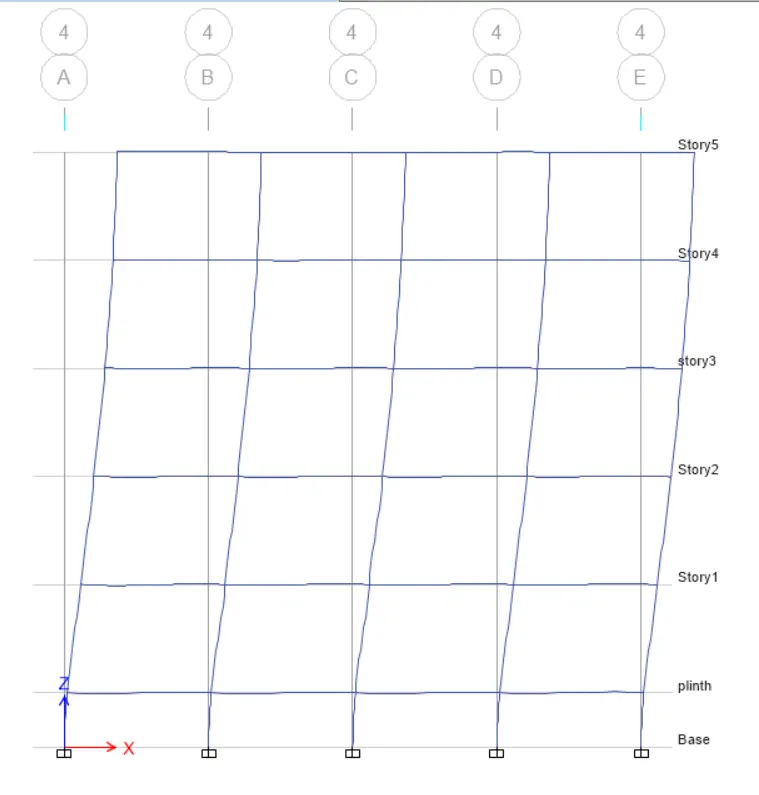
MODE 2:
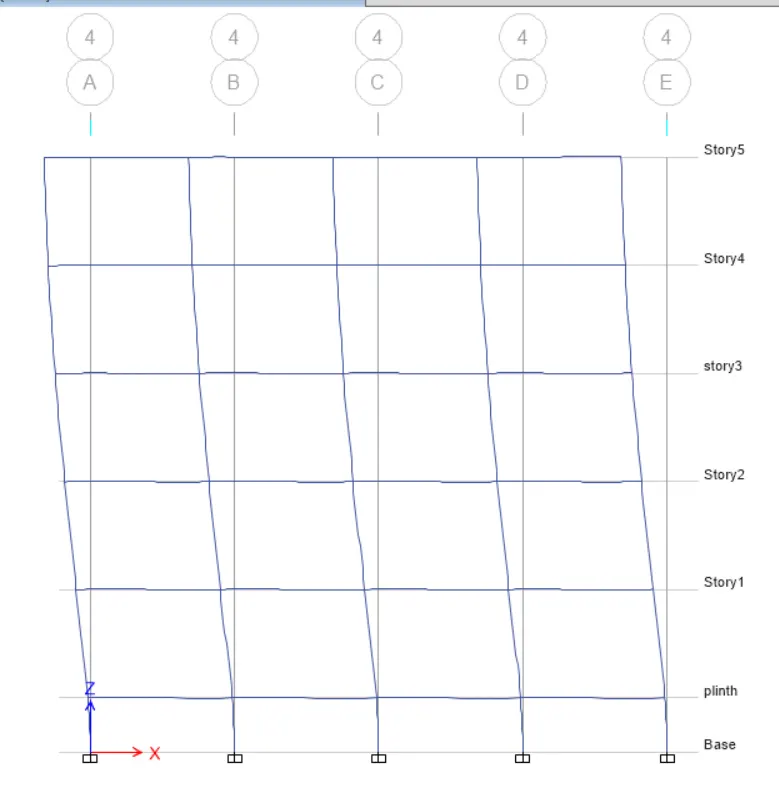
MODE 3:
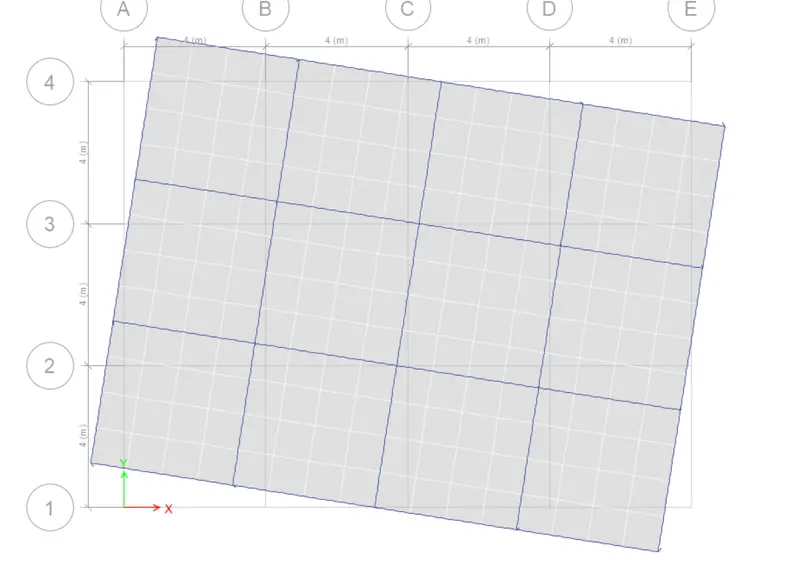
ALL MODES :