Project 1
Aim: To create a Simulink model for the given flowchart.
Objective:
1. The input to the model would be the power demand.
2. The output should be:
i. Fuel cell power
ii. Battery power
iii. FC Operating state (running, standby)
3. Create plot of these outputs against time.
4. Load the .mat file into the workspace.
Theory:
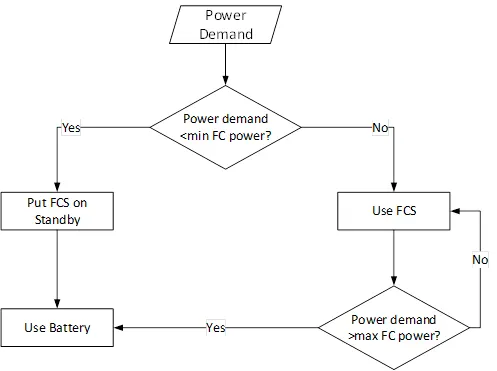
As shown from the above flowchart, there are two power sources fuel cell and battery.
The logic has been such that if the power demand from the vehicle is less than the minimum FC
power than the FC must go on standby and the power should be supplied from the battery storage
system and if the power demand is greater than the min FC power than the FC should be used and if
the power demand of vehicle is for than the max power of FC than the battery should supply the
power.
Parameters are:
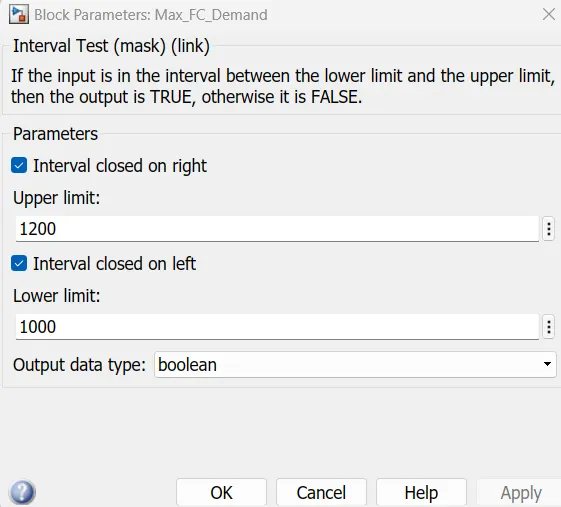
Max.FC Power Demand = 1000 to 1200,
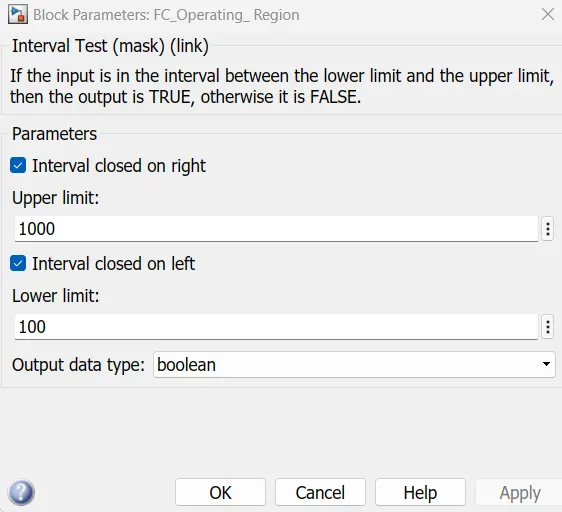
FC Operating range = 100 to 1000, and
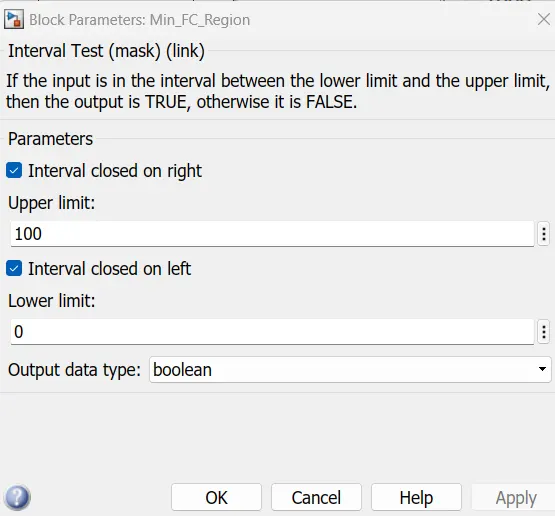
Min.FC Operating range = 0 to 100.
Simulink Model:
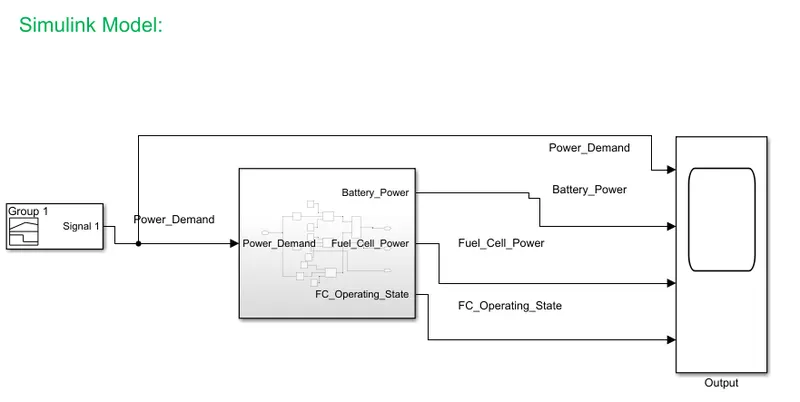
Simulink model consist of following blocks,
1. Signal Builder Block
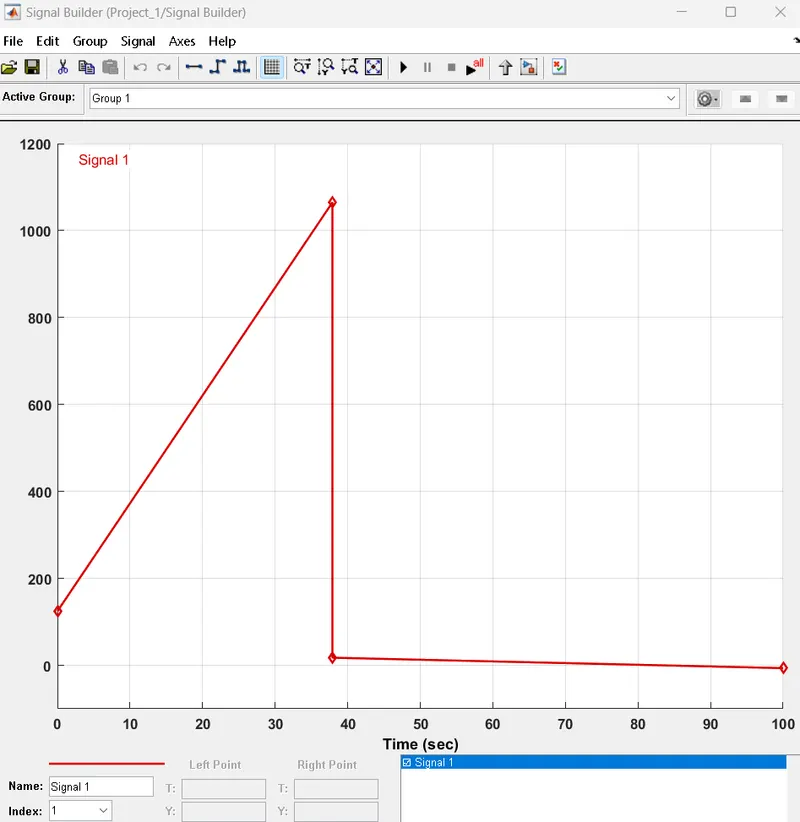
It is used for the power demand values between 0 to 1200 the signal is created as a drive cycle as
shown in above figure.
The waveform structure can be varied by clicking each node and dragging it as required.
2. Subsystem
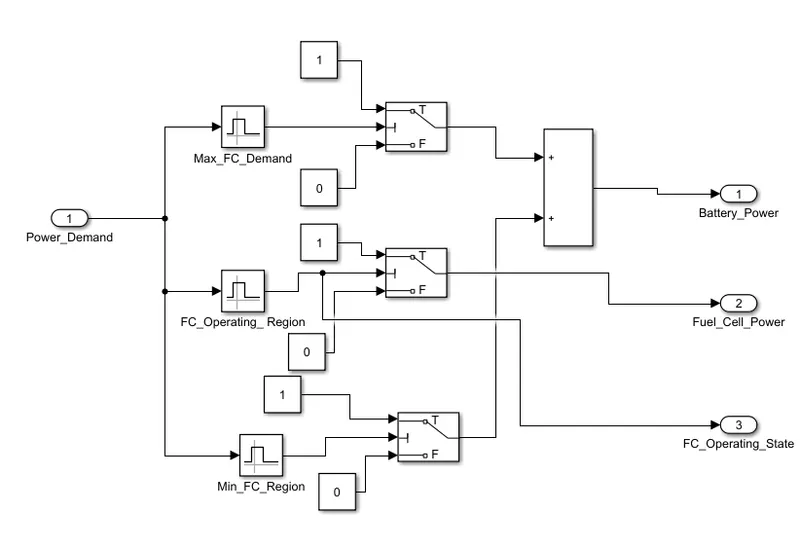
The above subsystem consist of following blocks,
1. Inport
Provide an input port for a subsystem or model.
For Triggered Subsystems, 'Latch input by delaying outside signal' produces the value of the
subsystem input at the previous time step.
For Function-Call Subsystems, turning 'On' the 'Latch input for feedback signals of function-call
subsystem outputs' prevents the input value to this subsystem from changing during its execution.
The other parameters can be used to explicitly specify the input signal attributes.
2. Interval Test
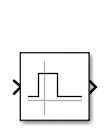
If the input is in the interval between the lower limit and the upper limit, then the output is TRUE,
otherwise it is FALSE.
In this simulation model, we have used 3 interval test block;
3. Constant
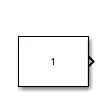
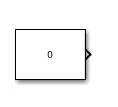
Output the constant specified by the 'Constant value' parameter. If 'Constant value' is a vector and
'Interpret vector parameters as 1-D' is on, treat the constant value as a 1-D array. Otherwise,
output a matrix with the same dimensions as the constant value.
4. Switch
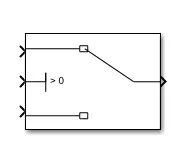
Pass through input 1 when input 2 satisfies the selected criterion; otherwise, pass through input 3.
The inputs are numbered top to bottom (or left to right). The first and third input ports are data
ports, and the second input port is the control port. The criteria for control port 2 are u2 >=
Threshold, u2 > Threshold or u2 ~= 0.
5. Add
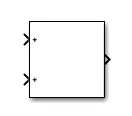
Add or subtract inputs. Specify one of the following:
a) character vector containing + or - for each input port, | for spacer between ports (e.g. ++|-|++)
b) scalar, >= 1, specifies the number of input ports to be summed.
When there is only one input port, add or subtract elements over all dimensions or one specified
dimension
6. Outport
Provide an output port for a subsystem or model. The 'Output when disabled' and 'Initial output'
parameters only apply to conditionally executed subsystems. When a conditionally executed
subsystem is disabled, the output is either held at its last value or set to the 'Initial output'.
3. Scope
Output of Battery_Power, Fuel_Cell_Power, Power_Demand and FC_Operating_State can be
observed with the help of the scope.
On Simulating the above model for 100 sec, we get the result as;
Results:
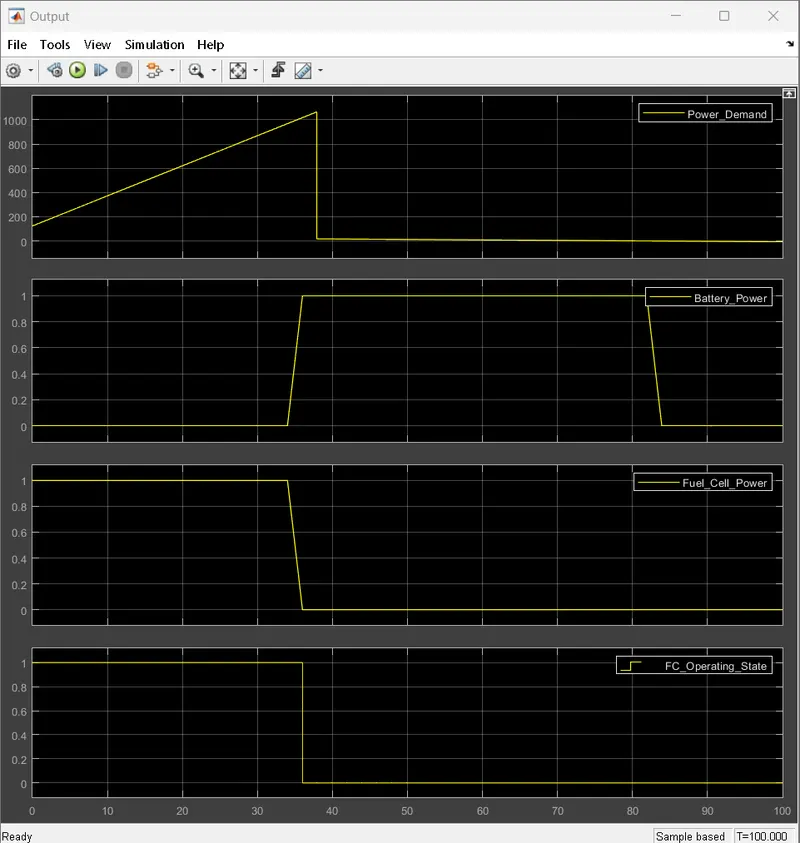
From the above graph, it can be seen that the power deand (I/P) and the power delivered by the
battery is that any power below 100 and power above 1000 is delivered by battery. Any power
between 100 and 1000 is delivered by the fuel cell. It is clearly understood that when the power
demand(i/p) is between 100 and 1000 the output is 1 indicating that the operating state of fuel cell is
ON and any power below 100 and above 1000 the output is 0 indicating that the operating state of
fuel cell is OFF.
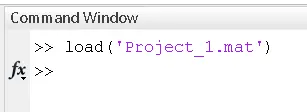
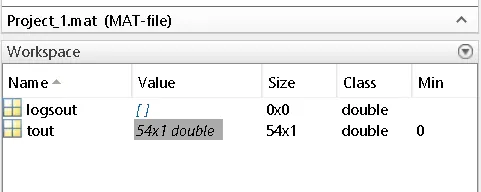
Also .mat file is is load into a workspace.
Link:
https://drive.google.com/file/d/1lltRuaVjWcx4c8cZaDeDtuPPbJogti-M/view?usp=sharing
Kindly open attached file with MATLAB/Simulink.
Conclusion:
For a given flowchart, Simulink model is created successfully and desired output is obtained for
1. Fuel cell power
2. Battery power
3. FC Operating state (running, standby) for this input is provided in the form of power demand.
Simulink file is attached and also saved and load into a workspace.