Project 1
the development of a forward energy-based fuel consumption model of a conventional vehicle:
1.“Project1_InitFile.m” is taken and then checked and it runs successfully.
2. “Project1_VehicleModel.slx” is loaded in simulink.
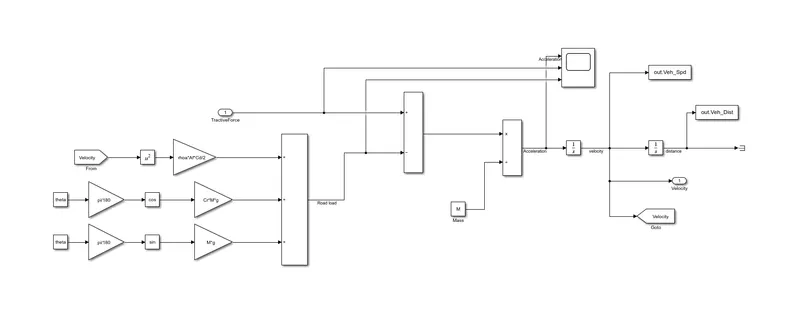
3.Vehicle dynamics block is missing and it is done, input is tractive force from wheels, output is velocity of the vehicle.
4. Road load is subtracted with the tractive force and mass is divided to that one to get acceleration.
5. acceleration is integrated with time and now the output is velocity.
6.final output of the block is velocity.
7. the Vehicle dynamics block is given below.
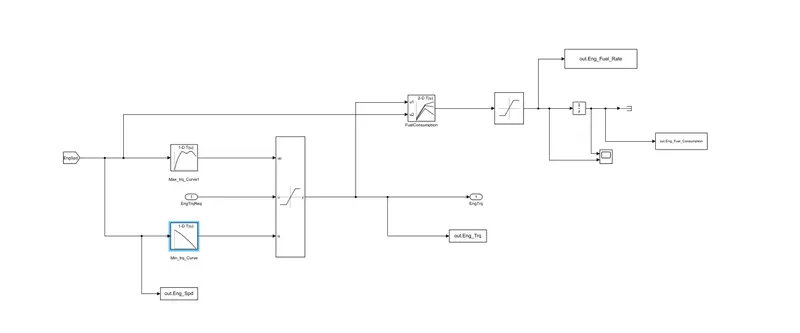
8. Engine block is missing.
9. using saturation dynamic block engine speed is verified by maximum and minimum torque curve in 1-D lookup table.
10.it is check with the engine torque required, it will come from ECU.
11. 2D lookup table is taken and inputs are engine speed and ouput engine torque.
12.we get fuel consumption and by saturation, engine fuel rate will come.
13. integrating the engine fuel rate output come as Engine fuel consumption.
14.in saturation dynamic blockdone and output engine torque will come and it sent to transmission.
15. engine block is given below.
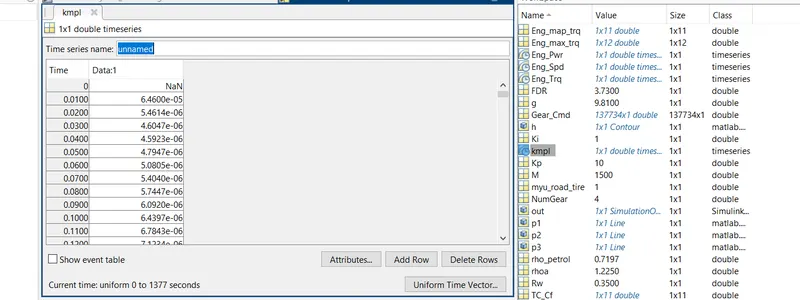
a. Tabulate the fuel economy numbers (kmpl) for UDDS and HWFET cycle. This forms the baseline numbers for comparing with the future hybrid version.
kmpl is given for UDDS and HWFET cycle.
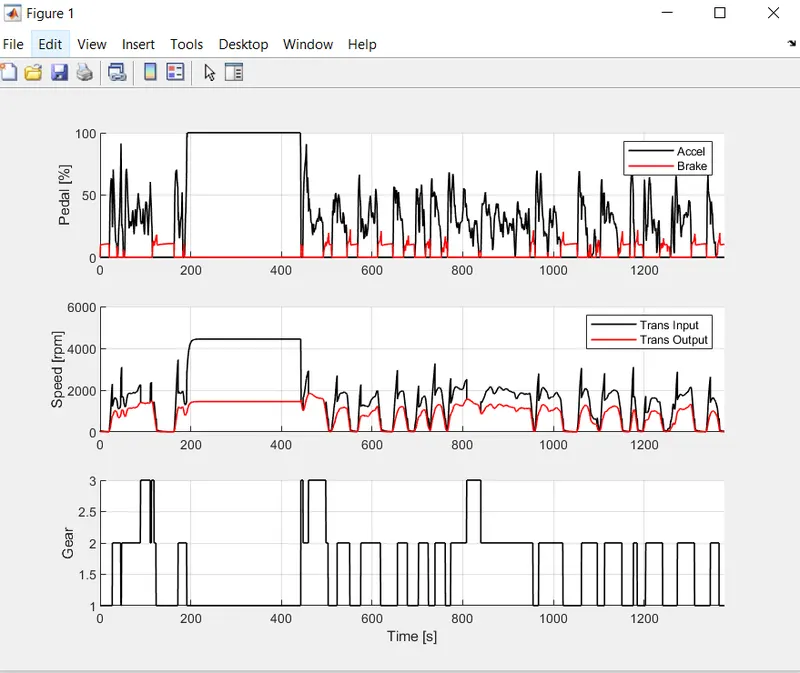
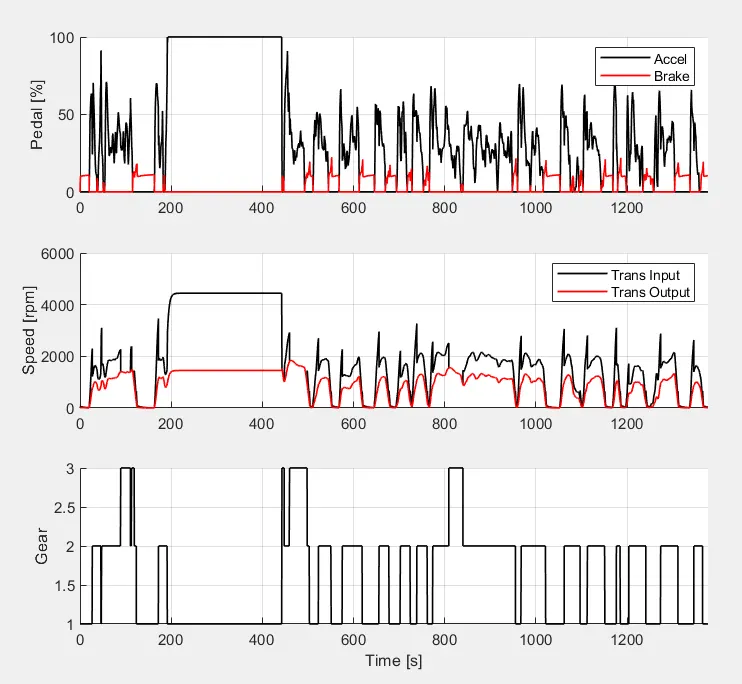
b. Plot the time trace for engine, transmission input, transmission output and wheel speed on one plot.
d. Plot accelerator and brake pedal, gear command, vehicle desired and actual speed, vehicle distance using subplots.
- for b and d figures are given is single map.
- accel and brake torque is taken from WHEEL block.
- these are inputs to the wheel, where accel torque will come from Differential as Axle torque.
- brake torque will come from Control signals.
- transmission input, transmission output are taken from the transmission block.
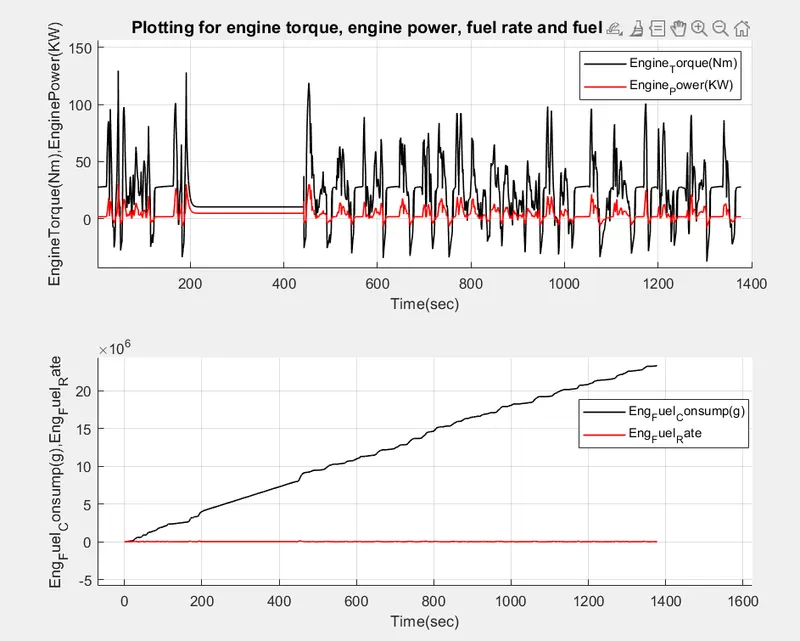
C. Plot engine torque, engine power, fuel rate and fuel consumption using subplots.
- Engine power is calculated by the formulae given below.
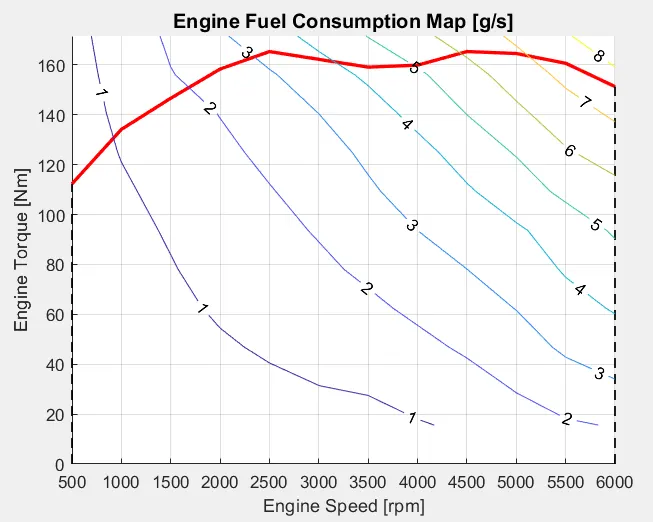
e. Plot the engine operating points on the engine fuel map.
-engine operating points w.r.t torque and speed are given below.
f. the vehicle behavior throughout the drive cycle:
the time trace for engine, transmission input, transmission output and wheel speed plot, the transmission input speed is high compared to the output speed due to mechanical load losses.
in axle and break torque, axle had more torque and sending to the wheel. break torque is less compared to accel.speed is raising w.r.t time.
engine torque is high compared to engine power.engine fuel consumption is increasing while engine fuel rate is constant.
g. Generate the plots for both drive cycles:
the plots for both drive cycles are attached to the project files with respective drive cycles name.
Plotting the time trace for engine, transmission input, transmission output and wheel speed plots for HWFET AND UDDS uploaded as snips due to their high memory they are not inserted as image shown below..please consider them.
HWFET CYCLE:
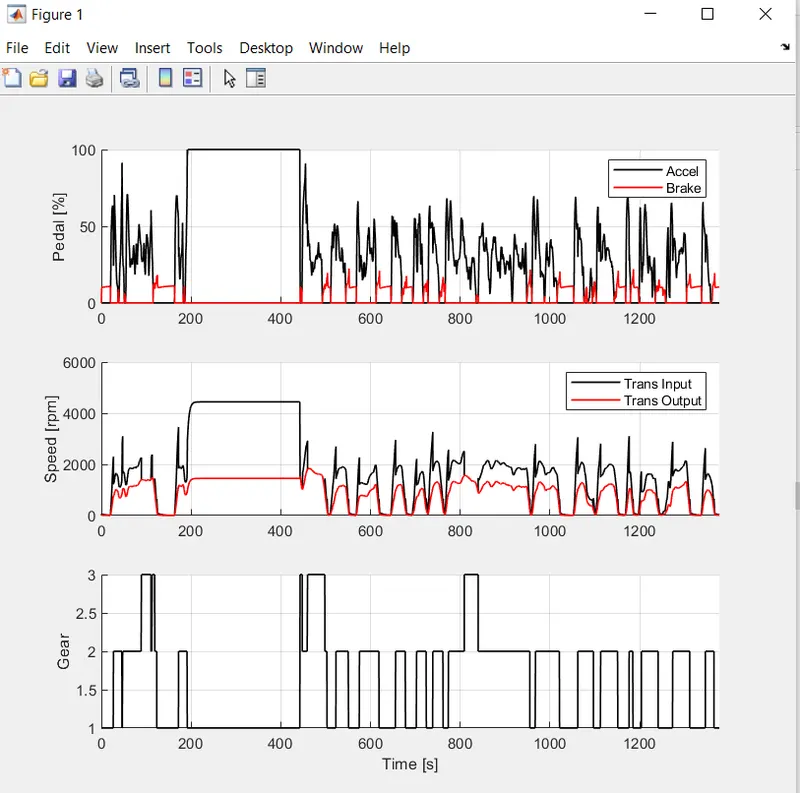
UDDS CYCLE: