Project 1
Aim: To create a simulink model for the given flow chart.The flow chart is related to load following flowchart
Procedure:
Input: The model input is the power demand of the vehicle. The input is taken from the excel file which has different power demand for the time of 150 sec.
Output:
The output should be:
- Fuel cell power
- Battery power
- FC Operating state (running, standby)
Flowchart conditions:
1) When the power demand is less than the min Fuel cell(FC) power then that power is given by the battery as the FC is in off position.
2) When power demand is in between min FC and max FC then the power is given by FC only.
3) When the power demand is more than the max Fuel cell(FC) power then that power is given by the battery as the FC is in off position.
Let's consider,
Max bttery power = 800kw
Min FC power = 100Kw
Max FC power = 500KW
The simulation model:
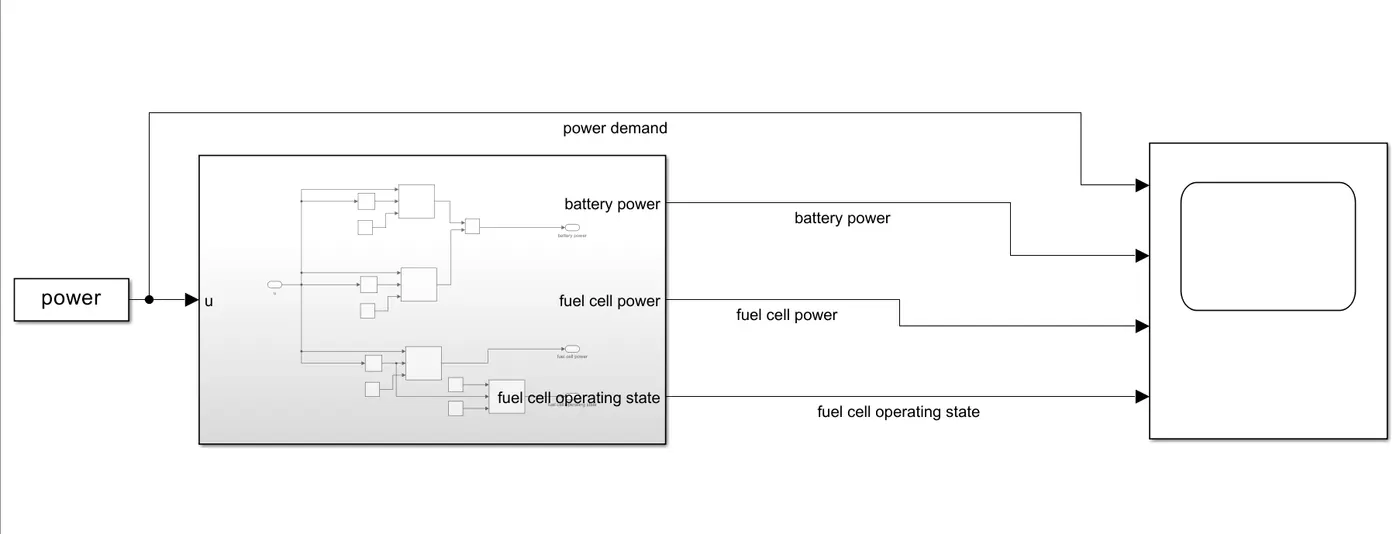
In the model the power is taken from the workspace. And there is a subsystem which is related to the flowchart is shown.
The subsytem is as follows:
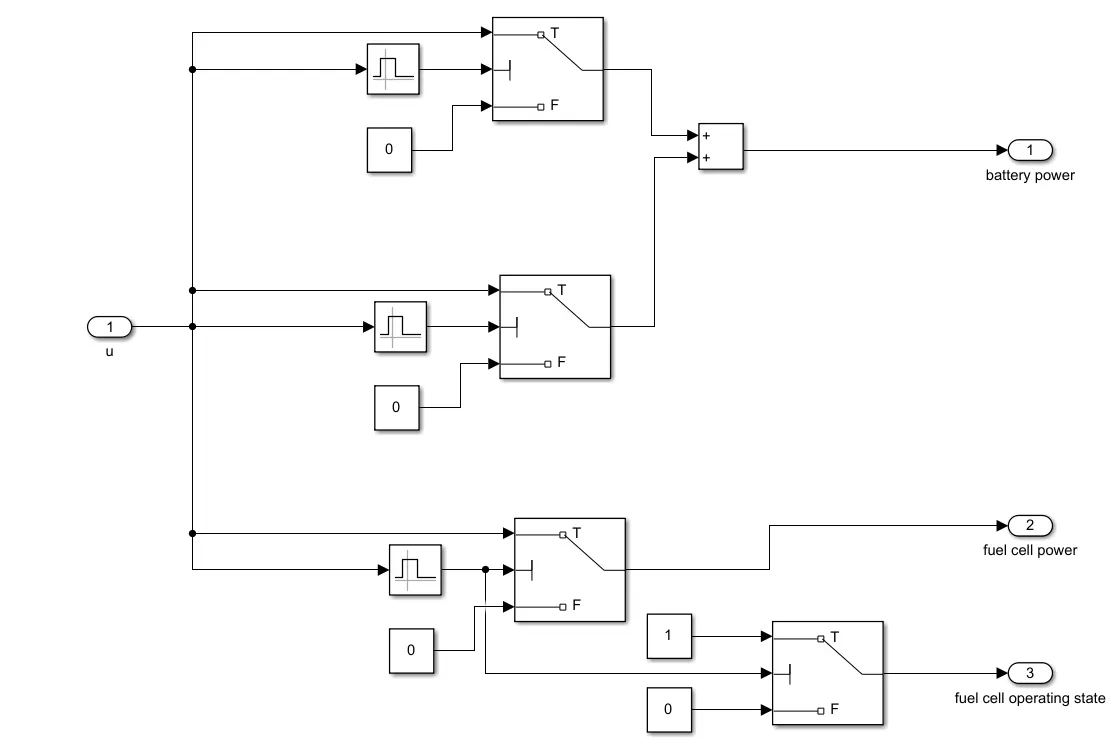
In the above the intervel test is used to set the limits of the power to which it should work and allow the battery and fuel cell to work.
The output of the system is as follows:
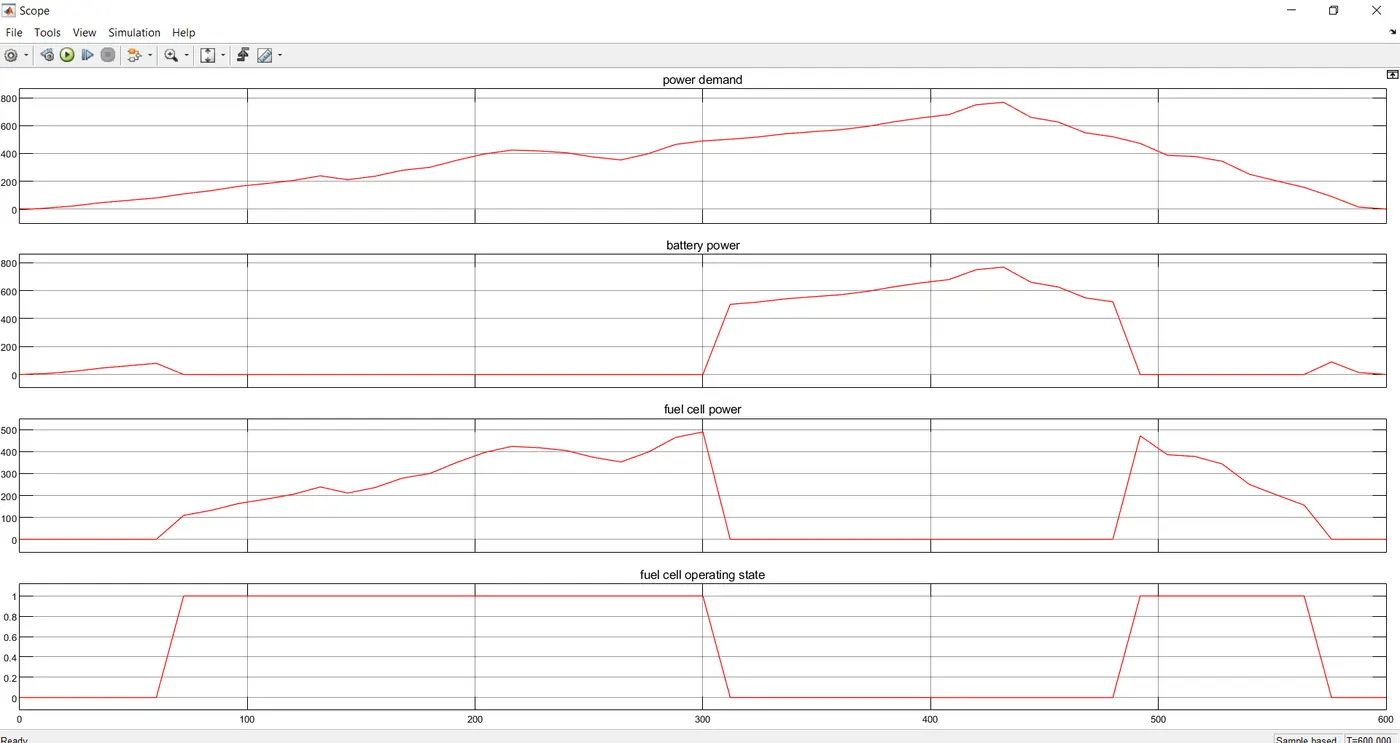
In the above the power demand is in between 0 to 800KW. Here the min FC value ic 100KW and the max FC value is 500 KW. In this range the FC is on and gives the power to vehicle. For other power demand the battery would cover it.