Project 1
%%%%%%%%%%%%%%%%%%%%%%%%%%%%%%%%%%%%%%%%%%%%%%%%%%%%%%%%%%%%%%%%%%%%%
%% Skill-Lync -> Hybrid Drives Development
% Project 1 - Conventional Vehicle Model


% Description:

%% Initialization File
% Initialization file for loading the variables for the Conventional vehicle simulation model

clc;
clear;
%% Vehicle Parameters
M = 1500;       % Vehicle weight [kg]
Cr = 0.015;     % Rolling resistance coefficient
Rw = 0.35;      % Rolling radius [m]
Cd = 0.33;      % Drag coefficient
Af = 2;         % Frontal area [m2]
rhoa = 1.225;   % Air density [kg/m3]
Vwind = 0;      % Wind velocity [kmph]
g = 9.81;       % Gravitational acceleration [m/s2]
theta = 0;      % Slope [deg]
myu_road_tire = 1; % Coefficient of friction between tire - road interface

%% Powertrain Parameters
FDR = 3.73;                         % Final Drive Ratio / Diff Ratio
DiffEff = 0.99;                     % Differential efficiency (assumed independent of operating conditions)

NumGear = 4;                        % Number of gears in transmission
TransGear = 1:NumGear;            % Transmission Gears
TransRatio = [3.06, 1.62, 1, 0.7];  % Corresponding Transmission ratios
TransEff = 0.90;                    % Transmission efficiency (assumed independent of operating conditions)

TC_SR = [0, .5, .6, .7, .8, .87, .92, .94, .96, .97, 1];   % Torque Converter Speed Ratio (Matlab default) -> TurbSpd/PumpSpd
TC_TR = [2.232, 1.5462, 1.4058, 1.2746, 1.1528, 1.0732, 1.0192, 1, 1, 1, 1];   % Torque Converter Torque Ratio (Matlab default) -> TurbTrq/PumpTrq
TC_Cf = 1e-4 * [.72558, .66322, .63463, .59042, .51331, .4144, .29287, .22444, .12186, .04386, 0]; % Torque Converter Capacity Factor (Matlab default) -> PumpTrq/PumpSpd^2 [Nm/rpm^2]

load Vehicle_Data/Engine_data_1_9L_Saturn_95kW
load Vehicle_Data/Trans_Shift_map

%% Driver Parameters
Kp = 10;                    % P gain for driver PI model
Ki = 1;                     % I gain for driver PI model
Drive_Cycle_Select = 1;     % Drive cycle selection

% Drive cycle values in m/s

if Drive_Cycle_Select == 1
    load DriveCycles/UDDS;

elseif Drive_Cycle_Select == 2
    load DriveCycles/HWFET;

elseif Drive_Cycle_Select == 3
    load DriveCycles/FTP;

elseif Drive_Cycle_Select == 4
    load DriveCycles/US06;

elseif Drive_Cycle_Select == 5
    load DriveCycles/NEDC;

elseif Drive_Cycle_Select == 6
    load DriveCycles/WLTP;

end

time_end = cyc_time(end);
vel_end = cyc_vel(end);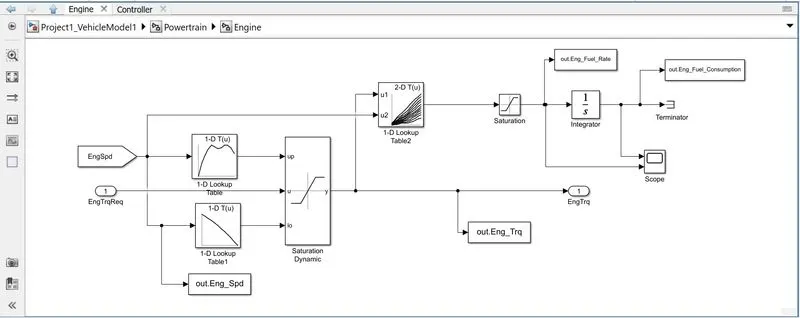
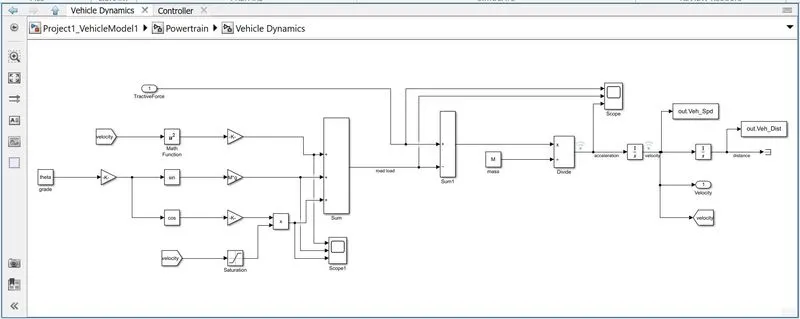
%%%%%%%%%%%%%%%%%%%%%%%%%%%%%%%%%%%%%%%%%%%%%%%%%%%%%%%%%%%%%%%%%%%%%
%% Skill-Lync -> Hybrid Drives Development
% Project 1 - Conventional Vehicle Model


% Description:
% The following file is to used with the Initialization file and Simulink
% results for post-processing of the data.
% The file is incomplete, has some examples of how the data is imported
% into a readable format, data analysis and plotting examples.
% Based on the project task, use commands in a similar format as given
% below, to analyse the data and generate required plots.
% You can change variable names if desired

%% Post-Processing File
%  File for post-processing the Conventional vehicle simulation model data

%% Renaming variables
Time = out.tout;
Acc_Pdl = out.Acc_Pdl;          % Accelerator pedal [%]
Brk_Pdl = out.Brk_Pdl;          % Brake pedal [%]
Gear_Cmd = out.Gear_Cmd;        % Transmission gear
Trans_In_Spd = out.Trans_In_Spd*30/pi;  % Transmission input speed [rpm]
Trans_Out_Spd = out.Trans_Out_Spd*30/pi;% Transmission output speed [rpm]
Eng_Trq = out.Eng_Trq;          % Engine brake torque [Nm]
Eng_Spd = out.Eng_Spd*30/pi;    % Engine speed [rpm]
Eng_Fuel_Consump = out.Eng_Fuel_Consumption;    % Engine fuel consumption [g]
Veh_Dist = out.Veh_Dist/1000;   % Distance traveled by vehicle [km]
Veh_Spd = out.Veh_Spd*18/5;     % Vehicle speed [kmph]


%% Data Analysis
Eng_Pwr = Eng_Spd.*pi./30.*Eng_Trq./1000;   % Engine brake power [kW]
rho_petrol = 0.7197;                    % Density of petrol [kg/L]
kmpl = Veh_Dist(end)/(Eng_Fuel_Consump(end)/1000/rho_petrol);    % Fuel economy [kmpl]


%% Plotting vehicle characteristics time trace
figure()
subplot(3,1,1)
hold on
grid on
plot(Time, Acc_Pdl, 'linewidth', 1, 'Color', 'black');
plot(Time, Brk_Pdl, 'linewidth', 1, 'Color', 'red');
ylabel('Pedal [%]')
xlim([0, Time(end)]);
legend('Accel','Brake');
subplot(3,1,2)
hold on
grid on
plot(Time, Trans_In_Spd, 'linewidth', 1, 'Color', 'black');
plot(Time, Trans_Out_Spd, 'linewidth', 1, 'Color', 'red');
ylabel('Speed [rpm]')
xlim([0, Time(end)]);
ylim([0, 6000]);
legend('Trans Input','Trans Output');
subplot(3,1,3)
hold on
grid on
plot(Time, Gear_Cmd, 'linewidth', 1, 'Color', 'black');
xlim([0, Time(end)]);
xlabel('Time [s]');
ylabel('Gear');

%% Plotting engine operating points on engine fuel map
figure('Name','Engine Operating Points');
hold on
grid on
title('Engine Operating Points','fontsize',12);
p1=plot(Eng_map_spd*30/pi,Eng_max_trq,'linewidth',2,'color','r');
p2=line([Eng_map_spd(end)*30/pi Eng_map_spd(end)*30/pi],[0 Eng_max_trq(end)]);
set(p2,'linewidth',1,'linestyle','--','color','k');
p3=line([Eng_map_spd(1)*30/pi Eng_map_spd(1)*30/pi],[0 Eng_max_trq(1)]);
set(p3,'linewidth',1,'linestyle','--','color','k');
[c,h] = contour(Eng_map_spd'*30/pi,Eng_map_trq,Eng_fuel_map');
clabel(c,h);
xlabel('Engine Speed [rpm]');
ylabel('Engine Torque [Nm]');
title('Engine Fuel Consumption Map [g/s]');
p4 = plot(Eng_Spd,Eng_Trq,'.','color','k');
legend([p1 p4],{'Max Curve','Operating Points'});
axis([Eng_map_spd(1)*30/pi Eng_map_spd(end)*30/pi 0 Eng_map_trq(end)]);

%engine componets
figure(3);
subplot(3,1,1)
plot(Time,Eng_Trq);
xlabel('Time [s]');
ylabel('Eng_Trq');
subplot(3,1,2)
plot(Time,Eng_Spd);
xlabel('Time [s]');
ylabel('Eng_Spd');
subplot(3,1,3)
plot(Time,Eng_Fuel_Consump);
xlabel('Time [s]');
ylabel('Eng_Fuel_Consump');

%vehicle dynamics components

figure(4);
subplot(2,1,1)
plot(Time,Veh_Dist);
xlabel('Time [s]');
ylabel('Veh_Dist');
subplot(2,1,2)
plot(Time,Veh_Spd);
xlabel('Time [s]');
ylabel('Veh_Spd');
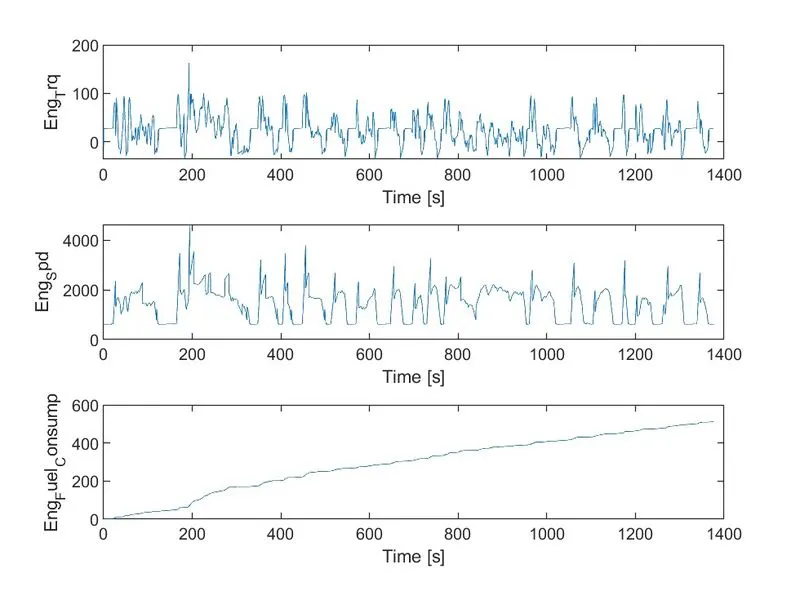
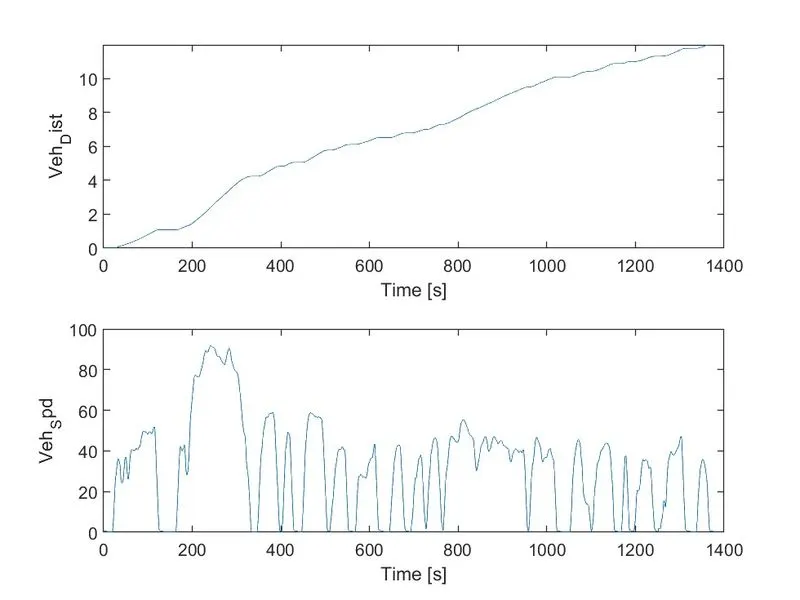
for UDDS cycle
>> kmpl

kmpl =

   16.8534
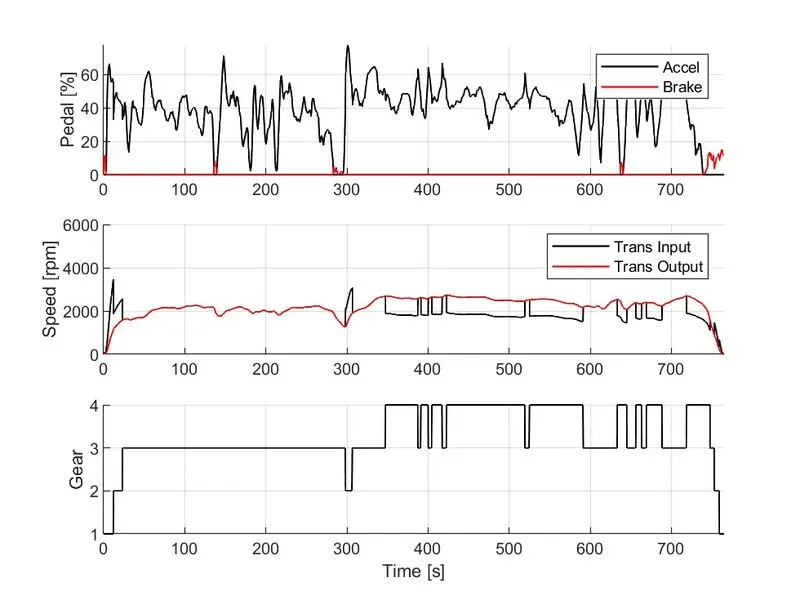
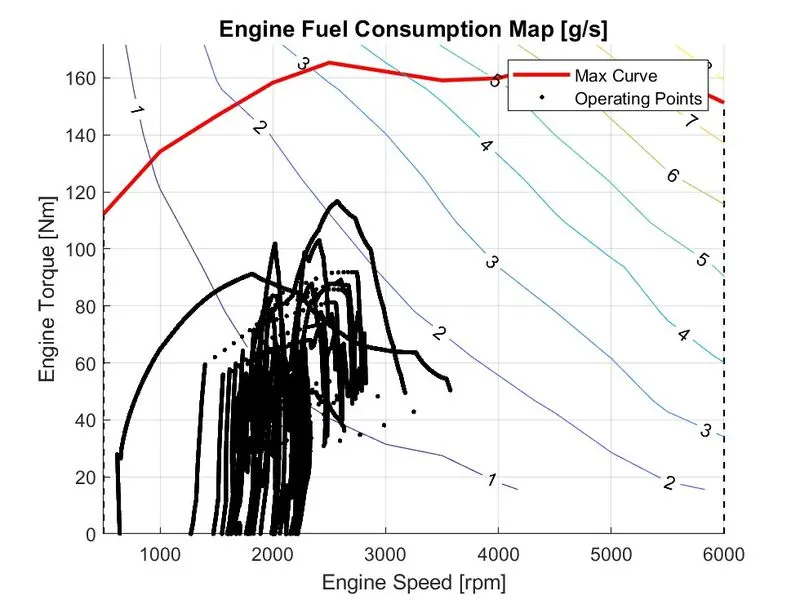
for HWFET cycle
 kmpl

kmpl =

   21.2041
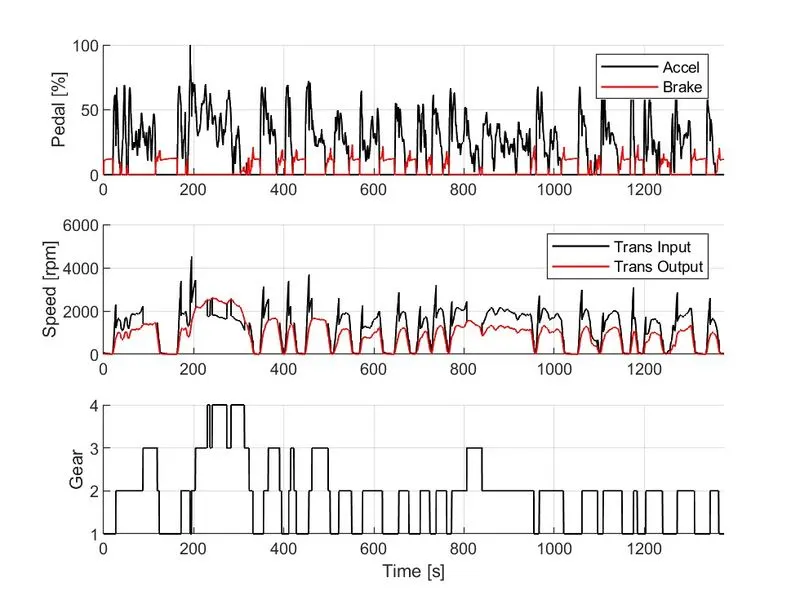
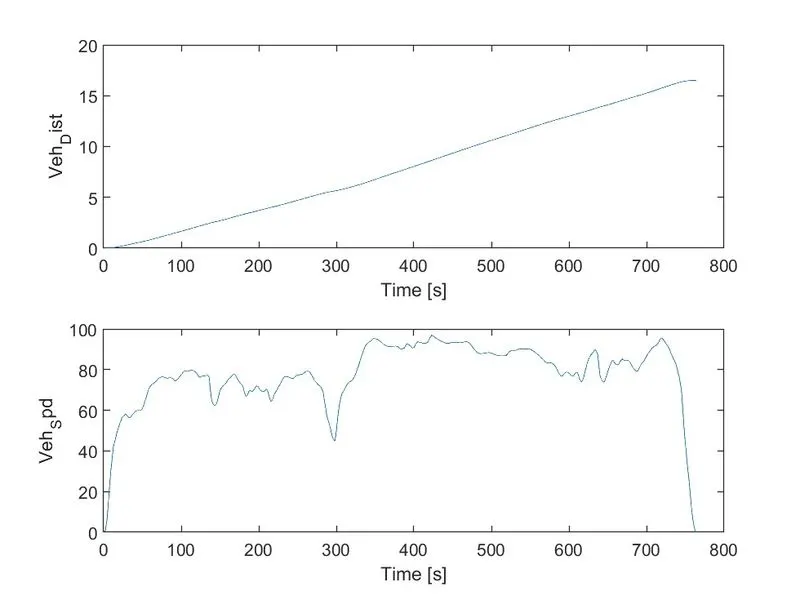
The fuel economy is seemed to be significantly more for HWFET drive cycle than the UDDS for the same vehicle characteristics. This variation is purely based on drive cycle which is easily observable .The third subplot gives the information on variation of velocity with respect to time. The UDDS drive cycle seems to have more prominent varying velocity over time than HWFET. Therefore, more brake pedal has to be used for UDDS than HWFET which can be observed from the first subplot. The more the brake pedal is pressed, the more will be the energy loss, which in turn means that less will be the fuel economy number.
The second subplot in figure gives the information on the gear over the entire drive cycle. For the UDDS cycle, more vigorous gear shifting is observed, while for the HWFET, the gear transmission is comparatively smoother. From the fourth subplot, even though the drive cycle duration is significantly less for HWFET than UDDS, the vehicle as per the HWFET seems to have covered way more distance than the other. This is again due to the smoother velocity curve for HWFET. Also, from the subplots three of Figure 10 and 11, it can be seen that the developed model was able to achieve the desired velocity, even though there are minor variations, which is obvious.
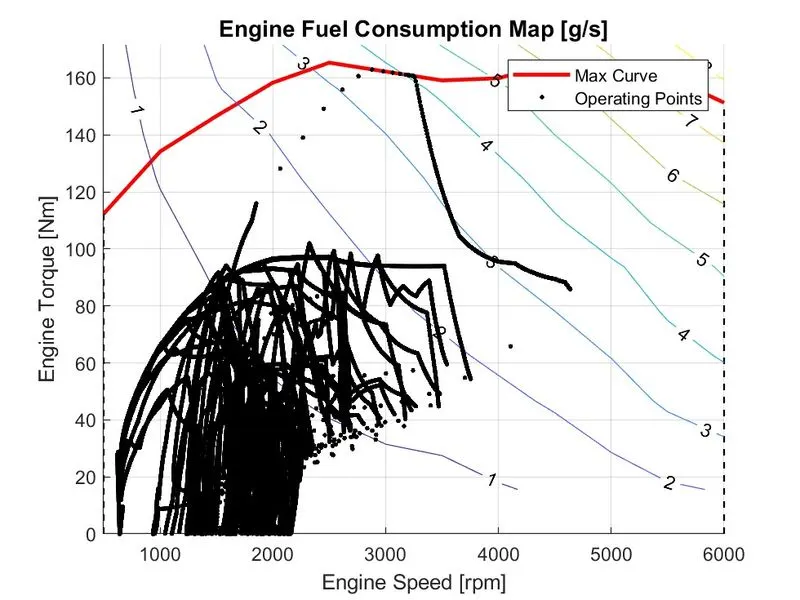
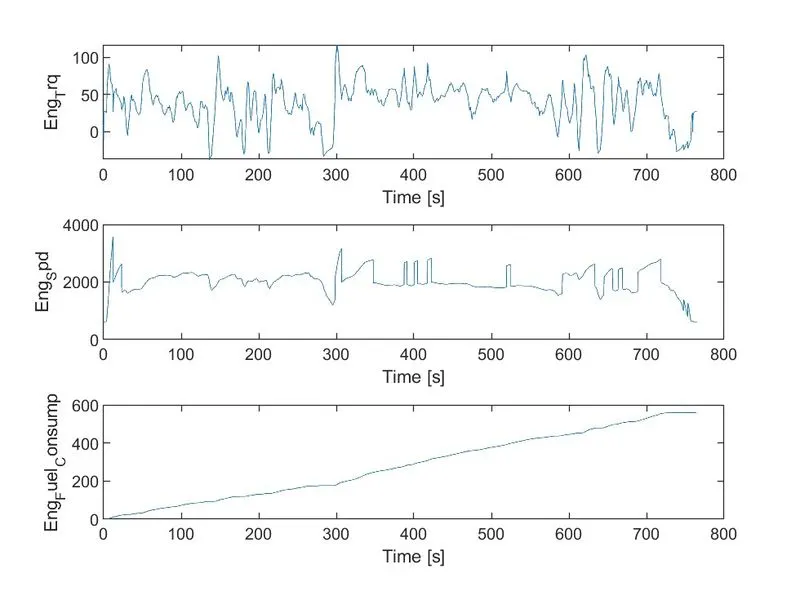
Engine Characteristics according to UDDS drive cycle.
The drive cycle velocity for HWET is more in the higher range than the UDDS. The power requirement is directly proportional to the power of three for the aerodynamic drag and directly proportional to the rolling and grading resistance. Since, the proportion of higher velocity is more predominant in HWET, the vehicle requires more power to run HWFET than UDDS, which means that, the fuel consumption of UDDS is less than HWET even though the drive cycle time is more for UDDS. This can be seen in subplot four. The engine torque, engine power and engine fuel rate is seemed to be directly proportional to each other from the Figures.
The operating points are seemed to be extreme for UDDS drive cycle. These figures reveal that, the engine is capable of going in higher velocity than required in both drive cycle as the max engine speed possible is 6000 pm. For the cases, the operating parameters are within the engine torque curve, and for HWET, there is not operating points that is challenging the engine capability.
Conclusion:
The MATLAB script for both initializing and post processing has be successfully made, and a forward energy-based fuel consumption Simulink model of a conventional vehicle is also developed successfully, and the functionality is checked. The comparative study of UDDS and HWET for the developed vehicle model is analyzed.