Project 1
1.
12-lead ECG
- 10 electrodes required to produce 12-lead ECG
- 4 Electrodes on all 4 limbs (RA, LL, LA, RL)6 Electrodes on precordium (V1–6)
- Monitors 12 leads (V1–6), (I, II, III) and (aVR, aVF, aVL)
- Allows interpretation of specific areas of the heart
- Inferior (II, III, aVF)Lateral (I, aVL, V5, V6)Anterior (V1–4)
12-lead Precordial lead placement
- V1: 4th intercostal space (ICS), RIGHT margin of the sternum
- V2: 4th ICS along the LEFT margin of the sternum
- V4: 5th ICS, mid-clavicular line
- V3: midway between V2 and V4
- V5: 5th ICS, anterior axillary line (same level as V4)
- V6: 5th ICS, mid-axillary line (same level as V4)
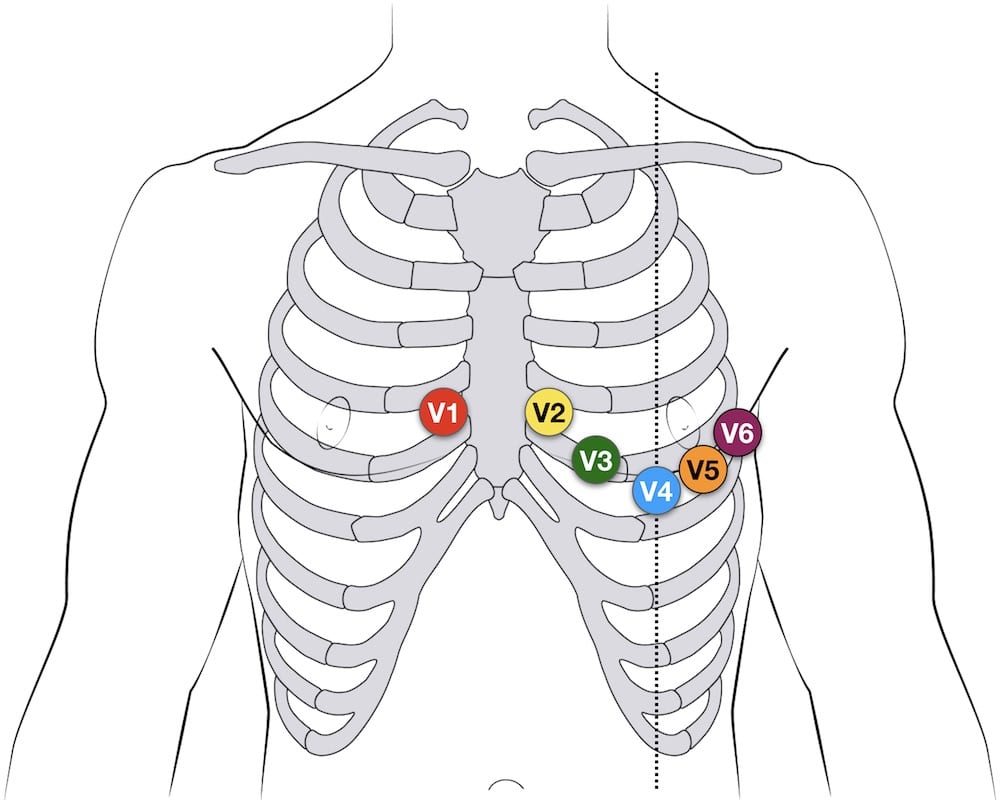
A 12-lead ECG paints a complete picture of the heart's electrical activity by recording information through 12 different perspectives. Think of it as 12 different points of view of an object woven together to create a cohesive story - the ECG interpretation.
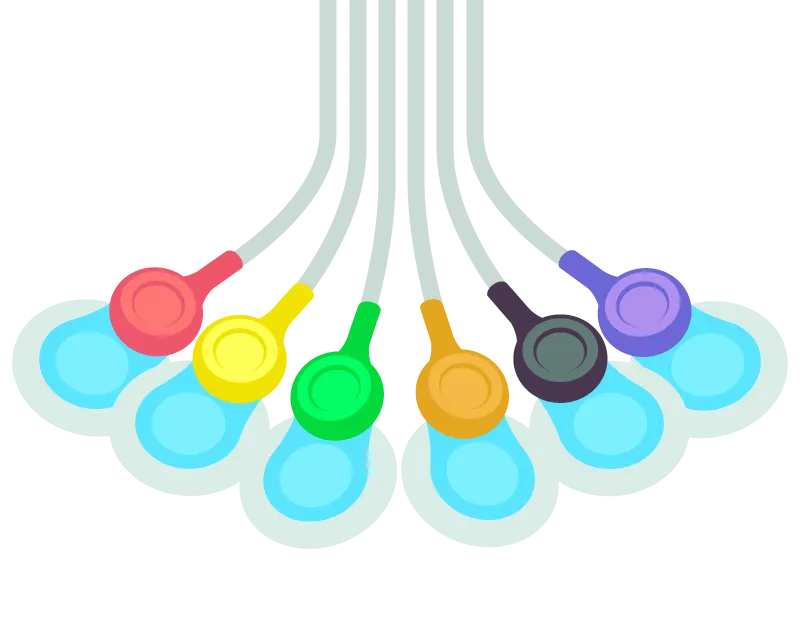
These 12 views are collected by placing electrodes or small, sticky patches on the chest (precordial), wrists, and ankles. These electrodes are connected to a machine that registers the heart's electrical activity.
Who Should Have a 12-Lead ECG
The main purpose of the 12-lead ECG is to screen patients for possible cardiac ischemia. It helps EMS and hospital staff to quickly identify patients who have STEMI (ST elevation myocardial infarction or in other words, heart attack) and perform appropriate medical intervention based on initial readings.
12-LEAD ECG ELECTRODE PLACEMENT
To measure the heart's electrical activity accurately, proper electrode placement is crucial.
In a 12-lead ECG, there are 12 leads calculated using 10 electrodes.
Chest (Precordial) Electrodes and Placement
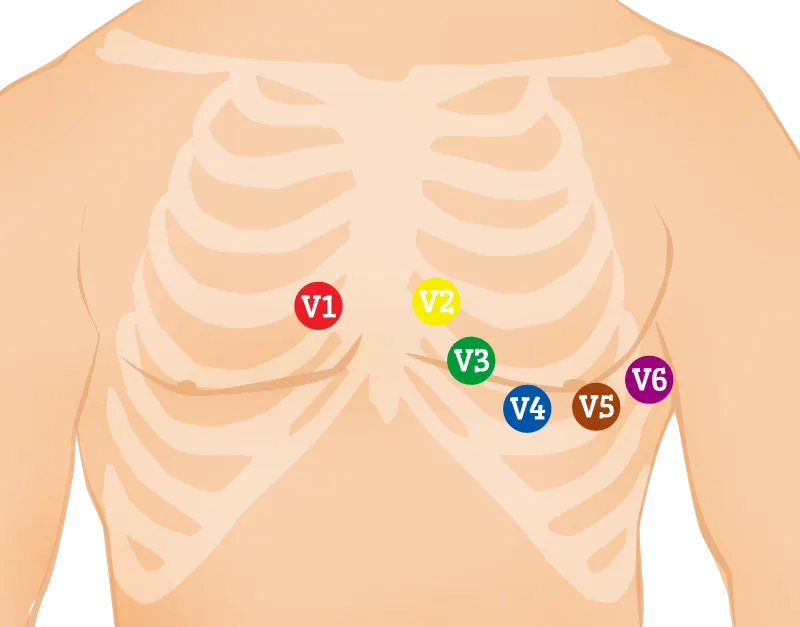
» V1 - Fourth intercostal space on the right sternum
» V2 - Fourth intercostal space at the left sternum
» V3 - Midway between placement of V2 and V4
» V4 - Fifth intercostal space at the midclavicular line
» V5 - Anterior axillary line on the same horizontal level as V4
» V6 - Mid-axillary line on the same horizontal level as V4 and V5
Limb (Extremity) Electrodes and Placement
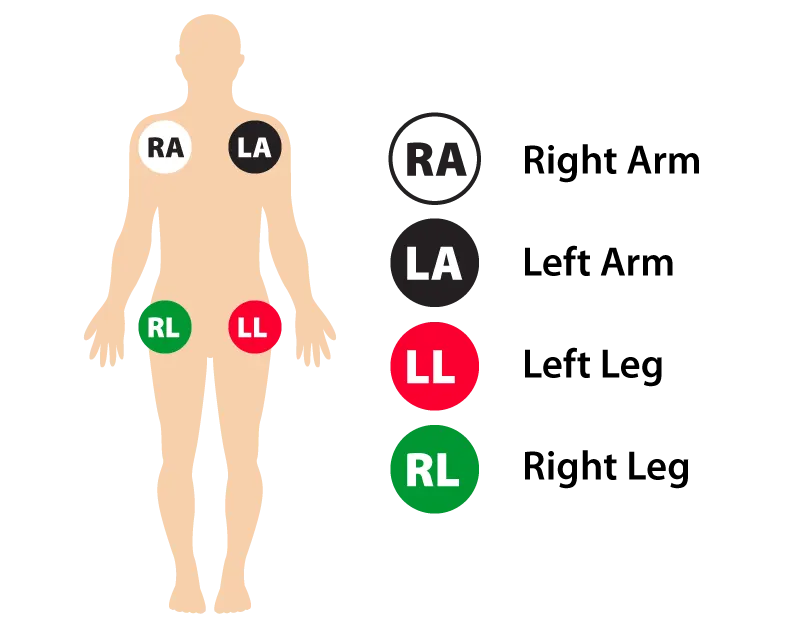
» RA (Right Arm) - Anywhere between the right shoulder and right elbow
» RL (Right Leg) - Anywhere below the right torso and above the right ankle
» LA(Left Arm) - Anywhere between the left shoulder and the left elbow
» LL (Left Leg) - Anywhere below the left torso and above the left ankle
Additional notes on 12-lead ECG Placement:
- The limb leads can also be placed on the upper arms and thighs. However, there should be uniformity in your placement. For instance, do not attach an electrode on the right wrist and one on the left upper arm.
- For female patients, place leads V3-V6 under the left breast.
- Do not use nipples as reference points in placing electrodes for both men and women as nipple locations vary from one person to another.
THE 12 LEAD GROUPS
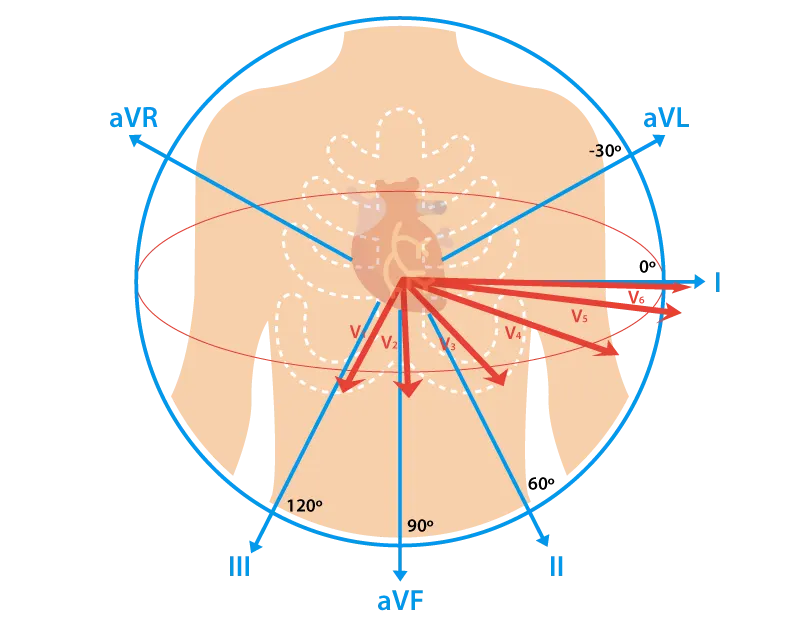
A lead is a glimpse of the electrical activity of the heart from a particular angle.
Put simply, a lead is like a perspective. In 12-lead ECG, there are 10 electrodes providing 12 perspectives of the heart's activity using different angles through two electrical planes - vertical and horizontal planes.
Vertical plane (Frontal Leads):
By using 4 limb electrodes, you get 6 frontal leads that provide information about the heart's vertical plane:
- Lead I
- Lead II
- Lead III
- Augmented Vector Right (aVR)
- Augmented Vector Left (aVL)
- Augmented vector foot (aVF)
Leads I, II, and III require a negative and positive electrode (bipolarity) for monitoring. On the other hand, the augmented leads-aVR, aVL, and aVF-are unipolar and requires only a positive electrode for monitoring.
Einthoven's Triangle
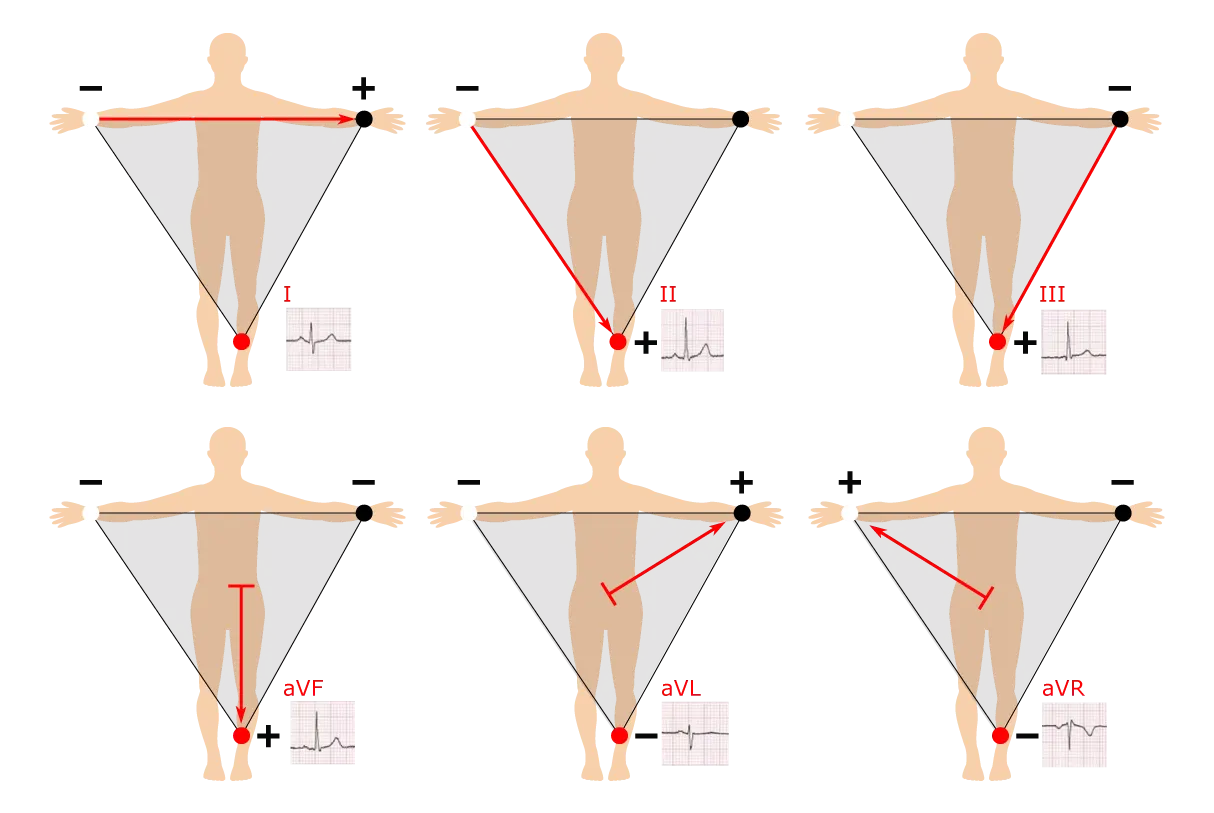
The Einthoven's triangle explains why there are 6 frontal leads when there are just 4 limb electrodes.
The principle behind Einthoven's triangle describes how electrodes RA, LA and LL do not only record the electrical activity of the heart in relation to themselves through the aVR, aVL and aVF leads. They also correspond with each other to form leads I (RA to LA), II (RA to LL) and III (LL to LA).
As a result, they form an equilateral triangle. Hence it's called the Einthoven's triangle, named after Willem Einthoven who invented the first practical ECG.
Keep in mind that RL is neutral (also known as point zero where the electrical current is measured). RL doesn't come up in ECG readings, and is considered as a grounding lead that helps minimize ECG artifact.
Horizontal Plane (Transverse Leads)
By using 6 chest electrodes, you get 6 transverse leads that provide information about the heart's horizontal plane: V1, V2, V3, V4, V5, and V6.
Like the augmented leads, the transverse leads are unipolar and requires only a positive electrode. The negative pole of all 6 leads is found at the center of the heart. This is calculated with the ECG.
Patient Positioning for 12-Lead ECG Placement
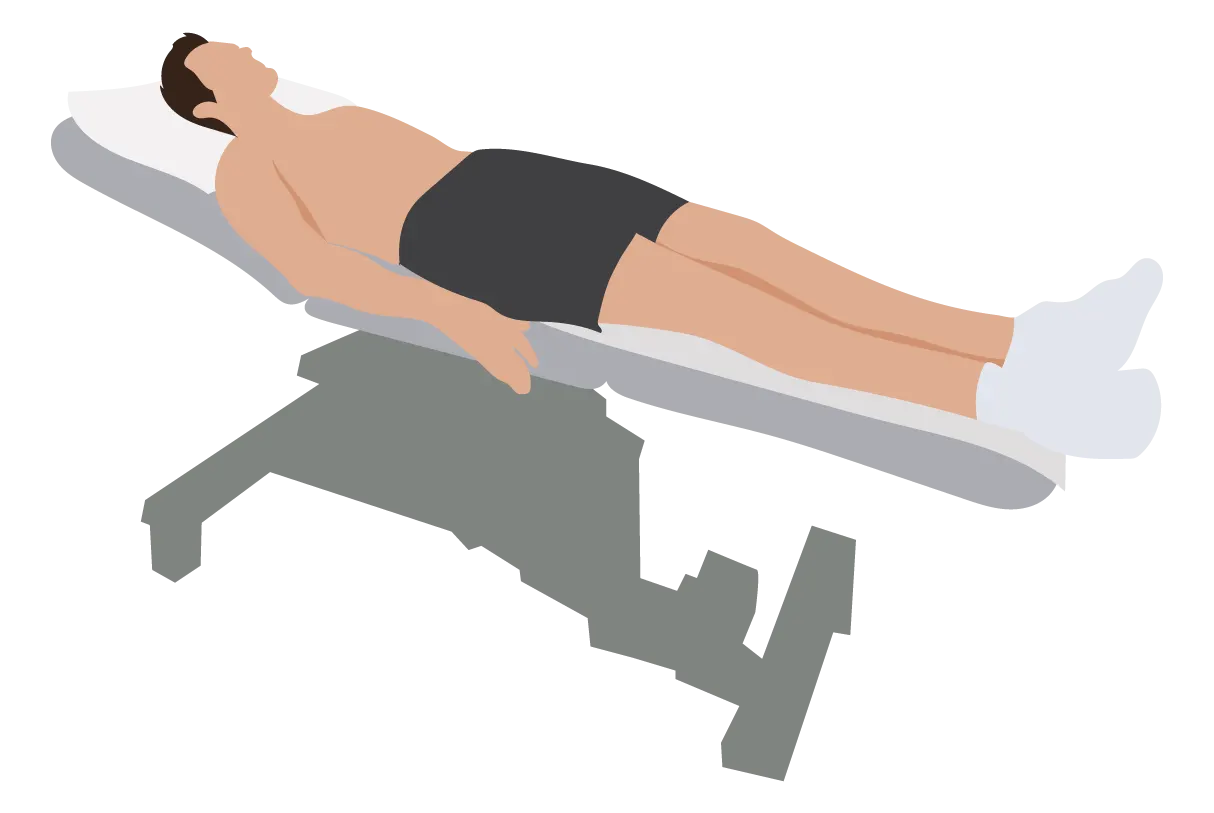
- Ensure that electronic devices (e.g. smartphone) are removed from the patient. These devices can produce artifact (interference) and cause problems with the readings.
- Place patient in supine or Semi-Fowler's position. If both positions are impossible, you can perform ECG with the patient in a more elevated position.
- With arms lying flat on the side, ask the patient to relax the shoulders and keep the legs uncrossed.
- For patients that do not fit comfortably on the bed or exam table due to size, ask them to cross their arms on their stomach to reduce muscle tension and movement.
- Unless you're performing a stress ECG test, ask the patient to lie still and quietly until the test is done.
HOW TO REDUCE SIGNIFICANT ARTIFACT
A slight ECG artifact is not uncommon. However, you can reduce further interference through the following steps:
- Switch off non-essential electrical devices and equipment within the vicinity if possible.
- Check for cable loops and avoid running cables adjacent to metallic objects as they can affect the signal.
- Inspect wires and cables for cracks or breaks. Replace as needed.
- If possible, use surge suppressors with the power supply.
- Ensure that filters and preamplifiers are appropriately adjusted.
- Ensure securely connection between patient cable and the ECG device. Double check for gaps between connectors.
SKIN PREPARATION
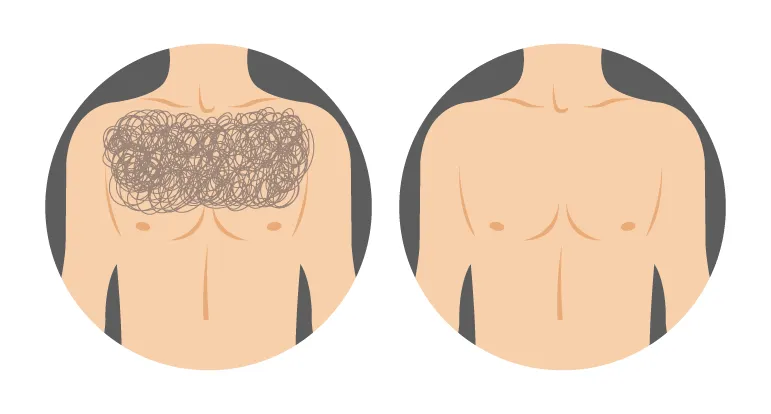
- Skin should be dry, hairless, and oil-free. Shave hair that can possibly impede electrode placement. Electrodes should have full contact with the patient's skin.
- For better electrode adhesion and oil-free skin, rub the area with an alcohol prep pad or gauze paid with benzoin tincture.
- Reduce electrical resistance minus the skin redness with 5 to 10 gentle strokes. This will help ensure that the heart's electrical signals are transmitted to the electrodes.
- Promote an environment that prevents the patient from sweating profusely.
ELECTRODE APPLICATION
Exact placement of each electrode on the patient is important. Incorrect placement can lead to false or misleading diagnosis.
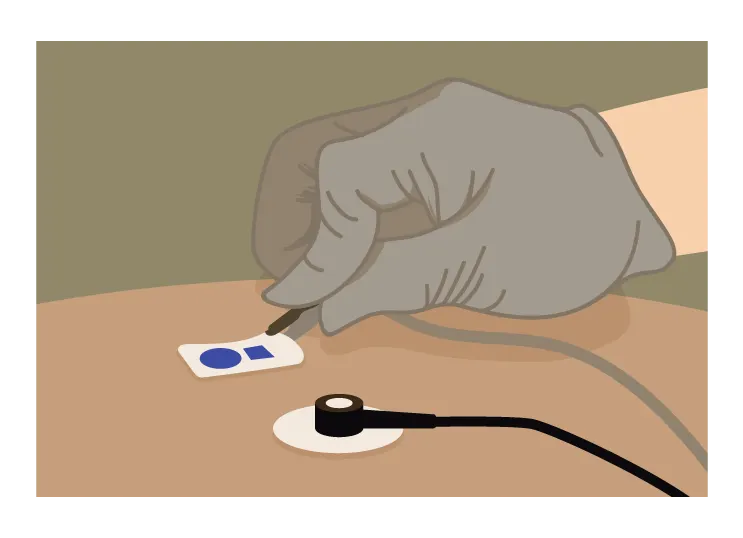
- Make sure the electrode conducting gel is fresh and adequately moist. A dry electrode with inadequate gel reduces the conduction of the ECG signal.
- Often, electrode gel dry-out is a result of incorrect storage. Store electrodes as instructed by manufacturer and do not remove from their pouch until they're ready for use.
- Do not place electrodes on skin over bones, incisions, irritated skin, and body parts where there is lots of possible muscle movement.
- Use electrodes of the same brand. Using different brands with dissimilar composition can hinder an accurate ECG trace.
ECG Variations
Apart from the standard 12-lead ECG, other variants include:
3-Lead ECG
A 3-Lead ECG uses 3 electrodes that are labeled white, black, and red. These colors are not universal as two coloring standards exist for the ECG (discussed below). These 3 leads monitor rhythm monitoring but doesn't reveal sufficient information on ST elevation activity.
5-Lead ECG
A 5-Lead ECG uses 4 limb leads and 1 chest lead. It helps improve ST elevation readings but it's still inferior to the 12-lead ECG.
Transducer
The output signal is galvanically isolated from the input signal and the power supply.
P30H has programmable measurement and additional functions.
Programming parameters can be realized with the use of buttons, via RS-485 interface and free e-con software or Ethernet or any web browsers.
Transducer is available in 3 versions:
- basic,
- with SD/SDHC card,
- with Ethernet and internal file system memory.
Features and functions:
- Programmable input
- DC parameters
- current via shunts +/- 150mV
- voltage 0...12/48/100/250V or 0...600/1000V with additional resistor
- Output:
- 1 x analog 0/4...20mA or 0...10V
- 1 x relay, optionally changeable to CANopen output or to 0/4...20mA or 0...10V analog output
- 1 x additional relay, optionally changeable to 0...24V d.c. supply output
- LCD 2 x 8 characters with LED backlight
- Supply: 85..253 V a.c./d.c. or 20...40 V a.c./d.c., / 20...60 V d.c.
- Conversion of measured values into an output signal on the base of the individual linear characteristic
- 1 or 2 alarm relays with NO contact operating in 6 modes
- Additional supplying output 24 V d.c 30 mA switched-on/switched-off (optional).
- Recording of input signals in internal file, on SD/SDHC card (optional) or internal file system memory (optional).
- Interface RS-485 Modbus RTU.
- RS-485 Master/Monitor mode – possibility to poll 1 device
- Protocol CANopen (optional)
- SD/SDHC support (optional).
- Interface Ethernet 10/100 BASE-T (optional).
- Protocol: Modbus TCP/IP, HTTP, FTP.
- Services: www server, ft p server, client DHCP
- Dimension: 45 x 120 x 100mm.
Stages of Processing
The medical device development process requires specific stages to be followed to ensure design control so that the product is both effective and safe for use. As a result, this covers the entire product development cycle, from medical device design to clinical trials, and risk management to manufacture.
The FDA, for example, set out five stages for processing medical devices to prepare them for market. These stages form their quality system regulation (QSR), which governs “the methods used in, and the facilities and controls used for, the design, manufacture, packaging, labelling, storage, installation, and servicing of all finished devices intended for human use.”
The FDA stages are:
- Initiation - opportunity and risk analysis
- Formulation - concept and feasibility analysis
- Design and development, including verification and validation to ensure the design output matches the specified design input
- Final validation and product launch preparation
- Product launch and postlaunch assessment
How long does it take to Develop a Medical Device?
Developing and gaining approval for a new medical device is not a fast process and can take many months or even years depending on the type of device being developed. Studies show that it takes three to seven years to bring a device from concept to approval. This may seem like a long time, but it includes the entire device lifecycle, including research, development and testing.
The FDA provide guidelines for the time to gain approval to bring different classes of device to market:
Class 1 Devices
These are the quickest devices to gain FDA approval for and include items such as tongue depressors, oxygen masks and electric toothbrushes. The majority of these non-invasive class 1 devices can be self-registered with the FDA and can be completed in as little as one week.
Class 2 Devices
Class 2 devices have a moderate risk associated with them and include items such as contact lenses, catheters and syringes. 43% of devices fall under this category and need a manufacturer needs to be able to prove device safety and efficacy through substantial comparison to another approved device. The FDA will provide receipt of a submission for approval within 60 days, but the average time to receive clearance is 177 days (nearly six months), with just 19% being cleared within three months. However, the time for clearance can also vary depending on the type of device being submitted. Anaesthesiology devices have the longest average time to approval, at 245 days, while toxicology devices are the shortest with an average of 163 days.
Class 3 Devices
These devices are the most invasive and pose the highest risk to patients. Class three devices account for around 10% of products and include items such as cochlear implants, defibrillators, and implanted prostheses. They also require the most stringent checks during the development process in order to attain approval. The FDA requires adequate scientific evidence to show safety and efficacy of these products. The average time for approval is 243 days after submission, which is just over eight months. This waiting time has been significantly reduced in recent years, as prior to 2010, this wait was an average of 345 days.
How much does it Cost to Develop a Medical Device?
The exact costs associated with developing a medical device will vary according to what is being developed. There are clear differences in complexity for a tongue depressor and a defibrillator, and this will be reflected in the relative development costs.
Furthermore, it is very difficult to skip any of the iterative development, design and testing stages in order to save costs. A device manufacturer will need to be able to show technology, industrial design, safety, usability, proof of concept, manufacturability, packaging concepts and many other factors before reaching the marketplace.
Although it is difficult to put an exact figure on medical device development, research has shown that the total funding costs for a Class 2 medical device is around $30 million, of which development and engineering makes up $2-5 million.
Does a Medical Device need FDA Approval?
All medical devices that are manufactured, repackaged, relabelled or imported for sale in the United States need some level of FDA approval.
The FDA’s ‘Center for Devices and Radiological Health’ are responsible for regulating these products as well as medical and non-medical radiation-emitting electronic products such as lasers, x-ray systems, ultrasound equipment, microwave ovens and even colour televisions.
The required level of regulatory control increases with each class of medical device, from one to three. Most class one devices do not require Premarket Notification 510(k); most class two devices require Premarket Notification 510(k); and most class three devices require Premarket Approval.
In each case, a submission needs to be made to the FDA, increasing in complexity with each class. As a result, the time to gain approval will also increase from days to months.
Risk and safety
The task of developing medical devices that are safe boils down to identifying risks and then establishing the measures that give the confidence to say the risks are acceptable. Developers must judge the severity of potential harm and the probability that the harm occurs. Once developers have identified the unacceptable risks, their next step is to define safety measures to mitigate them.
For example, consider the case of an infusion pump. Its main function is to pump fluid. Potential hazards related to the pumping function include a wrong flow rate, infusing the wrong volume, an unintended start or stop of infusion, a buildup of excessive pressure, an infusion of air, and a reverse in the direction of flow. Designers would consider all these factors during development so the device could cause no harm in the case of a breakdown.
Fortunately there are standards that provide guidance on safety. The IEC 60601-1-2-24 pertains specifically to infusion pumps. Other standards pertain to other kinds of widely used medical equipment. An example is IEC 60601-2-16, which pertains to dialysis equipment. But, as stated before, standards aren’t enough to make devices safe. Designers must also conduct a formal risk analysis to determine requirements for the design of the device.
In that regard, ISO 14971 is a standard that details how manufacturers should conduct risk management to determine the safety of a medical device during the product life cycle. Such activity is required by higher level regulations and other quality standards such as ISO 13485.
The main standard for medical-device safety is IEC 60601-1 – Medical electrical equipment – Part 1: General requirements for basic safety and essential performance. Some countries also deviate from the standard under certain circumstances and sometimes use different versions of it. For example, the European and Canadian versions of the standard are identical to the IEC standard, but the U.S. version of the standard (ANSI/AAMI HA60601-1-11) excludes nursing homes from coverage. It also emphasizes usability requirements. Devices typically mandated to use the new standard include oxygen concentrators, body-worn nerve and muscle stimulators, beds, sleep-apnea monitors, and associated battery chargers prescribed for use at home.
One of the principles of IEC 60601-1 is that a medical device must be safe in the case of a single fault. It defines a single fault as a failure of a safety system. Thus, one facet of designing a safe device is to imagine how a first failure in a safety system could endanger the patient, and then implement a safety system that still makes the device safe even in the event of a first failure.
One complicating factor is that the safety system has its own reliability level. Developers must establish what this level is. One approach to make safety systems reliable is to either use two redundant safety systems or use one system that is tested periodically to see if it is still functioning.

The basic approach is to go through every component in the device and figure out what happens if it fails. Each possible failure is acceptable if it is obvious and an operator can stop operations before the device can harm someone. For example, assume a safety system fails but the device continues to function properly. Designers must anticipate what happens in the event of a second safety-system failure after a certain time. When the safety system fails silently it no longer protects; still, the patient must be safe.
In the same vein, failures can be either systematic or random. Systematic failures are basically built-in design flaws. Examples include errors in the PCB layout, components used outside their specification, or unanticipated environmental conditions.
All software bugs are systematic failures; there are no random software failures. The effect of software failures might be random. For example, when a programmer doesn’t initialize a variable, its content on first use is random. This can cause a random effect at power on. The fact that the variable is not initialized is a systematic failure. Other examples of systematic failures in software include errors in the software specification, and errors in the operating system or compiler. Systematic errors in both hardware and software can be prevented through use of a robust development process.
Random errors, on the other hand, happen even though the design is correct and production is flawless. Random hardware errors can’t be predicted individually, they can only be described statistically. The general approach to controlling random errors is with redundant features or by adding self-testing or by adding a safety system that reacts in the event of a random failure. (Readers should note that a failure of a software storage medium is, in fact, a hardware and not a software error.)
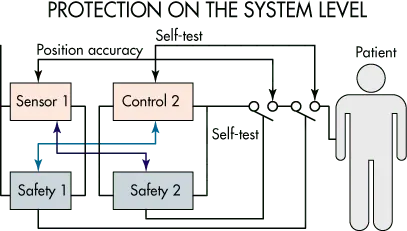
Designers typically use both redundancy and diversity as safety features. Redundancy is simply duplicating the same feature while diversity is the use of two different methods to deliver the same function. (The classic example is that of a seat belt and airbag protecting a car occupant from hitting the dashboard.) Diversity protects against random hardware errors as well as against some systematic failures. Redundancy, on the other hand, protects only against random hardware failures.

One of the questions that designers must decide is how much protection they must build in against random hardware failures. The answer depends on such factors as whether a first failure is a hazard and whether designers should assume there is a possibility of a second, third, or even more numerous failures. The main logic here is that hazards potentially able to kill multiple people at one strike demand more attention. The potential for harm will give guidance on how many independent failures designers must consider in the lifetime of the device. The potential for harm also determines the amount of redundant/diverse safety systems necessary. Normally medical devices kill one person, so designers must consider a maximum of two independent failures.
In general, designers must consider the possibility of ever-more unlikely events, the higher the risk of harm. For electrical medical devices, the IEC 60601-1 standard specifies that a combination of two independent failures should not be life threatening. This mandate expresses the concept of the single fault condition for medical devices. The principle is that a first failure should not cause a hazard. If the first failure is obvious to the operator, the operator stops using it and has it repaired. If the first failure can’t be detected, the designers must assume that a second failure will arise sometime later. They must also arrange the design so a combination of the first and second failures won’t cause a hazard.
Unfortunately the term “single-fault condition” can be misleading in the context of medical safety standards. It can suggest that designers need only assume that the device experiences only one failure. This is not correct.
Usually there is a time period after the first failure where the combination of a first and second failure is not allowed to be a hazard. For example, suppose the safety system has a first failure and undergoes a self-check within 24 hr that reveals the safety system is dead. That level of safety is acceptable in many medical systems. The assumption is that two independent safety-system failures would not arise within 24 hr of each other. Conversely, there is an unacceptable level of hazard if there is no self-check in the 24 hr after the first failure. In this case, the device either needs a self-check routine or a second safety system.
There is a progressive procedure for analyzing each hardware failure that could be dangerous. It is a risk graph spelled out in the IEC 61508 standard. It categorizes each fault condition in terms of a specific safety integrity level or SIL. Designers usually start by dividing risk consequences into four categories ranging from minor injury, serious injury, several deaths, and many deaths. They further subdivide risks according to the amount of exposure time to the hazard and the possibility of avoiding the hazardous event. Finally, they categorize the probability of the unwanted occurrence as very small, small, or relatively high.
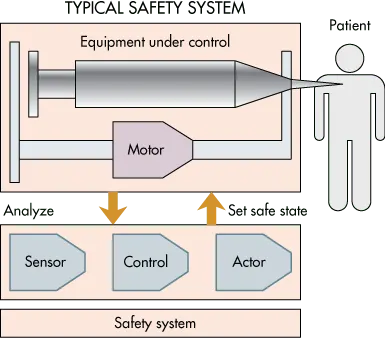
Designers often start the safety analysis with a functional diagram of the product. This is an appropriate starting point because it’s possible to build in a high degree of safety on the level of system architecture. Designers typically treat each function as a black box. They then try to determine whether or not a specific black box is safe, or if it can be made safe by the introduction of safety systems. When they can’t determine the safety of a black box, they then open the box and go deeper, perhaps down to the level of individual components.
Fortunately designers in the U.S. need not rely on their own analysis of product functions to note safety red flags. The U.S. FDA maintains a market surveillance system that can give designers a heads-up on potential problem areas in medical devices. Any time a medical device has a failure, the manufacturer must report the details to the FDA. Alarms are raised if a specific device has a failure rate exceeding a certain threshold. Thus, medical-device engineers can consult this database to see what kinds of failures similar devices are experiencing.
Other countries have similar databases of medical device failures. However, their data tends to be less useful than that in the U.S. simply because individual countries each collect their own information. There is no central repository as yet for tabulating worldwide results.
The safety of software
Software for medical devices has its own standard, IEC 62304. It specifies life-cycle requirements for the development of medical software and software within medical devices. The standard spells out a risk-based decision model and defines testing requirements.
The primary principle for verifying software is to describe the function it is supposed to perform, then devise a test that verifies the software works as planned. The key lies in devising a test that is specific enough to identify all functions.

Unfortunately, the U.S. medical-device industry is not as advanced as it should be when it comes to implementing such procedures. In many cases, software descriptions tend to be ambiguous, and this condition causes several harmful side effects. For example, software engineers may develop something that has unintended functions. Equally bad, poor descriptions often prevent designers from devising all the tests that will expose harmful software bugs.
Additionally, many software engineers seem to have a too-high opinion of their own work. They seem to forget that numerous studies have shown software developers typically create between five and 10 bugs daily, a statistic that illustrates why an accurate description of software functions is essential.
Software-safety analysis frequently employs a so-called V-model that is analogous to that widely used for visualizing the progression of system-development tasks. The model is named for its graphic depiction of how designers should decompose software requirements into ever-more-detailed specifications, then test and validate from the detailed levels up through to the system level.
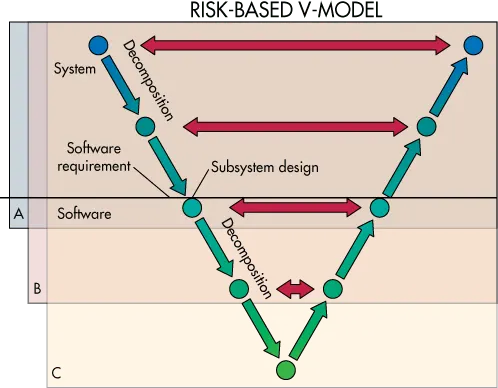
Most V-models divide decomposition steps into three levels. Top level is termed the system level. The lowest level represents the smallest software unit that can be 100% tested. The V-model represents the principle that designers must clearly describe software tasks in several levels of detail. There must be tests at every level that check that the software delivers its intended functions and identifies any bugs.
The software risk model defines three different levels of safety. Level A software is nonharmful if it fails. Level C software that fails can injure or kill someone. If software is neither A nor C, then it is level B by default. Categorizing software into one of the three levels helps determine how much testing is appropriate. Level A software just needs a system test. Level B tests must be detailed enough to check individual software modules. And as you might expect, most safety-system software in medical devices is at level C, which tests subsets of software code at the unit level.
The human element
It is no secret that appliances and instrumentation of all kinds are getting more complicated to operate. And medical instrumentation that is complicated is also prone to operator errors with potentially tragic consequences. Complicated instrumentation puts a demand on the operator’s intellectual ability. But users aren’t getting cleverer.
Unfortunately, standards for human-factor usability aren’t well developed. For example, one such document is IEC 62366 Annex D 1.4. It is weak in that it only supplies general guidelines about the steps necessary to identify risks of usage problems. It basically requires designers to analyze how users will interact with the device and implement risk-mitigating measures to avoid erroneous usage.
It can be quite expensive for manufacturers to analyze the ergonomics and usage of their equipment. One widely used technique is to round up 10 users, then ask them to say out loud what they are thinking as they operate the device. The whole set of interactions get recorded on video.
A typical finding in sessions like this is that only about 10% of instrument functions get used daily. The other 90% get used rarely or not at all. But it is not unusual to find often-used features buried in complicated menu structures with a huge potential for accidentally making an error.
However, there is no standard that requires an ergonomic analysis or user studies. These practices are simply recommended practices among firms that have experience developing medical equipment.
There is a difference between medical device test equipment calibration and maintenance activities. Maintenance removes fault in a device, whereas calibration helps to detect the defective instrument that has failed to output values according to the manufacturer’s standard baseline readings.
The calibration activity varies from instrument to instrument. The manufacturer, in most cases, provides a built-in system for performing calibration processes. The manufacturer also recommends calibration frequency, although the user itself can devise its frequency, depending on the instrument application and frequency of use.
Every device has its tolerance limit, as defined by the manufacturer.
If the testing device’s calibration results fall within the tolerance limit, the device can be used further. On the other hand, if the calibration fails the device cannot be used for any process.
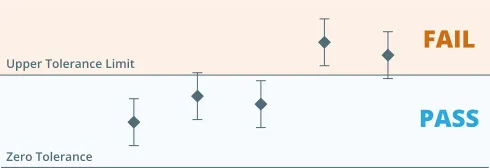
Corrective actions are required for devices that fail the calibration.
Such actions can either be performed in-house or the device can be sent to device specialists. Upon successful corrective actions, the device is again calibrated for verification. If results are satisfactory, the device is allowed to be used again. However, if the defect cannot be fixed, the instrument is permanently damaged and cannot be used further.
The calibration cycle is followed by complete documentation.
Common documentation includes:
- Calibration Plan, divided into monthly, quarterly, and yearly basis
- Calibration steps or a Standard Operating Procedure (SOP)
- Calibration Results Sheet indicating the actual results and tolerance limits
Calibration status is also indicated on the device, showing the calibration status, date of calibration, and next due date for calibration.
For example, MRI scanners are regularly calibrated for different sections, including the Imaging Gradients. It allows to keep the imaging output according to standard measurements and helps to accurately detect any changes in tissue structure up to the microscopic level.
Equipment Calibration Related Regulations and Standards
The Medical Device Industry is strictly regulated by regulatory bodies such as Food and Drug Administration (FDA) in the United States to make them compliant with the regulations. Additionally, standardization bodies such as the International Organization for Standardization (ISO) also provide standards for performing medical device calibration.
Some common regulations and standards for medical device companies include the following.
FDA 21 CFR Parts 11
The FDA 21 CFR Part 11 is the FDA’s guidance regarding electronically saved records. Electronic records act as an alternative to manual records. Compliance with this act makes the manufacturer’s electronic records trustworthy.
This regulation also guides electronic signatures, an alternative to manual signatures. However, this regulation does not apply to the electronic records transmitted by electronic means.
FDA 21 CFR Parts 820
The FDA 21 CFR Part 820 is the FDA’s Quality System Regulation for production and process control of medical devices. This regulation allows manufacturers to provide valid inspection and test equipment results by establishing routine calibration procedures.
This regulation also bounds manufacturers to handle all medical devices so as not to harm their accuracy.
Quality System Regulation (QSR)
Quality System Regulation (QSR) is the FDA’s quality policy for medical device manufacturers, similar to the Current Good Manufacturing Practices (cGMP) for Food, Drugs, and Biologics. The QSR only applies to finished medical devices that are ready to be used.
The QSR does not target any particular medical device but provides flexible guidelines to cover all medical devices. QSR puts the responsibility on the manufacturer to develop and establish their quality policies in light of QSR guidelines.
ISO 13485:2016
ISO 13485 is a standard for medical device manufacturers developed by the International Organization for Standardization (ISO). It was reviewed and updated in the year 2016. The number 2016 comes with its terminology.
ISO 13485:2016 is the set of requirements for a Quality Management System (QMS) in the medical device industry.
This standard covers all life cycle stages of the medical device, including manufacturing, storage, distribution, installation, and servicing.
Recommended Reading: Medical Device Quality Management System (QMS)
Why is Medical Device Test Equipment Calibration Important?
Medical devices can drift away from the measurements due to their internal components. This phenomenon is common among all manufacturers, even with the most advanced ones. Over time, the internal components – both mechanical and electronics wear and tear. As a result, their performance starts to decrease and results in erratic readings. These erratic readings can directly affect the patient life, such as in the case of ultrasound units.
Secondly, as mentioned above, regulatory bodies such as the FDA in the US have made it mandatory for the manufacturers to perform routine calibration and maintain calibration records. Otherwise, the manufacturer is not granted accreditation and is not allowed to start or continue its operations.
The calibration process is necessary to detect these erratic readings and comply with the regional regulatory bodies. The calibration must be regularly performed, and documentation maintained for presenting during a routine inspection.
Medical Equipment Calibration Requirements
The calibration is critical in the medical device industry and must be performed according to regulatory requirements.
Considering its importance and significance, manufacturers prefer to dedicate separate resources for calibration activity such as:
- Establishing a department
- Hiring skilled personnel
- Implementing an Equipment Calibration Management Software
- Maintaining instruments to perform calibration
Common requirements for calibration, as per the FDA 21 CFR Parts 820, section – 820.72 “Inspection, measuring, and test equipment”, are summarized below.
Procedures and Instructions
It is the manufacturer’s responsibility to develop procedures for regular calibration of each device. The procedure should contain tolerance limits that help in qualifying instruments (fail or pass). In case the device calibration fails, the procedures should guide how to meet the acceptable limit.
Secondly, procedures should document what to do if the device completely fails the calibration.
For example, if a department replaces a device due to fault, it cannot use the new device without calibration and verification from relevant departments such as the Quality Assurance Department. In this scenario, the procedure for a new device calibration is required and should be developed by the device user department. The procedure should also contain steps to replace and update the relevant documents.
Regulatory Standards
This includes the applicable standards for performing routine equipment calibration. The calibration standards should be traceable to national and international standards such as the ISO 13485:2016.
In the absence of available standards, the manufacturer shall establish its own, in-house standards.
Documentation and Records
The calibration activities must be documented and calibrations record well-maintained. A proper calibration plan should be in place, indicating each device’s calibration frequency, i.e., weekly, monthly, quarterly, or yearly. All the calibration records should be readily available during an inspection.
The calibration records should contain the following information:
- Equipment identification number
- The date when calibration was performed
- Name of the person performing the calibration
- The due date for the next calibration
In addition to records, the calibration status or tag should be indicated on the individual device, including the calibration date, the next calibration due date, and the name of the person performing the calibration.
A software solution such as SimplerQMS can help you schedule each device’s calibration frequency and remind you when it’s time for the next calibration.
The software is 21 CFR Part 11 compliant and allows you to sign calibration records with 21 CFR Part 11 compliant electronic signatures.
Training of Personnel
These include training methods for the personnel involved in calibration activities, including the instructions on how to handle and store the calibrated devices.
The manufacturer is responsible for conducting training for the personnel involved in calibration activities. Therefore, a proper training calendar and a training plan must be in place.
All training activities must be recorded and maintained, including the topic details, attendance sheet, and trainer details.
For example, the training plan for the instrument calibration can include the following:
- The personnel must be trained to use the master instrument according to standard specifications.
- The personnel must understand the instrument’s operational requirements, such as power or utility for normal operation.
- The personnel must be trained to establish a safe and secure connection between the master and calibrating instrument.
- The personnel must be trained about the device being calibrated. It includes operational training, available functions and features of the device, and how it connects to the master instrument.
- The personnel must be trained about the relevant applicable standards and their requirements.
- The personnel must be trained to complete all the documentation correctly. It includes recording the observed values against the standard values, identifying tolerance levels. The personnel must indicate calibration status on the device according to approved formats such as tags.
How to Manage Medical Equipment Calibration Effectively
As mentioned above, calibration is of utmost importance for manufacturers when meeting compliance requirements. Regulatory bodies rely on the documentation developed by the manufacturer to decide whether or not the manufacturer has effectively established and followed calibration procedures.
First of all, all the documents should be readily available for inspection by the regulatory bodies. If not produced timely, the regulatory body can assume that the calibration was not performed. The documents should be up-to-date and follow the approved calibration plan. The records for defective devices should not be included, and they must be separated from the supported devices.
An effective way of managing calibration activities is by using digital solutions such as Equipment Calibration Management Software by SimplerQMS. SimplerQMS software solution is compliant with FDA 21 CFR Parts 11, FDA 21 CFR Parts 820, Quality System Regulation (QSR), ISO 13485:2016.
It allows users to store all the calibration documents in a centralized system, in secured cloud-based storage. The system tracks the documentation status and automatically prompts email alerts to the responsible person to complete assignments.
Equipment Calibration Software by SimplerQMS allows you to create a calibration plan of the device, so you don’t need to inspect device by device ‘on the floor’ to plan the device calibration. The software automatically creates a complete equipment calibration log that can easily be presented during audits or inspections.
The system follows the calibration schedule and automatically alerts the responsible person when calibration is due for a particular device. This prevents you from missing the calibration for a particular device, as missed calibration can seriously cause regulatory non-conformance.
8. Objective
We sought to develop an intensive care unit research database applying automated techniques to aggregate high-resolution diagnostic and therapeutic data from a large, diverse population of adult intensive care unit patients. This freely available database is intended to support epidemiologic research in critical care medicine and serve as a resource to evaluate new clinical decision support and monitoring algorithms.
Design
Data collection and retrospective analysis.
Setting
All adult intensive care units (medical intensive care unit, surgical intensive care unit, cardiac care unit, cardiac surgery recovery unit) at a tertiary care hospital.
Patients
Adult patients admitted to intensive care units between 2001 and 2007.
Interventions
None.
Measurements and Main Results
The Multiparameter Intelligent Monitoring in Intensive Care II (MIMIC-II) database consists of 25,328 intensive care unit stays. The investigators collected detailed information about intensive care unit patient stays, including laboratory data, therapeutic intervention profiles such as vasoactive medication drip rates and ventilator settings, nursing progress notes, discharge summaries, radiology reports, provider order entry data, International Classification of Diseases, 9th Revision codes, and, for a subset of patients, high-resolution vital sign trends and waveforms. Data were automatically deidentified to comply with Health Insurance Portability and Accountability Act standards and integrated with relational database software to create electronic intensive care unit records for each patient stay. The data were made freely available in February 2010 through the Internet along with a detailed user’s guide and an assortment of data processing tools. The overall hospital mortality rate was 11.7%, which varied by critical care unit. The median intensive care unit length of stay was 2.2 days (interquartile range, 1.1–4.4 days). According to the primary International Classification of Diseases, 9th Revision codes, the following disease categories each comprised at least 5% of the case records: diseases of the circulatory system (39.1%); trauma (10.2%); diseases of the digestive system (9.7%); pulmonary diseases (9.0%); infectious diseases (7.0%); and neoplasms (6.8%).
MATERIALS AND METHODS
This study was approved by the Institutional Review Boards of Beth Israel Deaconess Medical Center (Boston, MA) and the Massachusetts Institute of Technology (Cambridge, MA). Requirement for individual patient consent was waived because the study did not impact clinical care and all protected health information was deidentified.
Patient Population
This first release of the MIMIC-II database encompasses virtually all adult patients admitted to ICUs at Boston’s Beth Israel Deaconess Medical Center during the period 2001–2007; additional MIMIC-II data collection is ongoing. Boston’s Beth Israel Deaconess Medical Center is a 620-bed tertiary academic medical center in Boston and a level I trauma center with 77 critical care beds. The ICUs are closed with 24-hr inhouse intensivist supervision of patient care. These ICUs include the medical, surgical, coronary, and cardiac surgery recovery care units. ICU stays separated by >24 hrs were counted separately even if they occurred within the same hospital stay.
Database Development
The data acquisition process was not visible to staff and did not interfere with the clinical care of patients or methods of monitoring. Two categories of data were collected: clinical data, which were aggregated from ICU information systems and hospital archives, and high-resolution physiological data (waveforms and time series of derived physiological measurements) that were obtained from bedside monitors.
Clinical Data
Clinical data were obtained from the CareVue Clinical Information System (models M2331A and M1215A; Philips Health-care, Andover, MA) deployed in all the study ICUs as well as from hospital electronic archives (Table 1). The data included such items as time-stamped nurse-verified physiological measurements (eg, hourly documentation of heart rate, arterial blood pressure, pulmonary artery pressure, etc); nurses’ and respiratory therapists’ progress notes; continuous intravenous drip medications; fluid balances; patient demographics; interpretations of imaging studies; physician orders; discharge summaries; and International Classification of Diseases, 9th Revision (ICD-9) codes. Comprehensive diagnostic laboratory results (eg, blood chemistries, complete blood counts, arterial blood gases, microbiology results) were obtained from the patients’ entire hospital stay, including periods outside the ICU.
Table 1
Description of clinical data classesa
| Clinical Data Class | Description |
|---|---|
| General | Patient demographics, hospital admission and discharge dates, room tracking, code status, hospital death dates (in or out of the ICU), ICD-9 codes, etc |
| Physiological | Hourly nurse-verified vital signs (BP, HR, etc), SAPS, ventilator settings, etc |
| Clinical laboratory tests | Hematology, blood chemistries, ABGs, urinalysis, microbiology, etc |
| Medications | Detailed administration records of IV medications, provider order entry data |
| Fluid balance | Hourly and cumulative intake (solutions, blood, etc) and output (urine, estimated blood loss, etc) |
| Reports | Free text reports of imaging studies (x-ray, CT, MRI), 12-lead ECGs, echocardiograms, etc |
| Notes | Free text notes including nursing and respiratory therapist progress notes; physician hospital discharge summaries |
ICU, intensive care unit; ICD-9, International Classification of Diseases, 9th Revision; BP, blood pressure; HR, heart rate; SAPS, Simplified Acute Physiological Score; ABGs, arterial blood gases; IV, intravenous; CT, •••; MRI, •••; ECGs, electrocardiograms.
Physiological Data
Physiological data were obtained with the technical assistance of the monitoring system vendor. Patient monitors (Component Monitoring System Intellivue MP-70; Philips Healthcare) were located by every ICU patient bed. Each monitor acquired and digitized multiparameter physiological data; processed the signals to derive time series (trends) of clinical measures such as heart rate, blood pressures, and oxygen saturation, etc; and also produced bedside monitor alarms. Those data were all transmitted to a networked nursing central station within each ICU (M3155 Intellivue Information Center; Philips Healthcare). The physiological waveforms (such as electrocardiogram, blood pressures, pulse plethysmograms, respirations) were sampled at 125 Hz, and trend data were updated each minute. The data were subsequently stored temporarily in a central database server that typically supported several ICUs. A customized archiving agent, developed through collaboration with Philips Health-care, created permanent copies of the physiological data residing in central database servers. The data were physically transported from the hospital to the laboratory every 2 to 4 wks where they were deidentified, converted to an open source data format (6), and incorporated into the MIMIC II waveform database. Limited capacity and intermittent failures of the archiving agents restricted waveform collection to a fraction (15%) of the monitored ICU beds (Table 2). No attempt was made to assure that the ICU records with waveform/trend data were statistically representative of the database as a whole.
Table 2
MIMIC-II patient population by critical care unit
MIMIC-II, Multiparameter Intelligent Monitoring in Intensive Care II; MICU, medical ICU; SICU, surgical ICU; CSRU, cardiac surgery recovery unit; CCU, coronary care unit; ICU, intensive care unit; IQR, interquartile range; SAPS, Simplified Acute Physiological Score.
Database Merger and Postprocessing
The second stage in developing the MIMIC-II database involved significant data postprocessing and database organization to obtain integrated medical records for each patient. Across the hospital’s clinical databases, patients are identified by their unique Medical Record Numbers and their Encounter Numbers (the latter uniquely identifies a particular hospitalization for patients who might have been admitted multiple times), which we relied on in merging information from different hospital sources. Matching waveform records to clinical data was based on unique identifiers such as medical record numbers, dates of admission, and patient names. Sometimes, however, nurses did not enter patient identifiers into the bedside monitors and as a result, only approximately half of the available waveform records could be uniquely matched to clinical data. More information on database merger, in particular, how database integrity was ensured, is available at the MIMIC-II web site (http://physionet.org/mimic2).
An additional task was to convert the patient monitoring data from Philips’ proprietary format into an open-source format. With assistance from the medical equipment vendor, the waveforms, trends, and alarms were translated into WFDB, an open data format that is used for publicly available databases on the National Institutes of Health-sponsored PhysioNet web site (6).
Because MIMIC-II is intended to be a reflection of real-life clinical data (rather than pristine data derived from a carefully conducted clinical trial), the clinical and physiological content of the database has not been altered. In other words, we did not enforce any range restrictions or other sanity checks on the data (beyond what each individual hospital database might impose).
Deidentification and Health Insurance Portability and Accountability Act Compliance
All data that were integrated into the MIMIC-II database were deidentified in compliance with Health Insurance Portability and Accountability Act standards to facilitate public access to MIMIC-II. Deletion of protected health information from structured data sources was straightforward (eg, database fields that provide the patient name, date of birth, etc). As well, we removed protected health information from the discharge summaries, diagnostic reports, and the approximately 700,000 free-text nursing and respiratory notes in MIMIC-II using an automated algorithm that has been shown to have superior performance in comparison to clinicians in detecting protected health information (7). This algorithm accommodates the broad spectrum of writing styles in our data set, including personal variations in syntax, abbreviations, and spelling. We have posted this algorithm in open-source form as a general tool to be used by others for deidentification of free-text notes (8).
Database Distribution and Documentation
The MIMIC-II database was developed with the intention to make its contents freely available to interested researchers. The Internet is an effective distribution mechanism to facilitate the dissemination of the deidentified MIMIC-II database. To restrict traffic to legitimate medical researchers, access requires completion of a simple data use agreement and proof that the researcher has completed human subjects training.
The MIMIC-II database is available in two forms. In the first form, interested researchers can obtain a flat-file text version of the clinical database and the associated database schema that enables them to reconstruct the database using their method of choice. In the second form, interested researchers can gain access to the database through a password-protected web service. Database searches require the users to familiarize themselves with the database layouts and to program database queries using the Structured Query Language. Query output can be exported to comma-separated files to be analyzed offline using statistical or other software. Accessing and processing data from MIMIC-II is complex. It is highly recommended that studies based on the MIMIC-II database be conducted as collaborative efforts that include clinical, statistical, and relational database expertise.
Detailed documentation and procedures for obtaining access to MIMIC-II are available at the MIMIC-II web site (http://physionet.org/mimic2).
Database Characterization
We report the characteristics of version 2.4 of the MIMIC-II database (released on February 1, 2010) so that investigators can determine whether a potential study of interest is possible with MIMIC-II. Clinical data that are summarized include mortality, length of stay in the ICU, primary ICD-9 codes, patient demographics, and frequency of use of significant therapeutic interventions. The source code used to generate the statistical results provided in this article is publicly available (9).
Acuity scores were not routinely documented for MIMIC-II patients during the admission process. We implemented an automated algorithm to retrospectively compute the ICU Simplified Acute Physiological Score (SAPS) I scores for the first 3 days of all admissions with complete SAPS I data. The SAPS I formula was chosen for its simplicity, requiring only available clinical laboratory measurements, fluid balance, and vital signs (There have been several refinements to the original SAPS algorithm that incorporate the presence or absence of chronic disease (such as cancer, AIDS, etc) in the overall acuity of a patient. Such clinical data exist in MIMIC-II free-text discharge summaries.). The mortality rate was trended as a function of admission SAPS I scores as a method to validate the automated SAPS I calculations. The distribution of problems, mortality rates, and acuity was also analyzed across the different adult ICUs (coronary care unit, medical ICU, surgical ICU, cardiac surgery recovery unit).
To illustrate some of the analyses possible with the database, we computed the incidence, associated mortality, and odds ratios of a range of diseases that can be defined by objective laboratory abnormalities and of vital sign abnormalities, including heart rate, systolic blood pressure, respiratory rate, and arterial oxygen saturation. We only included the population in whom those diagnostic data were ordered. We excluded the small population with multiple ICU stays in case their characteristics were unrepresentative, and we excluded the final 12 hrs of any ICU stay to avoid confounding the results with physiology associated with withdrawal of care.
Lastly, We compiled a comparison of MIMIC-II to other ICU research databases.
Histogram of admission SAPS I values for MIMIC-II patients (top panel) and associated mortality (bottom panel) with 95% confidence intervals. SAPS, Simplified Acute Physiological Score; MIMIC-II, Multiparameter Intelligent Monitoring in Intensive Care II.
Table 3 provides the primary ICD-9 codes from the patients’ hospital discharges. The following disease categories each comprised at least 5% of the discharge codes: diseases of the circulatory system (39.1%); trauma (10.2%); diseases of the digestive system (9.7%); pulmonary diseases (9.0%); infectious diseases (7.0%); and neoplasms (6.8%). Table 4 reports the incidence and associated mortality of a range of diseases that can be defined by objective laboratory abnormalities. Table 5 reports the incidence and associated mortality of vital sign abnormalities, including heart rate, systolic blood pressure, respiratory rate, and arterial oxygen saturation.
Table 3
Distribution of primary ICD-9 codes in MIMIC-II (version 2.4)
| MICU Stays, No. (% of Unit Stays) | SICU, No., (% of Unit Stays) | CSRU, No., (% of Unit Stays) | CCU, No. (% of Unit Stays) | Total No. (% of Unit Stays) | |
|---|---|---|---|---|---|
| Infectious and parasitic diseases, ie, septicemia, other infectious and parasitic diseases, etc (001–139) | 1319 (15.2%) | 179 (3.0%) | 30 (0.6%) | 75 (2.2%) | 1603 (7.0%) |
| Neoplasms of digestive organs and intrathoracic organs, etc (140–239) | 651 (7.5%) | 630 (10.5%) | 212 (4.5%) | 69 (2.0%) | 1562 (6.8%) |
| Endocrine, nutritional, metabolic, and immunity (240–279) | 482 (5.5%) | 92 (1.5%) | 24 (0.5%) | 35 (1.0%) | 633 (2.8%) |
| Diseases of the circulatory system, ie, ischemic heart diseases, diseases of pulmonary circulation, dysrhythmias, heart failure, cerebrovascular diseases, etc. (390–459) | 1068 (12.3%) | 1,380 (23.0%) | 3758 (79.8%) | 2725 (78.8%) | 8931 (39.1%) |
| Pulmonary diseases, ie, pneumonia and influenza, chronic obstructive pulmonary disease, etc. (460–519) | 1707 (19.6%) | 126 (2.1%) | 121 (2.6%) | 114 (3.3%) | 2068 (9.0%) |
| Diseases of the digestive system (520–579) | 1302 (15.0%) | 756 (12.6%) | 75 (1.6%) | 96 (2.8%) | 2229 (9.7%) |
| Diseases of the genitourinary system, ie, nephritis, nephrotic syndrome, nephrosis, and other diseases of the genitourinary system (580–629) | 338 (3.9%) | 55 (0.9%) | 9 (0.2%) | 46 (1.3%) | 448 (2.0%) |
| Trauma (800–959) | 235 (2.7%) | 1972 (32.8%) | 86 (1.8%) | 43 (1.2%) | 2336 (10.2%) |
| Poisoning by drugs and biological substances (960–979) | 293 (3.4%) | 22 (0.4%) | 4 (0.1%) | 15 (0.4%) | 334 (1.5%) |
| Other | 1305 (15.0%) | 792 (13.2%) | 388 (8.2%) | 241 (7.0%) | 2726 (11.9%) |
| Total | 8700 (100.0%) | 6004 (100.0%) | 4707 (100.0%) | 3459 (100.0%) | 22,870 (100.0%) |
ICD-9, International Classification of Diseases, 9th Revision; MIMIC-II, Multiparameter Intelligent Monitoring in Intensive Care II; MICU, medical intensive care unit; SICU, surgical intensive care unit; CSRU, cardiac surgery recovery unit; CCU, coronary care unit.
Table 4
Incidence and associated mortality of diseases defined by laboratory abnormalities
| Type of Pathology | Laboratory Abnormality | No. of ICU Stays With at Least One Valid Measurementa | No. of ICU Stays With at Least One Episode of Abnormality | Associated Mortality Rate (Positive Cases) | Associated Mortality Rate (Negative Controls) | Odds Ratio | 95% CI |
|---|---|---|---|---|---|---|---|
| Metabolic acidosis | Arterial pH <7.2 and HCO3 <18 | 12,894 | 785 | 53.1% | 12.7% | 7.8 | 6.7–9.0 |
| Thrombocytopenia | Platelet count <50,000 | 18,917 | 872 | 42.2% | 9.8% | 6.7 | 5.8–7.8 |
| Renal insufficiency | Creatinine ≥2 mg/dL | 18,855 | 3523 | 25.8% | 8.2% | 3.9 | 3.5–4.3 |
| Hypoglycemia | Glucose <40 | 18,261 | 163 | 31.9% | 11.6% | 3.5 | 2.5–4.9 |
| Hepatitis | Bilirubin >4.0 OR AST > 500 OR ALT > 500 | 8364 | 1327 | 35.8% | 14.7% | 3.3 | 2.9–3.7 |
| Leukocytosis | White blood count >15,000 | 18,509 | 7079 | 18.6% | 7.1% | 3.0 | 2.7–3.2 |
| Acute lung injury | PaO2/FIO2 ≤300 mm Hg | 10,476 | 6819 | 19.8% | 12.5% | 2.0 | 1.8–2.3 |
| Anemia | Hematocrit <25 | 19,046 | 4835 | 15.0% | 10.0% | 1.6 | 1.4–1.8 |
| Myocardial infarction | Troponin T >0.1 ng/dL or Troponin I >2.0 ng/dL | 5022 | 2904 | 21.3% | 18.9% | 1.2 | 1.0–1.4 |
ICU, intensive care unit; CI, confidence interval; AST, aspartate aminotransferase; ALT, alanine transaminase.
Table 5
Incidence and associated mortality of abnormalities of individual vital signs
| Vital Sign Variable | No. of ICU Stays With at Least One Valid Measurementa | Median of Median of Stays (IQR of Median of Stays) | Vital Sign Instability Definition | No. of ICU Stays With at Least One Episode of Instability | Associated Mortality Rate (Positive Cases) | Associated Mortality Rate (Negative Controls) | Odds Ratio | 95% CI |
|---|---|---|---|---|---|---|---|---|
| Heart rate, beats/min | 20,399 | 84 (74.5–93.5) | HR >150 | 1084 | 32.4% | 9.9% | 4.4 | 3.8–5.0 |
| HR >120 | 5820 | 21.8% | 6.8% | 3.8 | 3.5–4.2 | |||
| HR <40 | 294 | 26.5% | 10.8% | 3.0 | 2.3–3.9 | |||
| SBP >220 | 475 | 20.8% | 10.8% | 2.2 | 1.7–2.7 | |||
| Systolic BP, mm Hg | 20,398 | 119 (108–132) | SBP > 200 | 1506 | 19.0% | 10.4% | 2.0 | 1.8–2.3 |
| SBP <90 | 10,393 | 16.9% | 5.0% | 3.9 | 3.5–4.3 | |||
| SBP <80 | 5808 | 23.8% | 6.0% | 4.9 | 4.5–5.4 | |||
| Respiratory rate, breaths/min | 20,347 | 18 (16–21) | RR >40 | 2431 | 21.3% | 9.7% | 2.5 | 2.3–2.8 |
| RR >30 | 7991 | 18.3% | 6.4% | 3.3 | 3.0–3.6 | |||
| Pulse oximetry | 20,383 | 98 (97–99) | SpO2 <90% | 6372 | 21.9% | 6.1% | 4.3 | 3.9–4.7 |
| SpO2 <80% | 2232 | 31.2% | 8.6% | 4.8 | 4.4–5.4 |
ICU, intensive care unit; IQR, interquartile range; CI, confidence interval; BP, blood pressure; HR, heart rate; SBP, systolic blood pressure; RR, respiratory rate.
Comparison With Other Databases
Table 6 provides a comparison of MIMIC-II with other databases. The salient database features that are compared include the size of the databases (in terms of number of ICU records), record completeness (availability of different physiological and clinical data), and availability. Although MIMIC-II is smaller than Project Impact based on the number of ICU patients, MIMIC-II is notable for its relatively complete ICU patient records and free availability.
Table 6
Comparison of MIMIC-II with other ICU databasesa
| MGH Waveform DB (24) |
SIMON (25) | IMPROVE/IBIS (26) |
Project IMPACT (2) |
eICU Research Institute (27) |
APACHE (1) | ICNARC (28) | Veteran’s Administration (29) |
MIMIC-I (30) | MIMIC-II | |
|---|---|---|---|---|---|---|---|---|---|---|
| Category of database | OR/cardiac procedures | Trauma ICU | ICU shock and neurologic monitoring) | MICU SICU Trauma CCU CSRU | Adult critical care | Medical and surgical ICU | Medical and surgical ICU | Medical and surgical ICU | MICU SICU CCU | MICU SICU CCU CSRU |
| Number of records | 100+ | 1000+ | 100+ | 100,000+ | 1,000,000+ | 110,558 | 900,000 | 110,000+ | 100+ | 10,000+ |
| Single-or multicentered | Single | Single | Single | Multiple | Multiple | Multiple | Multiple | Multiple | Single | Single |
| Source availability | Academic Free | Academic Restricted | Academic Fee-based | Private Fee-based | Private Restricted | Private Free | Academic Free | Government Free | Academic Free | Academic Free |
| Record length | <90 mins | Entire stay | 24 hrs | First 24 hrs | Entire stay | First 7 ICU days | First 24 hrs | Entire stay | Variable (24–48 hrs) | Entire stay |
| Physiological waveforms | Multichannel: ECG Hemodynamic respiratory |
No | Multichannel: ECG Hemodynamic respiratory EEG |
No | No | No | No | No | Multichannel: ECG Hemodynamic respiratory |
Multichannel: ECG Hemodynamic respiratory |
| Vital signs and numerics |
Monitor-generated (1-sec resolution) |
Monitor-generated (1-sec resolution) |
Monitor-generated (1-sec resolution) |
Nurse daily Abstraction |
Monitor-generated (5-min resolution) |
Nurse daily Abstraction |
Nurse daily Abstraction |
Nurse daily Abstraction |
Monitor-generated (1-sec resolution) |
Monitor-generated (1-sec and minute resolution) |
| Bedside alarms | Yes | No | Yes | No | No | No | No | No | Yes | Yes |
| Laboratory/clinical data | No | No | Yes | Yes | Yes | Yes | Yes | Yes | No | Yes |
| Clinician notes | No | No | Yes | No | No | No | No | Yes | No | Yes |
| Therapy details | No | No | Yes | Yes | Yes | Daily Abstraction | Daily Abstraction | Detailed Abstraction | No | Yes |
| ICD-9 Codes/problem lists | No | No | Yes | Yes | Yes | Yes | Yes | Yes | Yes | Yes |
| Mortality/outcomes data availability | No | No | Yes | Yes | Yes | No | Yes | Yes | Yes | Yes |
MIMIC-II, Multiparameter Intelligent Monitoring in Intensive Care II; ICU, intensive care unit; ICD-9, International Classification of Diseases, 9th Revision; OR, operating room; ECG, electrocardiogram; MICU, medical ICU; SICU, surgical ICU; CCU, coronary care unit; CSRU, cardiac surgery recovery unit.
DISCUSSION
We have described the development of a large ICU database that is freely accessible to clinical researchers. The highly automated methods of aggregating thousands of ICU records from disparate sources, the use of open-source data formats, and the development of Health Insurance Portability and Accountability Act-compliant distribution mechanisms (with minimal credentialing requirements and no associated fees) are all intended to provide a valuable research resource to the widest audience of users. This database provides a high-resolution record of the dynamics of a patient’s pathophysiology and the contemporaneous therapeutic interventions. The interplay between disease and therapy can thus be analyzed. Furthermore, because the data are already electronic, this database naturally supports the development of clinical decision-support systems, which are automated algorithms that provide alerts, early warnings, and other decision support for critical care. Because the data are available online, along with a comprehensive user guide, it is hoped that an online community of MIMIC-II researchers will develop in which ideas can be exchanged and collaborations can develop.
To our knowledge, MIMIC-II is the only ICU database that encompasses patient demographics, clinical laboratory data, categorical admission diagnoses as well as detailed therapeutic profiles such as intravenous medication drip rates and hourly fluid balance trends for the duration of the ICU stay. These data are supplemented with a rich set of text-based records, including nursing progress notes, discharge summaries, and radiology interpretations. Developing this database was possible only because Boston’s Beth Israel Deaconess Medical Center is one of the <5% of hospitals in the United States that have fully automated and comprehensive medical records (10). Furthermore, in the current version of MIMIC-II, physiological waveforms and minute-to-minute vital-sign are available for 2061 of the patient records (an additional 2000 records not matched to clinical data are also available).
A wide range of analyses can be performed on these data, spanning epidemiology, clinical decision-rule development, and electronic tool development. For example, Jia et al (11) assessed risk factors for acute respiratory distress syndrome in MIMIC-II patients who were mechanically ventilated for >48 hrs. Saeed (12) studied how certain ICU practices varied significantly as a function of time of day, ie, during the workday vs. the overnight shifts. From the parameter-rich MIMIC-II database, Hug (13) identified multivariate factors associated with death, successful wean of pressor infusions within 12 hrs, successful weans of intra-aortic balloon pumps, and development of septic hypotension; and he developed predictive statistical models for these outcomes. Because of the suitable size of the database, for example, Hug identified >50,000 episodes of successful pressor weans within MIMIC-II; he was able to segment the data into distinct training and testing subpopulations, which enhances the validity of such analyses.
Broadly speaking, MIMIC-II supports the development of new automated clinical decision-support systems. Although decision-support research before MIMIC-II has spanned functionality, including automated drug allergy notifications, medication interactions, and reminders about abnormal laboratory results (14, 15), little progress has been made in clinical decision support for the acute management of unstable patients, a major challenge in the ICU. The value proposition is that novel automated algorithms may operate in real time and prevent medical mistakes or promote timely responses to the patients’ conditions. Consider that Kumar et al (16) showed that the duration of hypotension before the initiation of antimicrobial therapy was the most significant factor associated with mortality in septic patients. Therefore, having a reliable automated decision support to prompt timely antibiotic administration may be expected to improve critical care outcomes.
Distinct components of the MIMIC-II database may be studied to develop a variety of software tools. For example, electronic algorithms that automatically extract information from free-text nursing notes and discharge summaries have been developed and tested (7). Alarm algorithms can be trained and validated using MIMIC-II waveform records, which may help to address the perennial problem of false alarms by bedside monitors (17). Analysis of MIMIC-II also promotes the use of effective mathematical techniques for quantifying patterns through time, because so many of its clinical parameters are complex time-series, eg, continual heart rate trends. Saeed and Mark (18) explored the use of wavelet transformation of hemodynamic time series with machine learning to predict hemodynamic deterioration in ICU patients, and Lehman et al (19) explored how to search for case records who shared similar temporal patterns in time-series variables.
Interpretive algorithms can be developed and compared head-to-head using MIMIC-II. For instance, there are a number of different competing algorithms that estimate cardiac output from the arterial blood pressure waveform. MIMIC-II provides a resource for their fair comparison (20), providing a large number of radial ambulatory blood pressure waveforms and paired measurements of cardiac output by a thermodilution reference method. MIMIC-II may serve a role analogous to the public access arrhythmia databases that played an indispensable role in the development, refinement, and— ultimately—widespread acceptance of automated algorithms for electrocardiogram analysis (21). Overall, MIMIC-II offers the means to develop and assess cutting-edge algorithms, exploiting the full spectrum of data available in critical care, with the underlying goal to catalyze a new generation of automated decision-support systems that demonstrably improve the practice of critical care.
In this report, we characterized MIMIC-II using ICD-9 codes as well as quantitative data-driven measures. Although ICD-9 is the accepted coding procedure used for patient billing, prior studies have suggested that ICD-9 administrative data do not accurately reflect the true prevalence of comorbidities in hospitalized patients (22). Some analyses of MIMIC-II may require chart review by clinicians to optimize accuracy. Our group is actively investigating the application of natural language processing technology to automatically identify patients with specific comorbidities such as AIDS, metastatic cancer, chronic obstructive pulmonary disease, etc, that are needed for such scores as SAPS, Acute Physiology and Chronic Health Evaluation, etc.
MIMIC-II was developed to serve as a research resource for physicians, scientists, and engineers. If large volumes of medical data are to be widely and freely disseminated, patient privacy concerns are inevitably raised. To address this, automated deidentification tools were developed and rigorously evaluated to remove protected health information from structured and free-text fields such as nursing notes and physician discharge summaries. Ultimately, we successfully applied tools that were demonstrated to perform better than using two independent clinicians to identify protected health information in medical records. Finally, as an added layer of protection to patient privacy, MIMIC-II users must sign and abide by a data-use agreement before being granted access to the free-text elements to ensure data are used for only legitimate purposes.
Although MIMIC-II is in many respects innovative and unprecedented, it by no means represents the ultimate ICU research database. There are several notable limitations, and ideally future iterations of MIMIC-II or other complimentary public-access ICU databases can address some of these matters. First, administration of oral and intravenous bolus medication administration was paper-charted and not systematically tabulated in the electronic record. Although provider order entry records were computerized and aggregated into MIMIC-II, these data are not equivalent to documenting if and when those medications were truly administered. Second, MIMIC-II only includes ICU data (with the exception of laboratory results and discharge summaries). A database that included complete data before the development of critical illness would be invaluable. Third, MIMIC-II is limited by having ICU records from a single institution. The clinical practices and patient populations documented by this database may not be representative of other hospitals. Fourth, MIMIC-II data reflects “real-world” clinical practice as opposed to scrupulously tended research protocols. This means that certain documentation and clinical practices may be less reliable (eg, not carefully recalibrating the arterial pressure transducers every shift), which may be a source of error for some analyses, whereas it may be advantageous for other investigations. For example, when developing clinical decision rules and other automated decision-support algorithms, it is more valid to analyze “real-world” data rather than idealized research data that are unrepresentative of actual clinical practice.
Finally, only a subset (approximately 2000) of MIMIC-II records include matched physiological waveform and minute-to-minute trend data owing to technical difficulties in deploying data-archiving machines, which interfaced with bedside patient monitoring systems, and difficulties in linking waveform files to specific clinical records. Furthermore, the subset of records with waveforms is not necessarily statistically similar to the database as a whole. On the other hand, the collection of 2000 waveform records is massive by most standards. For example, the electrocardiogram database that supported development and evaluation of automated arrhythmia algorithms included much smaller data collections (48 half-hour samples in the MIT-BIH Arrhythmia Database [21] and 80 3-hr records in the American Heart Association ECG Database [23]). Machine learning strategies certainly benefit as the number of examples rise, but the 2000 waveform records matched with clinical cases are sufficient for many important investigations, and this number will grow, because we continue to collect data and to publish new versions of MIMIC-II. Also, an additional 2000 records unmatched to clinical data are available (posted on PhysioNet) and such records are adequate for many physiological and clinical studies (such as developing algorithms to predict hypotensive episodes, reducing false alarms, etc).
In the short term, collaboration with industry vendors is mandatory for the development of databases similar to MIMIC-II owing to the sophisticated interfaces and proprietary data formats of most ICU devices. For MIMIC-II, the participating patient monitoring vendor (Philips Healthcare) provided significant engineering resources to facilitate access to data from patient monitors and to the CareVue clinical information systems. In the long term, however, the adoption of common data formats that allow for seamless device communication would remove a significant barrier to developing databases similar to MIMIC-II.
9. nursing station
The nurses’ station is the fulcrum of activity on the inpatient hospital floor. At some point, virtually every hospital function intersects at this critical junction, often simultaneously, via impromptu meetings among a wide cross-section of hospital staff. This intensive and varied use presents a set of complex and challenging issues for hospitals and the people that help them effectively plan for new or renovated facilities.
Over the past three years, members of our current Nurture by Steelcase team have conducted detailed ethnographic research at leading health facilities to evaluate a wide variety of nurses’ station interactions—especially how caregivers perform their duties and how patients receive their care.
Nurture’s research and design approach is built around the user experience. We undertake five steps to provide specific solutions to our healthcare clients: Understand, Observe, Synthesize, Realize, and Pilot/Test.
After analyzing the issue—through business concerns, technology trends, and what’s new and how it affects the organization—Nurture’s research team goes on-site to build a first-hand understanding of the user’s day-to-day work life. The Nurture design research team—consisting of researchers, designers, and product specialists—then synthesizes these findings into design principles, criteria, and concepts that feed into the product development process. Finally, Nurture shares all of this information with architects, designers, and clients.
Building on existing research on nurses’ stations, our research process has allowed Nurture to more fully understand the nurses’ station and to come up with what we believe to be better design concepts.
CONTROLLED CHAOS
Many kinds of work happen in the nurses’ station, but traditional designs try to force-fit them into a single, rigid configuration—typically with a fortress-like counter and an enclosed room behind it. This assumes that work happens in neat, defined silos. In reality, there’s chaos and crowding, with many different behaviors colliding in the space.
First and foremost, nurses’ stations need to be considered in the context of providing patient care and as a functional work space. Sharp aesthetics are nice, but this space, maybe more than any other in the hospital environment, needs to be highly functional.
Through our observations, we have seen examples of different types of nursing station organizational models: centralized, decentralized, and various combinations of the two. Each has its own set of benefits and trade-offs relative to patient care and work.
Centralized. In this model (figure 1), the nurses’ station is a central hub on the unit—all workstations are located here, as are the unit assistant and most office machines.
AN EXAMPLE OF A CENTRALIZED NURSES’ STATION.
-
Pros: Nurses and clinical staff work together in a central location; quick access to peers paves the way for learning, mentoring, and efficient communication; resources can be consolidated.
-
Cons: Less proximity to patients; increased congestion and noise.
Decentralized. There is no central hub in this model (figure 2). Nursing stations are located throughout the unit outside each patient room, and the unit assistant is typically located near the entrance to the unit.
AN EXAMPLE OF A DECENTRALIZED NURSES’ STATION.
-
Pros: Nurses are closer to patients; possibly fewer distractions; each nurse has his or her own work space.
-
Cons: Fewer opportunities for informal learning with peers; sense of isolation; less proximity to control center for the unit assistant.
KEY DESIGN PRINCIPLES
Regardless of which organizational type one chooses, our research team has identified five key principles to consider when designing a nurses’ station or series of stations.
1. Allow for Control and Flexibility. The ability for staff and patients to control their environment is crucial. The environment needs to support:
-
changes in care delivery, such as bedside charting and physician order entry;
-
changes in technology, such as increased access to computers (e.g. mobile carts, bedside terminals) and the integration of clinical technology with patient records; and
-
the ability to adapt spaces as needs change.
2. Support the Social Ecology. Social interaction is key to learning. The environment needs to support the many ways people interact for learning. The space should:
-
accommodate generational mentoring and apprenticeship;
-
allow for different group sizes (e.g.,one-to-one and one-to-many);
-
allow for informal versus formal instruction; and
-
allow for on-the-go versus stationary instruction.
3. Understand Work Processes. The environment needs to consider and support the users and activities. The space should accommodate:
-
different types of hospital units;
-
different roles (e.g., physicians, nurses, radiologists); and
-
different types of work (e.g., charting, group rounds, medication preparation and delivery, and shift changes.
4. Reduce Cognitive Load. Information overload leads to confusion and disorganization. The environment needs to support the display of:
-
information that needs to be visible for a long time;
-
information that changes frequently; and
-
ways to call attention to important information (e.g., allergy alerts on a chart).
5. Maximize Spatial Relationships. Space plays an important role in security, staff and patient safety, communication, and physical demands on caregivers. Designers should strive to:
-
understand the relationships between different activity zones to prioritize adjacencies;
-
consider patient monitoring and staff communication when creating sight lines between zones; and
-
consider travel distances when designing (e.g., supply rooms, med rooms, patient rooms, and staff respite areas).
Remote Management is managing a computer or a network from a remote location. It involves installing software and managing all activities on the systems/network, workstations, servers, or endpoints of a client, from a remote location.
10. Remote Monitoring
Remote Monitoring (also shortened to RMON) refers to the specification that helps MSPs monitor the network operational activities of their clients by using remote devices, which are known as probes or monitors. This helps MSPs ensure efficient network infrastructure control and management.
Major Functions of Remote Monitoring Software
For MSPs
- Helps gather insight about client networks- includes gaining information about machine health and status and supplying reports and data about client systems/networks
- Helps maintain client systems and keep them up to date
- Helps track issues and resolve them remotely. This is done by generating alerts (tickets) and resolving issues
- Helps resolve issues even before clients notice them
- Helps remotely administer patches and install software and updates using a single, unified dashboard
- Helps administer tasks simultaneously to many systems at once from a remote location
- Helps automate scheduled maintenance tasks at clients' locations
For Break-Fix Customers
- Helps resolve issues for break-fix customers who are facing issues pertaining to inconsistent work-flow for the IT provider
- Helps break-fix customers who are facing issues relating to inconsistent income with no recurring revenue model
- Helps break-fix customers who face multiple problems
- Helps resolve minor issues that could lead to bigger issues if unchecked
- Helps resolve issues relating to outdated systems and irregular updates or upgrades
- Helps resolve issues arising out of data breaches
Benefits of RMM Tool
- Helps small and medium businesses (SMBs) with enterprise-level automation and monitoring
- Helps detect issues before they cause crises or critical system failure
- Helps in the systematic management of clients' IT requirements
- Helps ensure optimal network stability
- Helps enhance the performance of clients' systems
- Helps extend the life span of clients' systems and devices
- Helps ensure better end-user productivity
- Helps clients get better customer loyalty and satisfaction
- It Helps MSPs keep client-related issues under control or avoid issues and thereby ensure higher profit margins
- Helps MSPs expand their client base and provide better service
10.
Alaram
Acoustic alarms are being used to communicate a multitude of alarm conditions, e.g., if a vital sign parameter exceeds a given alarm threshold or if a technical problem occurs. A high sensitivity2 in detecting clinically relevant situations is desired, as this is important to guarantee patient safety.
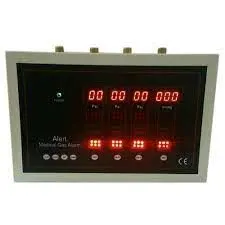
11.