Parsing NASA thermodynamic data
AIM: To write program where a function extracts the 14 co-efficients and calculates the enthalpy, entropy and specific heats for all species in the data file
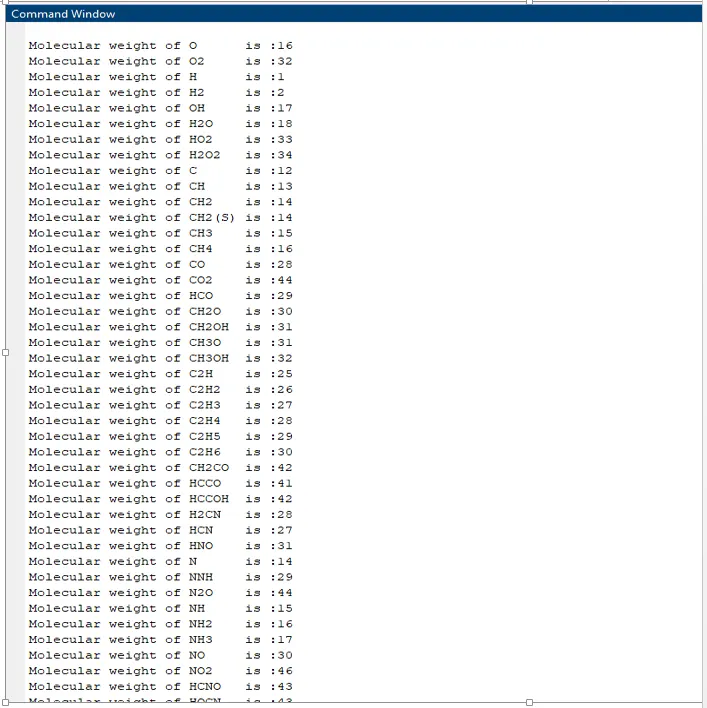
To write a function to calculate the molecular weight of each species and display it in the command window.
To plot the Cp, Enthalpy and Entropy for the local temperature range (low temperature:high temperature) specifically to each species
DESCRIPTION:
NASA thermodynamics coefficients data at particular temperature range for several species or elements were stored in such way that the data can be extracted and use the information at process where chemical and kinetic reactions of molecules ,atoms are involved at different temperature conditions such as combustional process analysis, computational study of flow of fluids in nozzle, thermo equilibrium analysis, detonation process and so on. The thermodynamic properties of each molecule or species such as specific heat, Enthalpy, Entropy ..at
different temperatures are determined by automatic iteration process and made available to everyone for the research works.
There are two ways to handle the task of representing properties of individual species. In the first one, data is tabulated at predetermined temperature intervals and the values needed are calculated by interpolation. This requires large memory storage and cannot tabulate beyond particular temperature range. The second one is representing the thermodynamic properties of each species by polynomials.
`frac{Cp}{R}=a1+a2*T+a3*T^2+a4*T^3+a5*T^5`
`frac{H}{R*T}=a1+a2*T/2+a3*T^2/3+a4*T^3/4+a5*T^4/5+a6/6`
`S/R=a1*logT+a2*T+a3*T^2/2+a4*T^3/3+a5*T^4/4+a7`
where a1,a2, a3, a4, a5, a6, a7 are coefficients taken for high temperatures
a8, a9, a10, a11, a12, a13, a14 are the coefficients taken for low temperatures
R= 8.314, Universal gas constant (J/mol-k)
Cp, Heat Capacity, J/mole-k
H, Enthalpy, J/mole-k
Libraries of these thermodynamic data and transport properties are given in the form of least square coefficients and are available for nearly 1130 species. As shown above, Cp(T) values data were fit to fourth order polynomial with integration constants for H(T) and S(T)
which also includes the heat of formation constants.
These coefficients generate the thermodynamic functions heat capacity Cp(T), enthalpy, H(t), entropy(T)
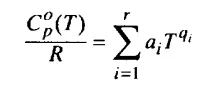
For CET89 and CETPC, r=5 and qi values are 0,1,2,3 and 4. A second set is planned for future NASA Lewis chemical equilibrium codes, The new set has two additional terms(r=7) ,one with qi=-1 and q=-2
Enthalpy and Entropy are related thermodynamically to Cp(R ) as follows
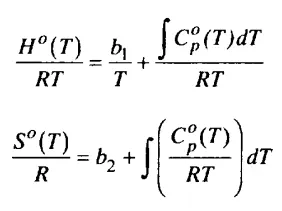
where b1 and b2 are integration constants.
Most of the coefficients data served are same till date except few are adjusted for newer physical constants and for newer atomic weights.
The fits were constrained so that the coefficients functional form gives results that match the original data at that temperature intervals.
The temperature range for most of the data is 300K to 5000K because the species are mainly obtained from the reaction of products in thermochemical processes between this range . These data are useful for chemical equilibrium and kinetics computer codes. These data were used by the NASA Lewis equilibrium computer programs CET89 and CETPC.
For most of the species either the thermodynamic function or the molecular constant data are taken from other compilation such as JANAF
and the Russian Volumes.
Main Code:
- The main program takes input as THERMO data.txt file and gives output as plots Cp Vs T, H Vs T and S vs T. The THERMO data file, f1 has 53 different species or moleules with14 coeffficients values as a single string which were determined experimentally within a temperature range of 300K to 5000k. The program extracts 14 coefficients of each species and are used to calculate the Heat capacity Cp , Enthalpy H and Entropy S using ploynomial equation which accurately fits the data given in file . The file data is assigned to variable f1.
- fgetl() command reads the line each time it is entered. Using this command we can the skip few lines which are not required for our program.
- fopen() command opens the file name THERMA data.txt. The global temperature range taken from line2, L2. L2 has three temperatures which are assigned to variables global_low_temperature, global_medium_temperature and global_high_temperature.
- strsplit() command splits the string at the delimiters specified in it. Here empty space is the delimiter and displays as an array of values.
- using for-loop ,iteration is done for 53 species and extracts the 14 coefficients a1, a2,a3,a4,a5,a6,a7,a8,a9, a10,a11,a12,a13,a14 for each species.
- Functions are called in the main program to caluculate Cp,H, S values taking inputs as coefficients, universal gas constant at each temperatures taken between local temperature range. using Linspace() command, we have taken 100 temperaures between temperature range from 300K to 3500k and assigned that value to T.
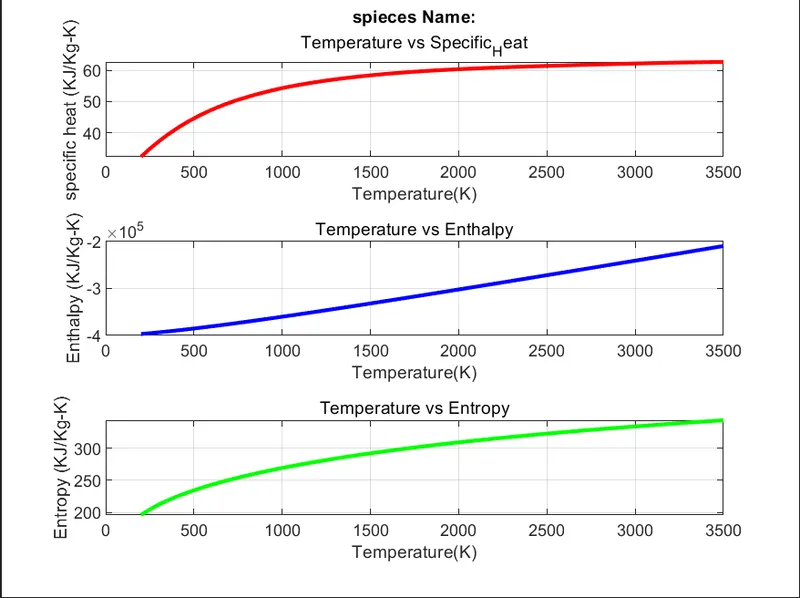
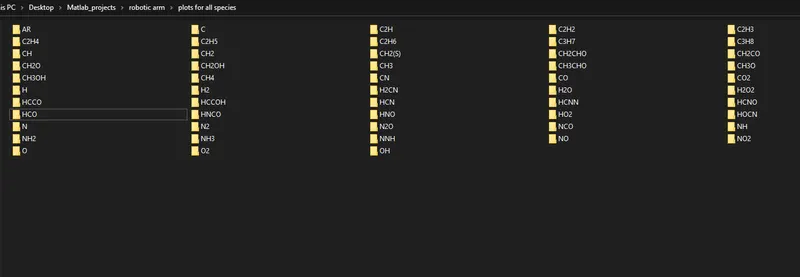
- Using mkdir command created new directory to save all the plots drawn for Heat Capacity Cp, Enthalpy H and Entropy S against Temperatures .CD command specifies current directory. Here three plots were shown in a single frame Figure(1) for each species.
- Molecular weights for species are caluculated by calling a function molecular_Wt()
clear all
close all
clc

f1=fopen('THERMO data.txt','r')

L1=fgetl(f1)  %% fgetl() read the line from file ,removing newline characters.storing the line in variable L1
L2=fgetl(f1)  % fgetl command retriving data line 2 from THERMO file and storing in L2
A=strsplit(L2,' ')  % strsplit command is identifying delimiters in data and storing in A

global_low_temp=str2num(A{2})
global_mid_temp=str2num(A{3})
global_high_temp=str2num(A{4})

%Local temperature range taken from 300K to 3500K ,100 equally spaced
%values ar taken between the range
T=linspace(300,3500,100);
R=8.314; %R,universal gas constant, KJ/mol-K

fgetl(f1);  % skipping the line
fgetl(f1);  % skipping the line
fgetl(f1);  % skipping the line

% In THERMO data 53 species are there, iteration will happen 53 times
for i=1:53

    species=fgetl(f1);             % read the data in this line and assigns to variable species
    species_name=species(1:6);     % reads six characters  in species and value is taken in variable species_name


    L7=fgetl(f1);                  % reads line7 data
    a=findstr(L7,'E');             % Identifies character E in line7 and assigned to var a
    co_eff1=L7(1:a(1)+3);          % extracts the first coeffficient from line7 and stored as a1
    a1=str2double(co_eff1);
    co_eff2=L7(a(1)+4:a(2)+3);
    a2=str2double(co_eff2);         % extracts the second coeffficient from line7 and stored as a2
    co_eff3=L7(a(2)+4:a(3)+3);
    a3=str2double(co_eff3);        % extracts the third coeffficient from line7 and stored as a3
    co_eff4=L7(a(3)+4:a(4)+3);
    a4=str2double(co_eff4);         % extracts the fourth coeffficient from line7 and stored as a1
    co_eff5=L7(a(4)+4:a(5)+3);
    a5=str2double(co_eff5);         % extracts the fifth coeffficient from line7 and stored as a1


    % extacting sixth to fourthteen coefficients
    L8=fgetl(f1);
    a=findstr(L8,'E');
    co_eff6=L8(1:a(1)+3);
    a6=str2double(co_eff6);
    co_eff7=L8(a(1)+4:a(2)+3);
    a7=str2double(co_eff7);
    co_eff8=L8(a(2)+4:a(3)+3);
    a8=str2double(co_eff8);
    co_eff9=L8(a(3)+4:a(4)+3);
    a9=str2double(co_eff9);
    co_eff10=L8(a(4)+4:a(5)+3);
    a10=str2double(co_eff10);

    L9=fgetl(f1);
    a=findstr(L9,'E');
    co_eff11=L9(1:a(1)+3);
    a11=str2double(co_eff11);
    co_eff12=L9(a(1)+4:a(2)+3);
    a12=str2double(co_eff12);
    co_eff13=L9(a(2)+4:a(3)+3);
    a13=str2double(co_eff13);
    co_eff14=L9(a(3)+4:a(4)+3);
    a14=str2double(co_eff14);


  % calculation of Cp,Entropy, Enthalpy values with the local temperature
  % range T by calling functions specific_Heat,Enthalpy,Entropy
  %calculation of molecular weights of each species by calling function
  %molecular_wt

  Cp= specific_Heat(a1,a2,a3,a4,a5,a6,a7,a8,a9,a10,a11,a12,a13,a14,R,T,global_mid_temp);
  H= Enthalpy(a1,a2,a3,a4,a5,a6,a7,a8,a9,a10,a11,a12,a13,a14,R,T,global_mid_temp);
  S=Entropy(a1,a2,a3,a4,a5,a6,a7,a8,a9,a10,a11,a12,a13,a14,R,T,global_mid_temp);

  M_Wt=molecular_wt(species_name);

  % creating a directory name g to save plots
  %cd tells current directory
  c=cd(pwd);
  g='plots for all species';
  mkdir(g)
  cd(g);


  figure(1)
  subplot(3,1,1)
  plot(T,Cp,'linewidth',2,'color','r')
  title('spieces Name:',species_name)
  subtitle('Temperature vs Specific_Heat')
  xlabel('Temperature(K)')
  ylabel('specific heat (KJ/mol-K)')
  title('Species Name:',species_name)
  grid on


  subplot(3,1,2)
  plot(T,H,'linewidth',2,'color','b')
  subtitle('Temperature vs Enthalpy')
  xlabel('Temperature(K)')
  ylabel('Enthalpy (KJ/mol-K)')
  grid on


  subplot(3,1,3)
  plot(T,S,'linewidth',2,'color','g')
  subtitle('Temperature vs Entropy')
  xlabel('Temperature(K)')
  ylabel('Entropy (KJ/mol-K)')
  grid on

  saveas(figure(1),'p')

  cd(c)

end
Specific Heat Capacity Function Code:
function [Cp]=specific_Heat(a1,a2,a3,a4,a5,a6,a7,a8,a9,a10,a11,a12,a13,a14,R,T,global_mid_temp)
for i=1:length(T)

    if T(i)<=global_mid_temp

        Cp(i)=R.*(a8+a9.*T(i)+a10.*T(i).^2+a11.*T(i).^3+a12.*T(i).^4); %  low temperature coefficients
    else
        Cp(i)=R.*(a1+a2.*T(i)+a3.*T(i).^2+a4.*T(i).^3+a5.*T(i)^4);  %  high temperature coefficients
    end

end
Enthalpy Function Code:
function [H]=Enthalpy(a1,a2,a3,a4,a5,a6,a7,a8,a9,a10,a11,a12,a13,a14,R,T,global_mid_temp)
for i=1:length(T)

    if T(i)<=global_mid_temp

       H(i)=R.*T(i).*(a8+a9.*T(i)/2+a10.*T(i).^2/3+a11.*T(i).^3/4+a12.*T(i)^4/5+a13/T(i));
    else
        H(i)=R.*T(i).*(a1+a2.*T(i)/2+a3.*T(i).^2/3+a4.*T(i).^3/4+a5.*T(i)^4/5+a6/T(i));

    end

end
Entropy Function Code:
function [S]=Entropy(a1,a2,a3,a4,a5,a6,a7,a8,a9,a10,a11,a12,a13,a14,R,T,global_mid_temp)
for i=1:length(T)

    if T(i)<=global_mid_temp


        S(i)=R.*(a8.*log(T(i))+a9.*T(i)+a10.*T(i).^2/2+a11.*T(i).^3/3+a12.*T(i).^4/4+a14); % Low temerature co-efficients
    else
         S(i)=R.*(a1.*log(T(i))+a2.*T(i)+a3.*T(i).^2/2+a4.*T(i).^3/3+a5.*T(i).^4/4+a7);  %High temperature co-efficients

    end

end
Molecular Weights Calculation code:
function [M_Wt]=molecular_wt(species_name)
Element={'H' 'C' 'N' 'O' 'R'};   %list of atoms present in all species names
atomic_weight=[1 12 14 16 48];   % atomic weight of respective atoms

M_Wt=0;
for i=1:length(species_name)

   for j=1:length(Element)

       if strcmp(species_name(i),Element(j))  % comparing of characters is done from species_name and Element array
           M_Wt=M_Wt+atomic_weight(j);        % iteration is done till the elements different
           position=j;
       end
   end
   n=str2num(species_name(i));                % n is no elements in species-name
   if n>1
       M_Wt=M_Wt+atomic_weight(position)*(n-1);  % atomic weight is added for same element  n-1 times
   end
end
fprintf('Molecular weight of %s is :',species_name);
fprintf('%dn',M_Wt);
end
Plot for Species name O2:
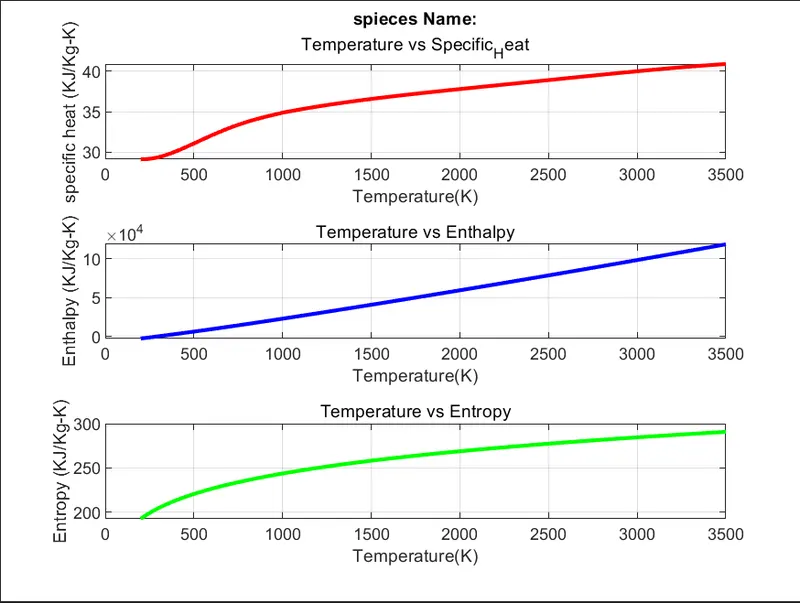
Plot for Species name N2:
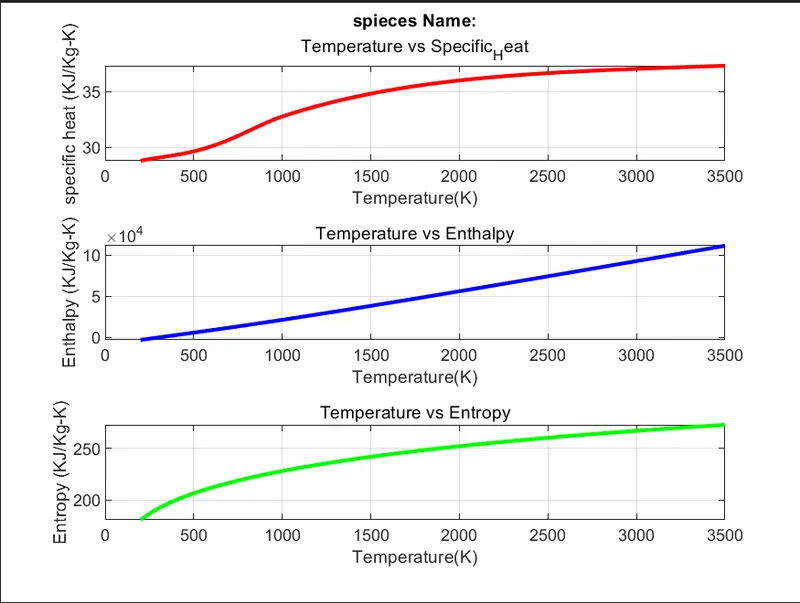
Plot for Species name CO2:
Files saved in directory:
Molecular weights for all species:
Referrence:
- file:///G:/Art%20Integration/978-1-4684-0186-8_8.pdf
- https://shepherd.caltech.edu/EDL/PublicResources/sdt/refs/NASA-TM-4513.pdf
- skill-Lync videos
Conclusion: Using this method of extracting data from data files will be very helpful for the analysis and research projects for several years .This will save lot of time and can predict many data functionality by defining proper polynomial fit curve and equations and also can determine most of the thermodynamic properties.