Modelling of EV using MATLAB and Simulink
Aim : Create a MATLAB model of electric car which uses a battery and a DC motor. To check out performance parameters speed, SOC, current with FTP drive cycles.
Theory :
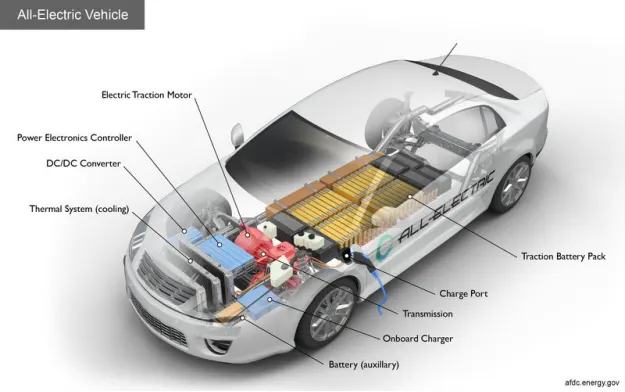
All-electric cars (EVs), also known as battery electric vehicles, store the electrical energy that powers the motor in a battery pack. The vehicle's electric battery is charged by hooking it into an electric power source. Despite the fact that power generation contributes to air pollution, the EPA classifies all-electric vehicles as zero-emission vehicles because they emit no direct exhaust or tailpipe emissions.
Block Diagram of EV Vehicle
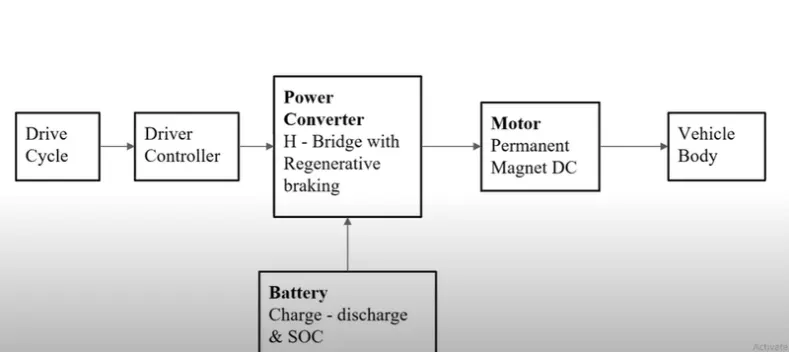
The main component EV model require is Power converter, Motor and Battery. In simulink model drive cycle is given as input to model and is nothing but at what speed you want to run your vehicle. The driver controller which will actually track the actual speed of the vehicle and which will mapped the drive cycle or given input. Before connecting battery to direct motor will required a motor controller, so this motor controller is nothing but to change the speed of vehicle according to our requirement. If you directly connect battery to motor then motor will run at rated speed and there will not any control to the vehicle, so we want controller this happen by using H-Bridge.
Simulink Model
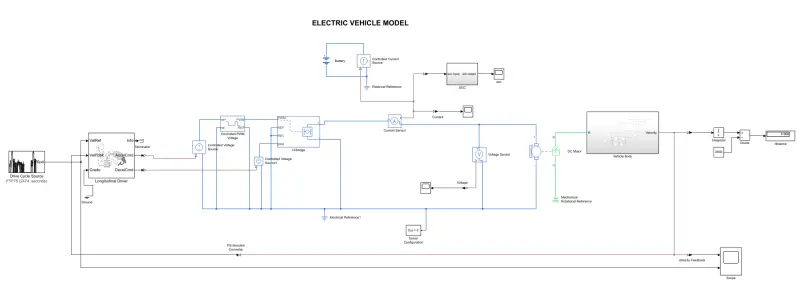
Vehicle Body Subsystem
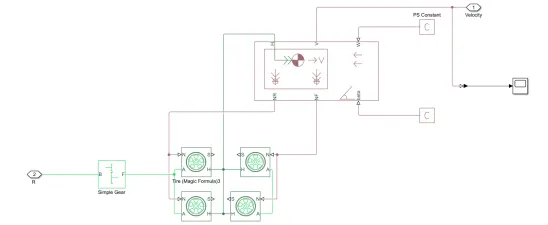
Simulink Model Explanation
1.Tire
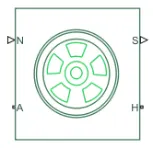
We want to develop a model for four wheel EV vehicle so 4 tire is required. So as you can see there are four terminal to tire which is,
H - Hub
S - Tire slip
N - Normal force which is applied to tire
A - Axel Connection
2.Vehicle Body
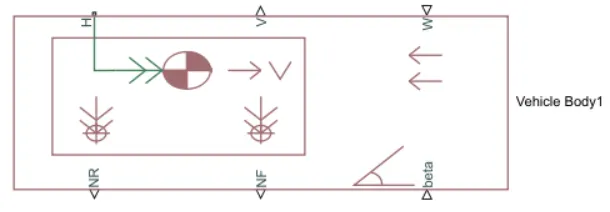
Now we want vehicle body above this four tire and this vehicle body actually installed in all this four tire. So as you can see there are five terminal to tire which is,
W - Wind velocity
Beta - Grade angle
V - Velocity
NR - Normal force on rear axel
NF - Normal force on rear axel
3.Simple Gear
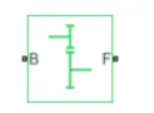
It represent the gear box which connect the motor to rear axel of the vehicle
4.DC Motor
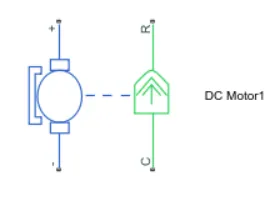
Let’s choose brushed type dc motor. Output of power converter connected to blue part of positive and negative side, which is electrical side and green part is nothing but mechanical part (rotational) connect to R to simple gear and C (casing) connect mechanical rotational reference.
5.H - Bridge
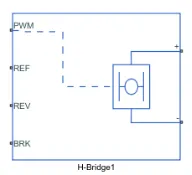
The H- Bridge aids in the control of power in accordance with requirements. The output is voltage that has been transformed according to the parameters that have been set.
PWM = Pulse width modulation
REF = Reference
REV = Reverse
BRK = Regenerative braking
6.Controlled PWM Voltage
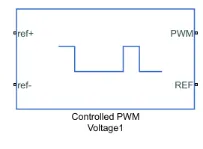
Controlled PWM voltage will actually apply pulses and based along this pulses from the fixed battery voltage. The variable voltage available to motor which is motor speed and torque are going to change.
ref+ = Reference positive for acceleration command
ref- = Reference negative for Deceleration command
PWM = Pulse width modulation connected to H-bridge
REF = Reference connected to H-bridge
7.Controlled Voltage Source
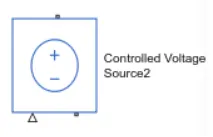
Controller is work on logic level and this is power level, so we will required a controlled voltage source for given output of this block.
8.Longitudinal Driver
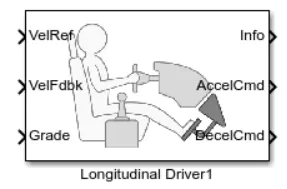
A parametric longitudinal speed tracking controller for generating normalized acceleration and braking commands based on reference and feedback velocities.
9.Drive Cycle
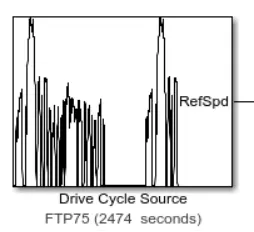
Drive cycle is given as input to model and is nothing but at what speed you want to run your vehicle.
10.Battery
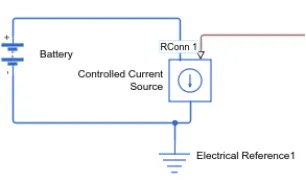
We are going to connect battery in a such way that it is going to get discharge according to current which is taken out from dc motor. This battery connect to controlled current source which will discharge the battery according to current taken from dc motor.
Simulation Result :
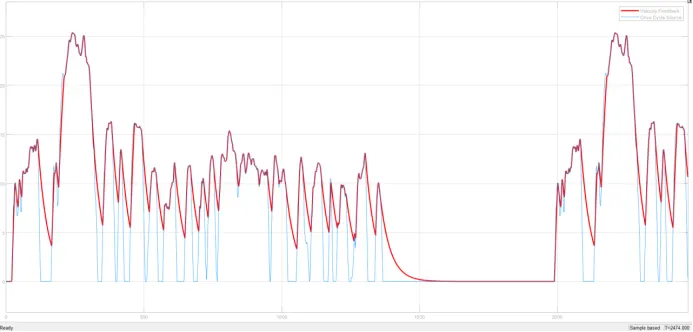
Vehicle Feedback
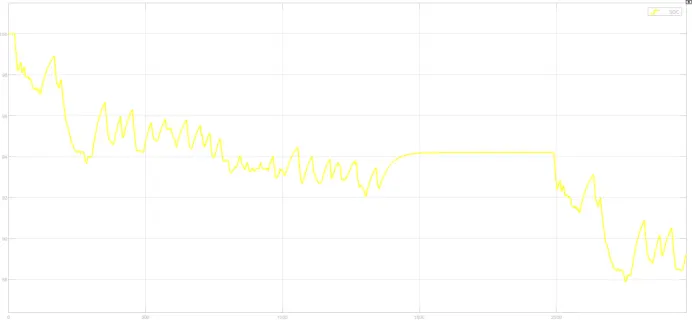
Battery SOC
Current
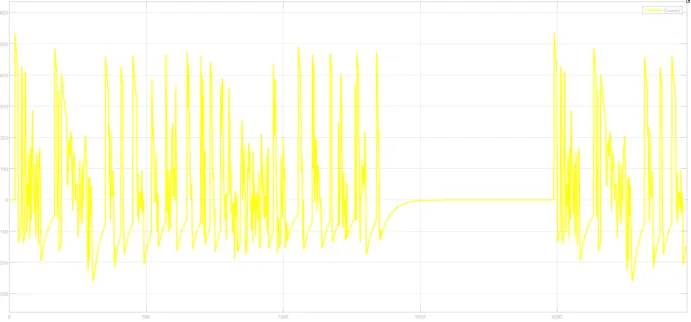
Distance - 5.966 km
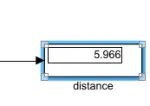
Observations : At the end of drive cycle i.e after 2474 seconds the SOC is around 89%. Vehicle travel by distance is 5.966 km.
Conclusion :
The driver compare actual speed and reference speed and if there is positive error which means the reference speed is more than actual speed then driver is going to press accelerator. In case actual speed is more than reference speed then the driver is going to apply brake.
The SOC plot shows the battery's state of charge for drive cycle. The SOC is falling while the vehicle is accelerating, but as soon as deceleration begins, the SOC plot begins to significantly increase. This is because regenerative braking during decelerating is charging the battery.
Reference: