Modelling and simulation of flow through a flowbench
Aim:
In this Project, Creating a 3D model of a flowbench and run flow analysis where the internal flow takes place and running a baseline simulation and then performing a grid dependency test(4, 5 & 6) at a particular valve lift(0.003) and also performing valve lift(0.001 -0.008) test at a particular grid size(5). Study the velocity and pressure plots and explain the results. Comparing the results and plotting the valve lift vs mass flow rate.
1. INTRODUCTION
1.1 Computational Fluid Dynamics
CFD has fascinated researchers, as it is a fast, accurate and reliable method of analyzing the variation of hydrodynamic properties of the flow over and within a body. Computational Fluid Dynamics (CFD) is a branch of fluid mechanics that uses numerical methods and algorithms to solve complex problems involving fluid flow.
1.2 Total Pressure
Total pressure is the measure of the total energy of the airstream and is equal to static pressure plus velocity pressure. The total pressure is the sum of the static and dynamic pressures. Total pressure is the total of static pressure p, dynamic pressure q, and gravitational head.
1.3 Static Pressure
Static pressure is the pressure that a fluid exerts when it is not moving.
1.4 Mass Flow Rate
The mass flow rate of a system is a measure of the mass of fluid passing a point in the (m) system per unit time.
The present study aims to analyze the fluid flow in a flowbench and perform the grid dependency and valve lift test and observe the results.
2. Geometry and Dimension
i. Geometry of the Flowbench
ii. Dimension of the valve lift
3. PARAMETERS FOR BASELINE SIMULATION
3.1 Output
Baseline Simulation plots.
Fig. 3. Velocity Plot
Fig. 4. Pressure Plot
Mass Flow Rate
Fig. 5. MAss flow rate
4. GRID DEPENDENCY TEST
Parameters for Grid dependence test
4.1 New parametric study- Grid dependence test
In order to select the level of refinement, we run a parametric test where for constant valve lift of 0.003m we set three different grid sizes ranging from 4 to 6. Also, we check the Velocity and Pressure plots for these three values.
Note: Level of refinement of these plots is 255.
4.2 Output: Results after the study
i. Grid Size 4
Velocity Plot @ valve lift 0.003m
Pressure Plot @ valve lift 0.003m
ii. Grid Size 5
Velocity Plot @ valve lift 0.003m
Pressure Plot @ valve lift 0.003m
iii. Grid Size 6
Velocity Plot @ valve lift 0.003m
Pressure Plot @ valve lift 0.003m
SG Mass Flow Rate
Results and Observation
1. From the graph, we can see that as the refinement level increases mass flow rate magnitude also get more optimum.
2. There are no subsequent changes in pressure plots.
3. But in the Velocity plot, when the fluid enters th combustion chamber for different grid sizes the velocity pattern is considerably changing.
4. With the grid size of 5, we observe a pattern th can be said to be the Swirl of the fluid that happens inside the cylinder. Hence for proper results and plot description, we go with grid siz 5.
Although, we may go for a higher value but t may increase the computation time as well.
5. VALVE LIFT TEST
5.1 Parameters for Valve Lift Test
With a grid size of 5, now we run another parametric study where we change the valve lift from 0.001m to 0.008m with 8 intervals, rest other parameters are kept same one change that is made is we add a local mesh around the valve so as to get better results. In this study we're looking for the Velocity and Pressure plots, Mass flow rates for different valve lifts, Flow trajectories, etc.
5.2 Results Of Parametric study of valve lift
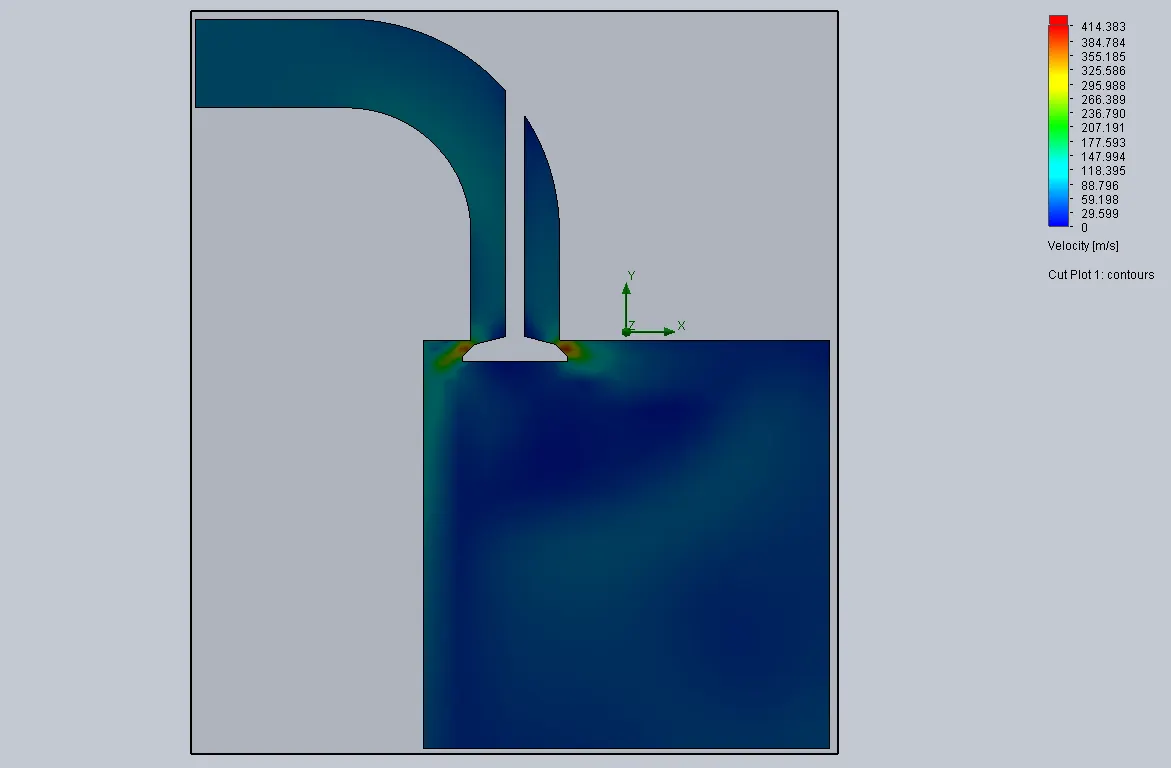
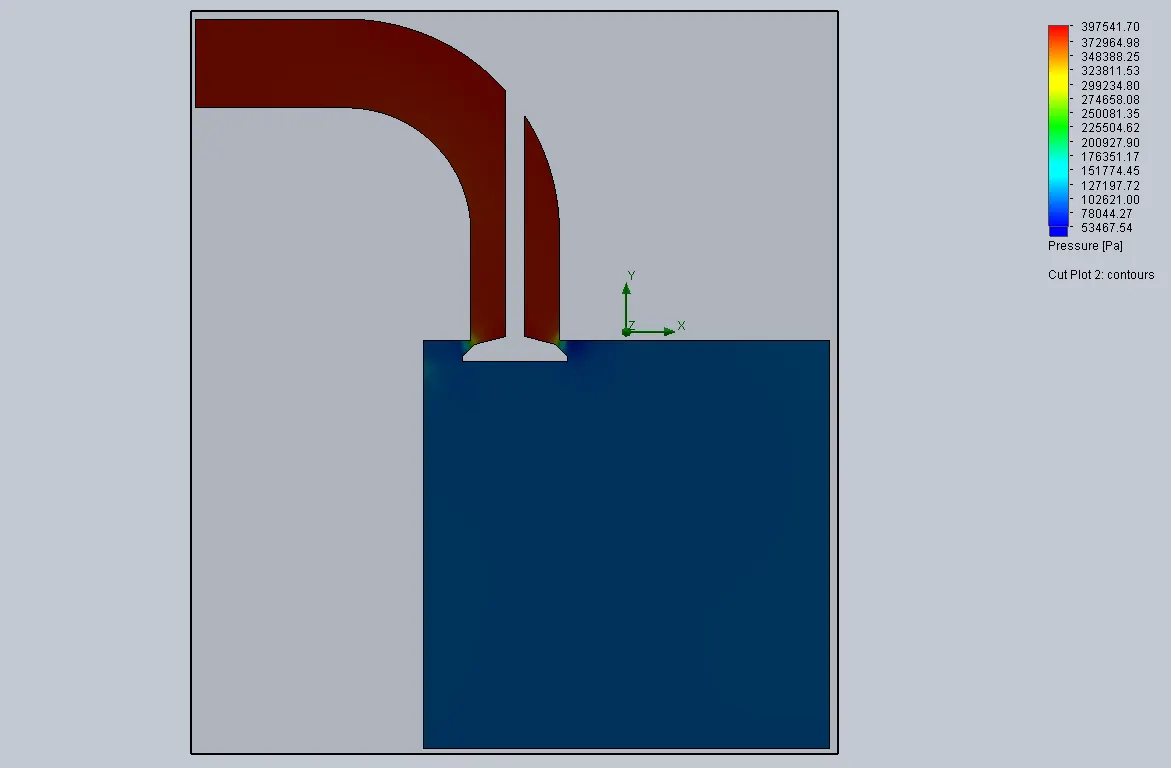
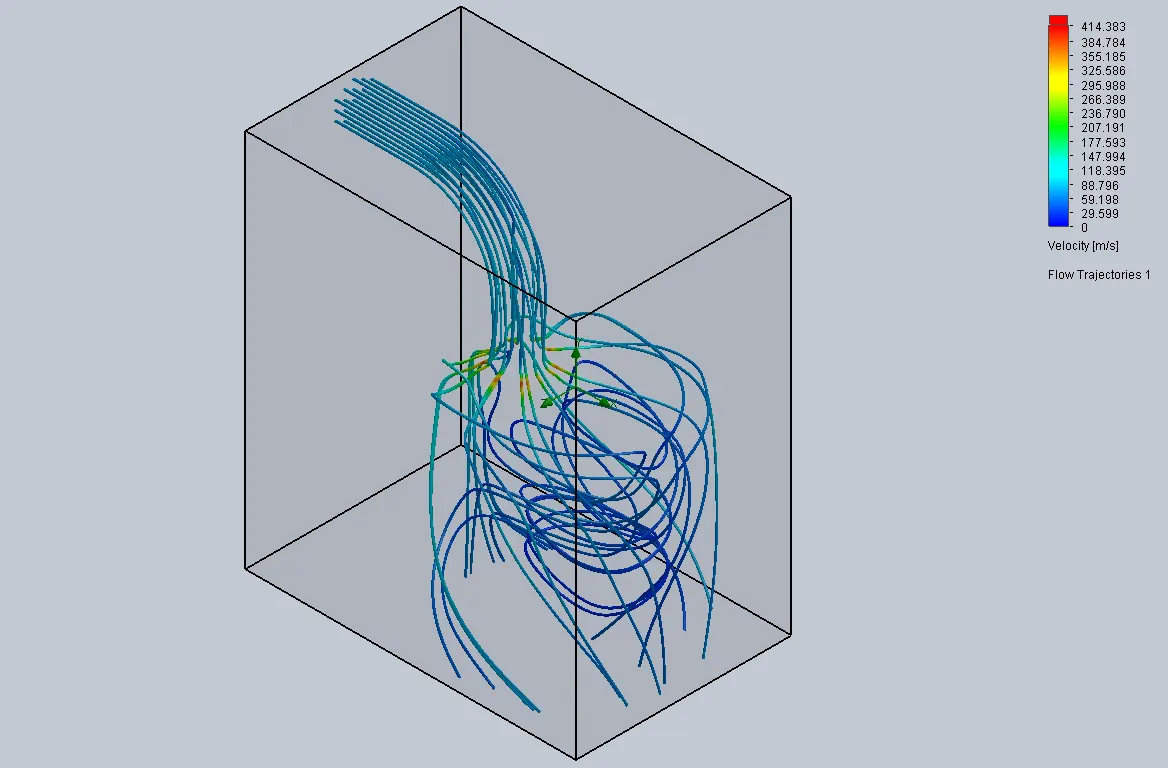
a. Valve lift at 0.001m
Velocity Plot @ Mesh Size 5
Pressure Plot @ Mesh size 5
Velocity Trajectory of Valve Lift at 0.001m
b. Valve lift at 0.002m
Velocity Plot @ Mesh Size 5
Pressure Plot @ Mesh size 5
Velocity Trajectory of Valve Lift at 0.002m
c. Valve lift at 0.003m
Velocity Plot @ Mesh Size 5
Pressure Plot @ Mesh size 5
Velocity Trajectory of Valve Lift at 0.003m
d. Valve lift at 0.004m
Velocity Plot @ Mesh Size 5
Pressure Plot @ Mesh size 5
Velocity Trajectory of Valve Lift at 0.004m
e. Valve lift at 0.005m
Velocity Plot @ Mesh Size 5
Pressure Plot @ Mesh size 5
Velocity Trajectory of Valve Lift at 0.005m
f. Valve lift at 0.006m
Velocity Plot @ Mesh Size 5
Pressure Plot @ Mesh size 5
Velocity Trajectory of Valve Lift at 0.006m
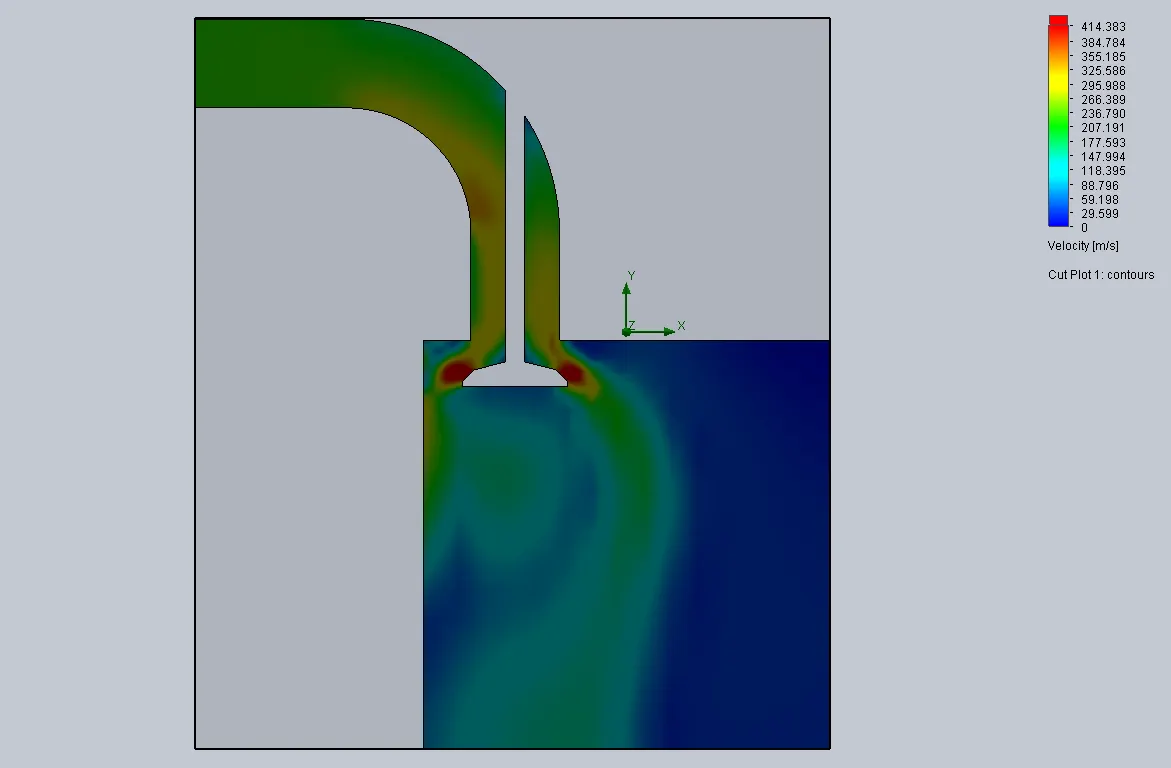
g. Valve lift at 0.007m
Velocity Plot @ Mesh Size 5
Pressure Plot @ Mesh size 5
Trajectory of Valve Lift at 0.007m
h. Valve lift at 0.008m
Velocity Plot @ Mesh Size 5
Pressure Plot @ Mesh size 5
Trajectory of Valve Lift at 0.008m
5.3. Graph
The plot of Valve lift vs Mass flow rate
6. RESULTS AND OBSERVATION
i. From The pressure plot, we can observe that a the valve lift increase the pressure decreases d to the increase in distance between the valve opening and the cylinder.
ii. From the velocity plot, we can observe that as t valve lift increase the velocity increases and the pressure decreases. Pressure is maximum at th valve lift 0.001 and from the velocity trajectory, is observed that due to high-pressure swirling effect takes place.
iii. The swirling effect reduces as the valve lift increases can be observed in the velocity trajectory plots.
iv. Mass flow rate reduces as the valve lift increas this is because of the resistance to the flow du the attachment to the valve seat and valve hea As the valve lift continue to increase, larger intake valve opening allows for greater induction mass flow rate which causes the increase of discharge coefficient.