Mathematical Model of a Battery
Lead Acid Battery
Lead-acid battery technology is commonly used in automotive SLI (Starting, Lighting and Ignition) applications because they are robust, tolerant to abuse, tried and tested and because of their low cost. For higher power applications with intermittent loads, however, Lead-acid batteries are generally too big and heavy and they suffer from a shorter cycle life and typical usable power down to only 50% Depth of Discharge (DOD).
Lead-acid batteries are composed of a Lead-dioxide cathode, a sponge metallic Lead anode and a Sulphuric acid solution electrolyte. This heavy metal element makes them toxic and improper disposal can be hazardous to the environment. The cell voltage is 2 Volts.
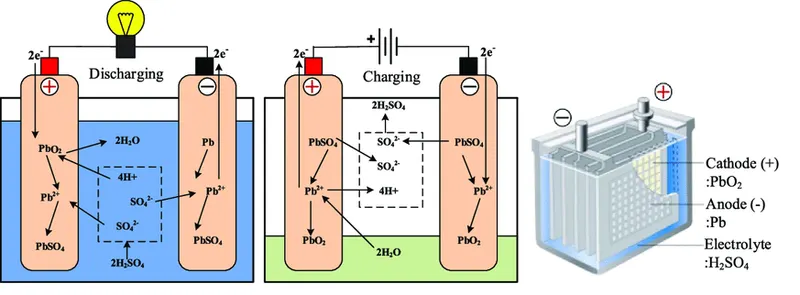
Reaction at the negative electrode
`Pb+SO_4^(2-)harrPbSO_4+2e^-`
Reaction at the positive electrode
`PbO_2+4H^++SO_4^(2-)harrPbSO_4+2H_2O`
Overall Reaction
`Pb+PbO_2+2H_2SO_4harr2PbSO_4+2H_2O`
Note
From right to left is charging and from lest to right is discharge
Discharge
During discharge, the lead dioxide (positive plate) and lead (negative plate) react with the electrolyte of sulfuric acid to create lead sulfate, water and energy.
Fully discharged: two identical lead sulfate plates and diluted sulfuric acid solution
Charge
During charging, the cycle is reversed: the lead sulfate and water are electro-chemically converted to lead, lead oxide and sulfuric acid by an external electrical charging source.
Fully recharged: Lead dioxide positive plate, Lead negative plate, and concentrated aqueous sulfuric acid solution
Modelling of a battery
It is essential to design and analyze the efficiency, capacity, life, charging time, fast charging capability, discharge capability, etc before building an actual model of the battery. This helps in getting insights before building the actual battery.
Advantage of Modeling
- Modelling and simulation helps in predicting the performance
- Saves time and money as building a real-world model will involve time and cost
- Modelling makes it safe for testing extreme conditions
- Energy is not wasted on testing purpose
- It is an environmentally friendly technique
- Various form factor and chemistry can be tested virtually
In order to analyze the battery performance, we need to model the battery and study the behaviour on the basis of environmental conditions, battery chemistry, usage characteristics, etc.
Types of Battery Model
1. Electrochemistry Model
The electrochemical model consists of a coupled partial differential equation to describe the diffusion, migration, and reaction kinetics inside the battery. In this, the battery is divided into three domains, a negative electrode, separator, and positive electrode. The electrochemical model
has to be discretized in both the x and r directions, resulting in thousands of states (equations). Implementing a real-time battery management system (BMS) using the spatial discretization method is computationally prohibitive and on-board memory demanding. Therefore, in order to develop an electrochemical model for real-time battery management, deriving a simplified and computationally efficient mathematical model is crucial.
2. Equivalent Circuit Model
The equivalent circuit model (ECM) is the most commonly used battery model in a battery management system (BMS). It is formed by an open-circuit voltage source connected with a set of electric elements, such as resistors and capacitors, to model the electrical behaviour of a battery. The ECM is widely used for battery SOC estimation because it is computationally efficient. The technique estimates battery voltages based on current inputs, and different resistor-capacitor (RC) branches can be used to capture different time constants inherent in the battery system. However, because the ECM is empirical in nature, it provides little insights into the electrochemical process inside the battery, and it cannot provide highly accurate results.
Understanding Battery Specifications and Parameters
Before modelling a battery we must study the various parameters used to characterise the cells or batteries and the behaviour of the cell or battery with various operating conditions.
C-rates – In describing batteries, discharge current is often expressed as a C-rate in order to normalize against battery capacity, which is often very different between batteries. A C-rate is a measure of the rate at which a battery is discharged relative to its maximum capacity. A 1C rate means that the discharge current will discharge the entire battery in 1 hour. For a battery with a capacity of 100 Amp-hrs, this equates to a discharge
current of 100 Amps. A 5C rate for this battery would be 500 Amps, and a C/2 rate would be 50 Amps. Similarly, an E-rate describes the discharge power. A 1E rate is the discharge power to discharge the entire battery in 1 hour.
State of Charge (SOC) – An expression of the present battery capacity as a percentage of maximum capacity. SOC is generally calculated using current integration to determine the change in battery capacity over time.
Depth of Discharge (DOD) – The percentage of battery capacity that has been discharged expressed as a percentage of maximum capacity. A discharge to at least 80 % DOD is referred to as a deep discharge.
Terminal Voltage (V) – The voltage between the battery terminals with a load applied. The terminal voltage varies with SOC and discharge/charge current.
Open-circuit voltage (V) – The voltage between the battery terminals with no load applied. The open-circuit voltage depends on the battery state of charge, increasing with state of charge.
Internal Resistance – The resistance within the battery, generally different for charging and discharging, also dependent on the battery state of charge. As internal resistance increases, the battery efficiency decreases and thermal stability is reduced as more of the charging energy is converted into heat.
Nominal Voltage (V) – The reported or reference voltage of the battery, also sometimes thought of as the “normal” voltage of the battery.
Cut-off Voltage – The minimum allowable voltage. It is this voltage that generally defines the “empty” state of the battery.
Capacity or Nominal Capacity (Ah for a specific C-rate) – The coulometric capacity, the total Amp-hours available when the battery is discharged at a certain discharge current (specified as a C-rate) from 100 per cent state-of-charge to the cut-off voltage. Capacity is calculated by multiplying the discharge current (in Amps) by the discharge time (in hours) and decreases with increasing C-rate.
Energy or Nominal Energy (Wh (for a specific C-rate)) – The “energy capacity” of the battery, the total Watt-hours available when the battery is discharged at a certain discharge current (specified as a C-rate) from 100 per cent state-of-charge to the cut-off voltage. Energy is calculated by multiplying the discharge power (in Watts) by the discharge time (in hours). Like capacity, energy decreases with increasing C-rate.
Cycle Life (number for a specific DOD) – The number of discharge-charge cycles the battery can experience before it fails to meet specific performance criteria. Cycle life is estimated for specific charge and discharge conditions. The actual operating life of the battery is affected by the rate and depth of cycles and by other conditions such as temperature and humidity. The higher the DOD, the lower the cycle life.
Specific Energy (Wh/kg) – The nominal battery energy per unit mass, sometimes referred to as the gravimetric energy density. Specific energy is a characteristic of the battery chemistry and packaging. Along with the energy consumption of the vehicle, it determines the battery weight required to achieve a given electric range.
Specific Power (W/kg) – The maximum available power per unit mass. Specific power is a characteristic of the battery chemistry and packaging. It determines the battery weight required to achieve a given performance target.
Energy Density (Wh/L) – The nominal battery energy per unit volume, sometimes referred to as the volumetric energy density. Specific energy is a characteristic of the battery chemistry and packaging. Along with the energy consumption of the vehicle, it determines the battery size required to achieve a given electric range.
Power Density (W/L) – The maximum available power per unit volume. Specific power is a characteristic of the battery chemistry and packaging. It determines the battery size required to achieve a given performance target.
Maximum Continuous Discharge Current – The maximum current at which the battery can be discharged continuously. This limit is usually defined by the battery manufacturer in order to prevent excessive discharge rates that would damage the battery or reduce its capacity. Along with the maximum continuous power of the motor, this defines the top sustainable speed and acceleration of the vehicle.
Maximum 30-sec Discharge Pulse Current –The maximum current at which the battery can be discharged for pulses of up to 30 seconds. This limit is usually defined by the battery manufacturer in order to prevent excessive discharge rates that would damage the battery or reduce its capacity. Along with the peak power of the electric motor, this defines the acceleration performance (0-60 mph time) of the vehicle.
Charge Voltage – The voltage that the battery is charged to when charged to full capacity. Charging schemes generally consist of a constant current charging until the battery voltage reaches the charge voltage, then constant voltage charging, allowing the charge current to taper until it is very small.
Float Voltage – The voltage at which the battery is maintained after being charge to 100 per cent SOC to maintain that capacity by compensating for self-discharge of the battery.
Charge Current (Recommended) – The ideal current at which the battery is initially charged (to roughly 70 per cent SOC) under constant charging scheme before transitioning into constant voltage charging.
Internal Resistance (Maximum) – The resistance within the battery, generally different for charging and discharging.
Discharge Curves
Energy cells have been developed for a wide range of applications using a variety of different technologies, resulting in a wide range of available performance characteristics. The graphs below show some of the main factors an applications engineer should take into account when specifying a battery to match the performance requirements of the end product.
Cell Chemistry
The nominal voltage of a galvanic cell is fixed by the electrochemical characteristics of the active chemicals used in the cell, the so-called cell chemistry. The actual voltage appearing at the terminals at any particular time, as with any cell, depends on the load current and the internal impedance of the cell and this varies with, temperature, the state of charge and with the age of the cell.
The graph below shows typical discharge curves for cells using a range of cell chemistries when discharged at 0.2C rate.
The X-axis shows the cell characteristics normalised as a percentage of cell capacity so that the shape of the graph can be shown independent of the actual cell capacity. If the X-axis was based on discharge time, the length of each discharge curve would be proportional to the nominal capacity of the cell.
Temperature Characteristics
Cell performance can change dramatically with temperature. At the lower extreme, in batteries with aqueous electrolytes, the electrolyte itself may freeze setting a lower limit on the operating temperature.
At low temperatures, Lithium batteries suffer from Lithium plating of the anode causing a permanent reduction in capacity.
At the upper extreme the active chemicals may break down destroying the battery. In between these limits the cell performance generally improves with temperature.
The above graph shows how the performance of Lithium-Ion batteries deteriorates as the operating temperature decreases. Probably more important is that, for both high and low temperatures, the further the operating temperature is from room temperature the more the cycle life is degraded.
Discharge Rates
The discharge curves for a Lithium-Ion cell below show that the effective capacity of the cell is reduced if the cell is discharged at very high rates (or conversely increased with low discharge rates). This is called the capacity offset and the effect is common to most cell chemistries.
If the discharge takes place over a long period of several hours as with some high rate applications such as electric vehicles, the effective capacity of the battery can be as much as double the specified capacity at the C rate. The Society of Automotive Engineers (SAE) uses the discharge over a period of 20 hours (0.05C) as the standard condition for measuring the Amp-hour capacity of automotive batteries. The graph below shows that the effective capacity of a deep discharge lead-acid battery is almost doubled as the discharge rate is reduced from 1.0C to 0.05C. For discharge times less than one hour (High C rates), the effective capacity falls off dramatically.
The two conclusions to be drawn from two graphs relating to the discharge rate
- Care should be exercised when comparing battery capacity specifications to ensure that comparable discharge rates are used.
- In an automotive application, if high current rates are used regularly for hard acceleration or for hill climbing, the range of the vehicle will be reduced.
Self Discharge Characteristics
The self-discharge rate is a measure of how quickly a cell will lose its energy while sitting on the shelf due to unwanted chemical actions within the cell. The rate depends on cell chemistry and temperature.
The rate of unwanted chemical reactions that cause internal current leakage between the positive and negative electrodes of the cell, like all chemical reactions, increases with temperature thus increasing the battery self-discharge rate.
Typical self-discharge rates for common rechargeable cells are as follows:
- Lead Acid 4% to 6% per month
- Nickel Cadmium 15% to 20% per month
- Nickel Metal Hydride 30% per month
- Lithium 2% to 3% per month
Internal Impedance
The internal impedance of a cell determines its current-carrying capability. Low internal resistance allows high currents.
Battery Equivalent Circuit
- Rm is the resistance of the metallic path through the cell including the terminals, electrodes and interconnections.
- Ra is the resistance of the electrochemical path including the electrolyte and the separator.
- Cb is the capacitance of the parallel plates which form the electrodes of the cell.
- Ri is the non-linear contact resistance between the plate or electrode and the electrolyte.
Typically internal resistance is in the order of milliohms.
Effects of Internal Impedance
1. When current flows through the cell there is an IR voltage drop across the internal resistance of the cell which decreases the terminal voltage of the cell during discharge and increases the voltage needed to charge the cell thus reducing its effective capacity as well as decreasing its charge/discharge efficiency. Higher discharge rates give rise to higher internal voltage drops which explains the lower voltage discharge curves at high C rates.
2. The internal impedance is affected by the physical characteristics of the electrolyte, the smaller the granular size of the electrolyte material the lower the impedance. The grain size is controlled by the cell manufacturer in a milling process.
The spiral construction of the electrodes is often used to maximise the surface area and thus reduce internal impedance. This reduces heat generation and permits faster charge and discharge rates. Thus we can say that the cell capacity is directly proportional to the area of the electrode and internal resistance is inversely proportional to the area of the electrode. Hence we can say that the internal resistance is inversely proportional to the battery capacity and the battery state of charge.
3. The internal resistance of most cell chemistries also tends to increase significantly towards the end of the discharge cycle as the active chemicals are converted to their discharged state and hence are effectively used up. This is principally responsible for the rapid drop off in cell voltage at the end of the discharge cycle.
4. The internal resistance of a galvanic cell is temperature-dependent, decreasing as the temperature rises due to the increase in electron mobility. The graph below is a typical example.
Thus the cell may be very inefficient at low temperatures but the efficiency improves at higher temperatures due to the lower internal impedance, but also to the increased rate of the chemical reactions. However the lower internal resistance unfortunately also causes the self-discharge rate to increase. Furthermore, cycle life deteriorates at high temperatures. Some form of heating and cooling may be required to maintain the cell within a restricted temperature range to achieve the optimum performance in high power applications.
In addition, the Joule heating effect of the I2R losses in the internal resistance of the cell will cause the temperature of the cell to rise.
The voltage drop and the I2R losses may not be significant for a 1000 mAh cell powering a mobile phone but for a 100 cell 200 Ah automotive battery they can be substantial. Typical internal resistance for a 1000mA Lithium mobile phone battery is around 100 to 200mOhm and around 1mOhm for a 200Ah Lithium cell used in an automotive battery.
6. Operating at the C rate the voltage drop per cell will be about 0.2 volts in both cases, (slightly less for the mobile phone). The I2R loss in the mobile phone will be between 0.1 and 0.2 Watts. In the automotive battery however, the voltage drop across the whole battery will be 20 Volts and I2R power loss dissipated as heat within the battery will be 40 Watts per cell or 4KW for the whole battery. This is in addition to the heat generated by the electrochemical reactions in the cells.
7. As cell ages, the resistance of the electrolyte tends to increase. Ageing also causes the surface of the electrodes to deteriorate and the contact resistance builds up and at the same, the effective area of the plates decreases reducing its capacitance. All of these effects increase the internal impedance of the cell adversely affecting its ability to perform. Comparing the actual impedance of a cell with its impedance when it was new can be used to give a measure or representation of the age of a cell or its effective capacity. Such measurements are much more convenient than actually discharging the cell and can be taken without destroying the cell under test.
8. The internal resistance also influences the effective capacity of a cell. The higher the internal resistance, the higher the losses while charging and discharging, especially at higher currents. This means that for high discharge rates the lower the available capacity of the cell. Conversely, if it is discharged over a prolonged period, the AmpHour capacity is higher. This is important because some manufacturers specify the capacity of their batteries at very low discharge rates which makes them look a lot better than they really are.
Mathematical Model of a Lead-Acid Battery
The first in the development of an accurate mathematical model of a battery is to build and parameterize an equivalent circuit of a battery that reflects the battery’s nonlinear behaviour and dependencies on temperature, SOC, SOH, and current. These dependencies are unique to each battery’s chemistry.
The mathematical model of a battery depends upon the experimental values obtained from various test cases. The laboratory experiments are performed on different cell chemistries that contribute to the formation of the mathematical model.
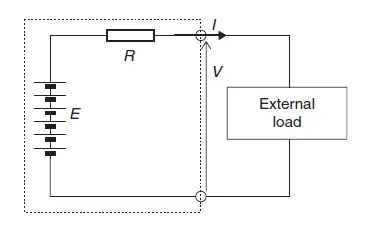
The nominal voltage of a battery cell is an experimental value that gives us the approximate value of the voltage when the cell is delivering the electrical power. In practical cases, the voltage keeps on changing as when the cell is being discharged the voltage drops, and when the being charged the voltage will rise. This behaviour of the cell can be expressed using the internal resistance of the battery, this is known as a simple equivalent circuit model.
Simple equivalent circuit of a battery
Applying Kirchoff's Law
`E=IR+V` or `V=E-IR` where
`E` is open circuit voltage
`I` is the current flowing through the circuit
`V` is the voltage across the load
`R` is the internal resistance of the battery
Note if the current is zero it means the electromotive force (EMF) is equal to the open-circuit voltage.
The above circuit used to predict the in-use battery voltage, assuming that the open-circuit voltage E and battery internal resistance R is constant but they are not, as their vales are affected by other factors such as state of charge, operating temperature, etc.
The internal resistance of a lead-acid cell is 0.022ohm per cell for 1Ah cell
Internal Resistance of a Battery pack can be given as `R=n*0.022/(C_10) Omega` where n is the no. of cells.
Self-discharging of the battery
As we know that the batteries convert chemical energy to chemical energy and vice-versa. The rate at which these reactions occur determines the rate of charge and discharge.
The presence of impurities in the cell material and external environmental factors such as temperature, humidity, etc also contributing to the reactions that occur inside the cell. These unwanted reactions thus contribute to the unwanted discharge of the cell.
Thus we can say that the open-circuit voltage refers to the battery EMF that is observed when the battery is discharged at a very less C-Rate (C/20 or lower). This experimental study can be used to determine the values of open-circuit voltage at different values of battery charge left or the SOC.
The open-circuit voltage (OCV) of a sealed lead acid battery changes with the state of charge (SOC=1-DOD)
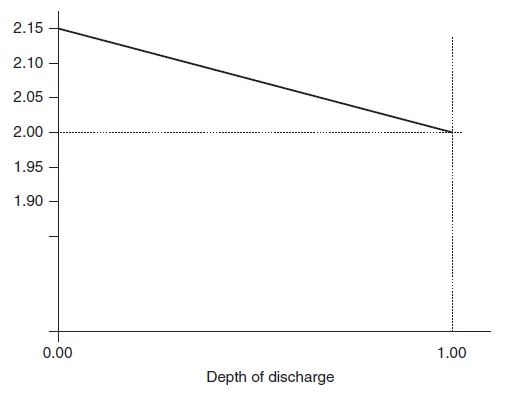
For the above-experimented result, we can deduce a linear polynomial function to estimate the open-circuit voltage based on the value of depth of discharge (DOD).
`E=n[2.15-DOD(2.15-2)]` where
`n` is the number of cells
In the above equation, we didn't consider the dynamic behaviour of the battery example when a load is connected the battery voltage E will immediately change to a lower value, but in the real case, the battery takes some time for the voltage to settle down. Thus a more accurate dynamic behaviour will also consider time and temperature in the equation.
Capacity estimation
The capacity of a battery is reduced when the current is drawn at a higher C-rate, this phenomenon plays an important role in estimating the battery capacity.
Peukert model of battery model is used to estimate the battery capacity in cases where the discharge rate is typically higher as in the case of an electric vehicle.
Peukert Equation
It is a common misunderstanding that the energy not delivered by the battery due to Peukert's Law is "lost" (as heat for example). In actual fact, once the load is removed, the battery voltage will recover, and more energy can again be drawn out of the battery. This is because the law applies specifically to batteries discharged at constant current down to the cutoff voltage. The battery will no longer be able to deliver that current without falling below the cutoff voltage, so it is considered discharged at that point, despite significant energy still remaining in the battery.
The Peukert equation is a convenient way of characterising cell behaviour and of quantifying the capacity offset in mathematical terms.
This is an empirical formula which approximates how the available capacity of a battery changes according to the rate of discharge.
`C_p=I^kT`
where `C_p` is the theoretical capacity of the battery expressed in Amp-hours, `I` is current, `T` is time, and `k` is the Peukert Number, a constant for the given battery. The equation shows that at higher currents, there is less available energy in the battery. The Peukert Number is directly related to the internal resistance of the battery. Higher currents mean more losses and less available capacity.
The value of the Peukert number indicates how well a battery performs under continuous heavy currents. A value close to 1 indicates that the battery performs well; the higher the number, the more capacity is lost when the battery is discharged at high currents. The Peukert number of a battery is determined empirically.
For Lead-acid batteries, the Peukert number is typically between 1.3 and 1.4
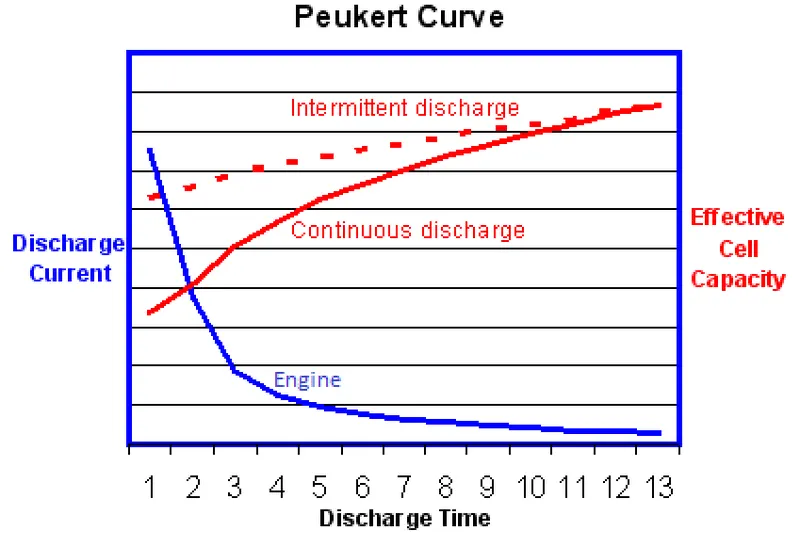
The graph above shows that the effective battery capacity is reduced at very high continuous discharge rates. However, with intermittent use, the battery has time to recover during quiescent periods when the temperature will also return towards the ambient level. Because of this potential for recovery, the capacity reduction is less and the operating efficiency is greater if the battery is used intermittently as shown by the dotted line.
This is the reverse of the behaviour of an internal combustion engine which operates most efficiently with continuous steady loads. In this respect, electric power is a better solution for delivery vehicles which are subject to continuous interruptions.
The Peukerts effect shows that if the current `I` flow from the battery, then from battery point of view the amount for current flow our is `I^k`. As long as the values of `I` and `k` are greater than 1, the value of `I^k` will be larger than I.
Thus the loss charge in time step `delta t` can be estimated as
Loss of charge`=deltat*(I^k-I)`
The apparent or effective charged removed from the battery in time `deltat` can be found using the below equation
`CR_(n+1)=CR_n+(deltat*I^k)/3600` in Amphours where
`CR_n` is the total charge removed up till `n^(th` time step
`deltat` is the time step in seconds (`(deltat)/3600` will be the time in hours)
Similarly, the charge supplied by the battery in time `deltat` can be found using the below equation
`CS_(n+1)=CS_n+(deltat*I)/3600` in Amphours where
`CS_n` is the total charge removed up till `n^(th` time step
`deltat` is the time step in seconds (`(deltat)/3600` will be the time in hours)
The depth of discharge of the battery can be expressed in terms of Peukert capacity and charged removed from the battery
`DOD_n=(CR_n)/C_p`
Calculating Peukart Coefficient
The method to find the Peukaert coefficient is fairly easy and only requires battery capacity at two different discharge times.
The two different ratings give two different rated currents
`I_1=C_1/T_1` and `I_2=C_2/T_2`
The respective Peukert capacity for the above can be written as
`C_p=I_1^k*T_1` and `C_p=I_2^k*T_2`
Since the Peukert capacity is the same and equating both the equation we get
`I_1^k*T_1=I_2^k*T_2`
`(I_1/I_2)^k=T_2/T_1`
Taking log on both sides
`k=(logT_2-LogT_1)/(logI_1-LogI_2)`
For example, the nominally capacity of a battery is 42 Ah (10 h rating) also has a capacity of 33.6 Ah at a 1 h rating.
`k=(log1-Log10)/(log4.2-Log33.6)=(-1)/(-0.903)=1.07`
MATLAB Function to find OCV
function e_ocv=open_circuit_voltage_nc(dod,n)
%find the open-circuit voltage of a lead acid battery
%battery at any value of depth of discharge(dod)
%the value of dod must be between 0 and 1
if dod<0
    error('depth of discharge <0');
end

if dod>1
    error('depth of discharge >1');
end

%battery voltage lead acid battery
e_ocv=(2.15-((2.15-2)*dod))*n;
Mathematical Model of Lead Acid Battery
%battery modelling
clear all
close all
clc

% Assumed constants
i=[30 50 100];          %discharge current in amps
n=5;                    %no of cells
capacity=50;            %normal 3h rated capacity of battery
k=1.3;                  %Peukert Coefficient for lead-acid battery
dt=50;                  %take 50 seconds step time


%time ranges from 0 to 50000 seconds insteps of 1
t=(0:1:5000);

%charge removed form electrodes corrected using Peukert Coefficient
cr=zeros(length(t),length(i));

%depth of discharge, starting at fully charged
dod=zeros(length(t),length(i));

%battery v at each time step
v=zeros(length(t),length(i));

%charge supplied by the battery in ah
cs=zeros(length(t),length(i));


for ct_1=1:length(i)

    %calculated values
    r_int=(0.022/capacity)*n;    %internal resistance
    peukert_capacity=(capacity^k)*1;

    %starting voltage
    v(1,ct_1)=open_circuit_voltage_nc(0,n)-i(ct_1)*r_int;

    for ct=2:length(t)

        cr(ct,ct_1)=cr(ct-1,ct_1)+(i(ct_1)^k*dt/3600);
        dod(ct,ct_1)=cr(ct,ct_1)/peukert_capacity;

        if dod(ct,ct_1)>1
            dod(ct,ct_1)=1;
        end
            v(ct,ct_1)=open_circuit_voltage_nc(dod(ct,ct_1),n)-i(ct_1)*r_int;

        if dod(ct,ct_1)>0.9999  %battery is dead if dod>0.99
            v(ct,ct_1)=0;
        end

        if v(ct,ct_1)>0
            cs(ct,ct_1)=cs(ct-1,ct_1)+(i(ct_1)*dt/3600);  %real ampere _hour given out by the battery using Peukert correction
        else
            cs(ct,ct_1)=cs(ct-1,ct_1);
        end
    end
end

% battery voltage_v vs amperehour
figure(1)
plot(cs,v);
xlabel('Charge Supplied (amperehours)');
ylabel('Battery Voltage (volts)');
title('Battery Capacity vs Discharge Rate for Lead-Acid Battery ')
legend('0.6 C-rate','1 C-rate','2 C-rate')

figure(2)
plot(dod(:,2),v(:,2),'.b');
xlabel('Depth of Discharge');
ylabel('Battery Voltage (volts)');
title('Discharge Curve for Lead-Acid Battery')
legend('1 C-rate')
Result
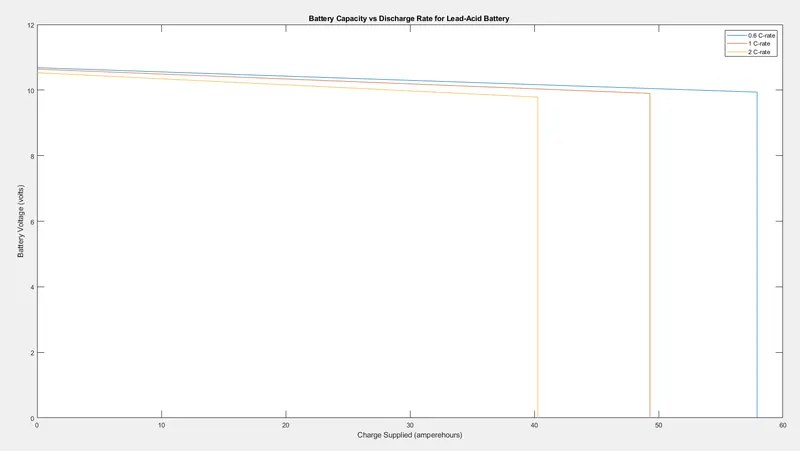
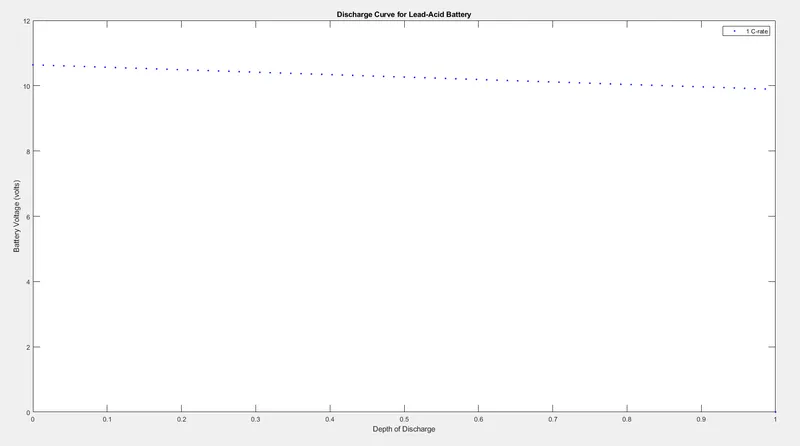
The below graphs represents the lead-acid battery characteristics curves.
The voltage vs depth of discharge characteristics typically shows that OCV is directly proportional to the state of charge of the battery. This also shows the effect of internal resistance increase with the increase in depth of discharge hence the voltage drop increase with depth of discharge.
Battery Capacity vs Discharge Rate
The discharge curves show that the effective capacity of the cell is reduced if the cell is discharged at very high rates (or conversely increased with low discharge rates). This phenomenon is called the capacity offset.