Independent Research Project
CFD simulation of water hammer in a pipeline
Aim:-
To analysis the maximum pressure surge at the closing end of pipeline due to the effect of water hammer in pipeline by using the CFD simulation. The maximum pressure at the closing end is analysed for two different inlet pressure such the protection device are designed to control high pressure and vacuum.
Introduction:-
Water hammer is a transient flow in pipes which is created by sudden changes of velocity in pipe lines. This phenomenon can cause strong positive and negative pressures in water conveyance pipes and usually it poses pipeline to danger. Water hammer is created by rapidly closing valves, shutting off or suddenly restarting pumps. It has destructive hydrodynamic effects in pressurized pipelines. This phenomenon cannot be eliminated but can be reduced by using different protection devices.
Many researchers have used experimental as well as theoretical methods to examine the phenomena of the water hammer in straight pipes. Under unfavourable circumstances, damage due to water hammer may occur in pipelines measuring more than one hundred meters and conveying only several tenths of a liter per second. But even very short, unsupported pipelines in pumping stations can be damaged by resonant vibrations if they are not properly anchored the damage caused by water hammer by far exceeds the cost of preventive analysis and surge control measures. The ability to provide reliably designed surge control equipment, such as an air vessel or accumulator1, flywheel and air valve, has long been state of the art. Water Sector clearly states that pressure transients have to be considered when designing and operating water supply systems, because they can cause extensive damage. This means that a surge analysis to industry standards has to be performed for every hydraulic piping system at risk from water hammer. Dedicated software is available for this purpose. Using CFD tool we are making efforts to preview the effect of water hammer and suggest methods to reduce the same. Through modelling of pipe networks pressure surge analysis for piping systems with different objectives are investigated. The results of pressure surge analysis are used to optimize the system/piping system or are used for assessment of plant safety.
Theory:-
The term water hammer‘ is used to describe the fluid flow characteristics when a fluid in motion is forced to stop in closed systems such as a pipe network. This phenomenon produces intense pressure waves that travel periodically along the pipe. Water hammer mostly occurs in piping systems, e.g., in power plants and urban water carrier systems, due to a sudden change in the flow rate during a sudden closure (or opening) of a valve or pump failure. In general we can say hydraulic transients or surge is a phenomenon in a closed conduit or pipe is associated with rapid changes in discharge or velocity is accompanied by a change in pressure, which propagates through the pipe.
Water hammer is mainly caused due to sudden closing of valves. When valve closes, there is high pressure spikes generation due to which pipe suffers vibration and thudding sound.
Typical events that require transient considerations include:
- Pump start up or shutdown.
- Valve opening or closing -variation in cross-sectional flow area
- Changes in boundary pressures -e.g. losing overhead storage tank, adjustments in the water level at reservoirs, pressure changes in tanks, etc.
- Rapid changes in demand conditions -e.g. hydrant flushing.
- Changes in transmission conditions -e.g. main break or line freezing .
- Pipe filling or draining air release from pipes.
- Check valve or regulator valve action.
The above phenomenon may cause the following problems:
- When the non-return valve or the pump discharge valve closes, depending on the magnitude of the reverse flow already established, a pressure rise occurs, which may exceed the design/test pressure of the pipe.
- During the initial down surge phase, the magnitude of the pressure drop may be such that, at an elevated location along the alignment, vapor pressure occurs. This is termed as water column separation, which on cavity collapse create a shock pressure rise, which travels on the both sides and may cause the pressure to exceed design/test pressure. For large diameter steel pipes, the occurrence of vapor pressure is a severe problem.
- Pump damage.
- Intense pressure spikes.
- Bursting of pipes, seals.
- Destroyed meters and gauges.
Water hammer effect is studied practically on basis of theoretical data and calculations. After that to reduce water hammer, some protecting devices are installed on the pipeline. Following surge protection systems are considered to control high and pressure and vacuum conditions in pipeline-
Surge Vessel (Air Chamber).
Surge Tanks.
Air Valves (Vacuum Valve).
Zero Velocity Valve.
Modelling and Meshing:-
In this study the pipeline model is designed using ANSYS Spaceclaim. The pipe is designed with 100 mm Outer diameter and 2000 mm length. The image of the pipeline is shown in Figure 1. After completing the modelling section the file is transferred to meshing . In meshing we a multizone method with all hexa element. The element size is taken as 8 mm. this make the total number of elements 35670 and total nodes to 41002 . Figure 2 show the mesh of pipeline. The name selection is given to pipe one is inlet, outlet and wall as shown in Figure 3.
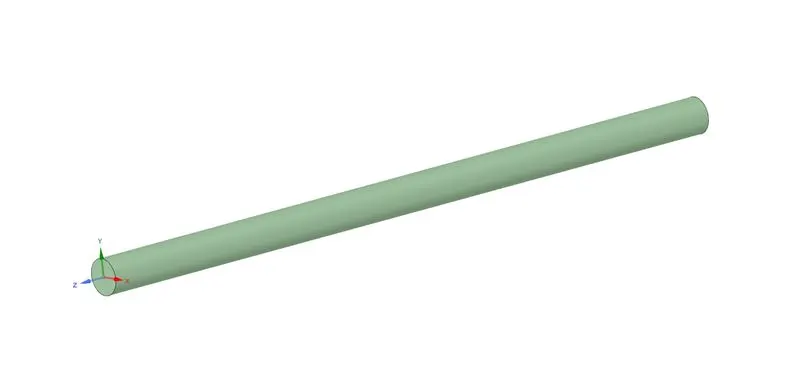
Figure 1, Geometry
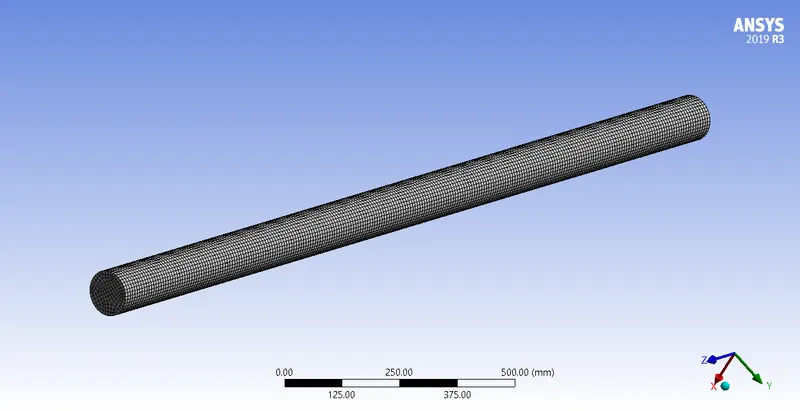
Figure 2, Meshed Geometry
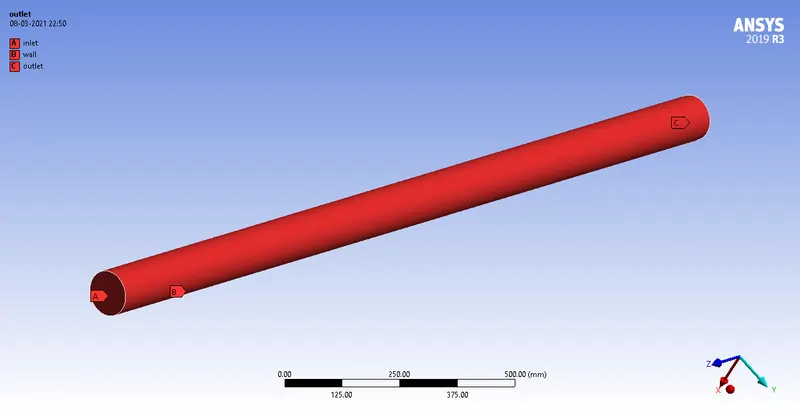
Figure 3, Geometry name selection
Simulation setup and analysis:-
The fluent mesh is transferred to fluent for simulation setup. In fluent setup we have to perform a transient state simulation because the pressure surge due to sudden closing can be captured on time basis. For our case the velocity is high and we get a Reynolds number up to 2e7 so it’s a turbulent simulation .turbulent model is selected is K-e model with reliazable and scalable wall treatment. Relisable is selected because it capture the mean flow of involving strong adverse pressure gradients. Our y plus value must be lie in log-log region for K-e model so we choose the scalable wall treatment so that its shift the near wall mesh point y+ to 11. Material selected as water liquid but we have to change the density to compressible liquid in order to have sudden pressure in pipes. And in cell zone condition select the zone fluid as water liquid. For boundary condition we choose inlet as a pressure inlet . In first case we apply a inlet pressure of 101325 pascal, then in second case we chose a inlet pressure of 50000 pascal. Outlet is defined first as outlet pressure with gauge pressure of 0 pascal, then by using scheme file we change that pressure outlet boundary condition to wall to get a sudden closing at the end. Wall is defined as non slip wall and stationary wall.
to obtain a condition of sudden closing at the outlet end of pipe we have to upload as scheme file. The scheme file is shown below written in notepad and saved with extension “.scm”.
(cond
( (< (rpgetvar 'flow-time) 0.1)
(ti-menu-load-string "define/boundary-conditions/zone-type 7 pressure-outlet"))
( (> (rpgetvar 'flow-time) 0.1)
(ti-menu-load-string "define/boundary-conditions/zone-type 7 wall")
(ti-menu-load-string "define/boundary-conditions wall 7 no no no 0 no 0.5"))
)
The file is save with extension “.scm” , in fluent folder. In fluent click on file then read and then scheme then select the file. Fluent will read the file. In the scheme file first we have given a condition when the flow time is less the 0.1 second then the outlet wall with WALL ID 7 , as given in fluent boundary condition, will act as pressure outlet . When the flow time is greater the 0.1 second the wall condition changed to wall. Now for wall we are not making any changes in wall motion so ‘no’ ,then changes to shear condition ‘no’ ,wall roughness model ’no’ , roughness height ‘0’ , roughness constant ‘0.5’ . this are the condition we haven for wall. The scheme file should read at every time step for that we need to apply a command in execute command window . Command “/file/read-macro “filename.scm” by giving this command the scheme file will read at every time step. Detail of wall as a boundary condition is collected by typing in command format define- boundary-conditios-wall- and following keywars as shown below for each options.
- Wall Motion [motion-bc-stationary]: Change current value? [no] n
- Shear Boundary Condition [shear-bc-noslip]: Change current value? [no] n
- Use Profile for Wall Roughness Height? [no] n
- Wall Roughness Height (m) [0] 0
- Use Profile for Wall Roughness Constant? [no] n
- Wall Roughness Constant [0.5] 5
In our simulation we are going to measure the maximum pressure due to sudden closing. For that we need a two monitor point one at the middle of the pipe length and one at the end of the pipe. Two monitor point has been creating and in report definition we choose surface report for vertex average at the monitor point for static pressure. To create a animation of the surge we choose a plane at the middle of the pipe and then create a animation for total pressure contour on that plane. Auto save at every timestep is activated. Then solution is initialized with standard initialized from the inlet at gauge pressure according to our case. Transient simulation consume too much of resources so first we run the simulation with time step size of 0.001 second for 500 iteration with 20 time step, using this large time step size we get to 0.1 second flow time much faster, when e are near to 0.1 flow time we have to decrease the time step size to 5E-6 second so that we can accurately captured the pressure surge. Run the simulation for more number of time step. Figure 4 shows the monitor point one at the middle and one at the end. Figure 5 shows the mid plane for pressure animation.
Result:-
After completing the simulation calculation for our first case with input pressure of 101325 pascal we can see from the end pressure plot that’s until we reach at the flow time 0.1 second the pressure remains constant but after 0.1 second the outlet convert to wall then we can see a sudden rise in the pressure at the wall. Then the pressure wave start oscillating from high pressure zone to low pressure zone. Pressure wave oscillate to and fro and its amplitude slowly getting die. The maximum pressure comes soon after closing the wall. This maximum pressure helps the engineer to design a prevention system for water hammer. The residual for transient state is shown in Figure 6. Jump in residual because of starting of new time step. The end wall monitoring point pressure is shown in Figure 7, also we plot the static pressure at the mid point monitoring point in Figure 8. The maximum pressure calculated at the closing end is 20203726 pascal. A animation video is attached showing total pressure at the mid plane of pipeline through which we can clearly see the effect of water hammer principal. After that the magnitude of the pressure is slowly getting low and last it dies. For our second case where the input pressure is 50000 pascal we do the same procedure as we do for case one. The maximum pressure calculated by the fluent for second case is 14391756 pascal. A animation file is attached with total pressure on the mid plane of the pipe to visualise the effect of water hammer in pipeline. Residual plot is shown in Figure 9, the end wall and mid wall pressure plot is shown in Figures 10 and 11.
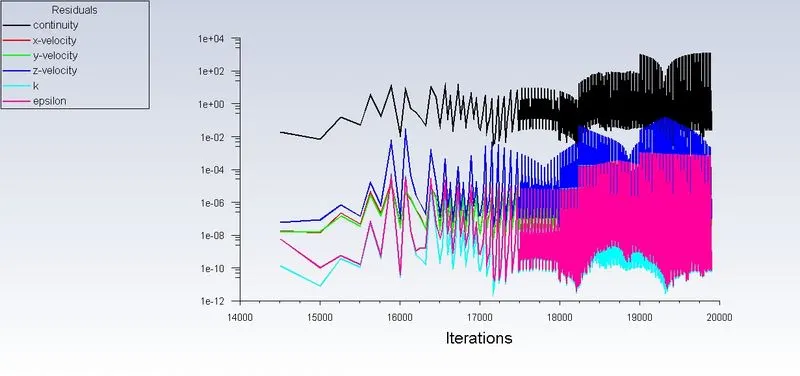
Figure 6 , Residual plot for input pressure of 101325 pascal
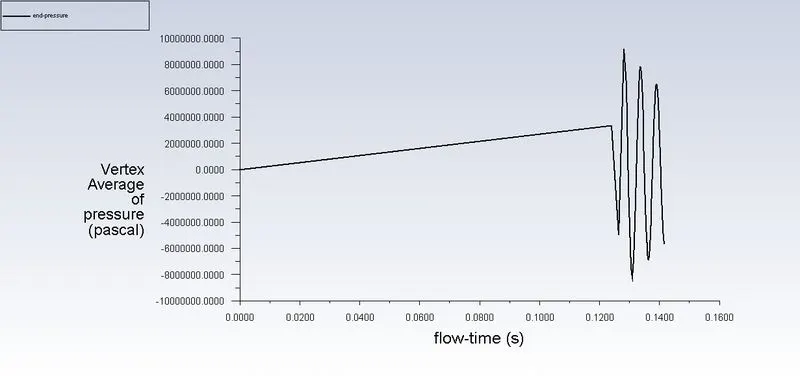
Figure 7, Static pressure at the end of pipe.
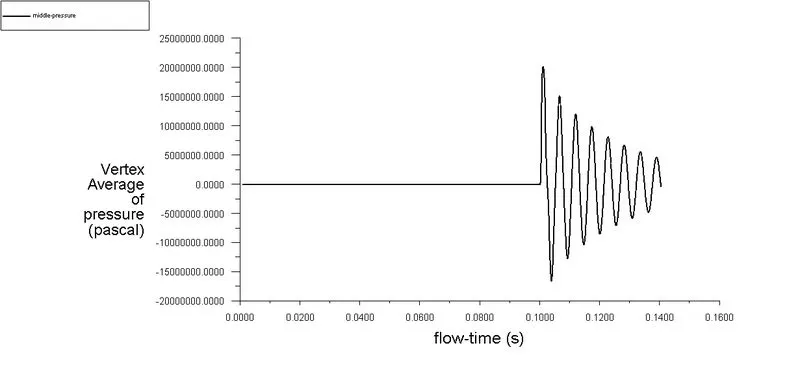
Figure 8, Static pressure plot at the middle of pipe.
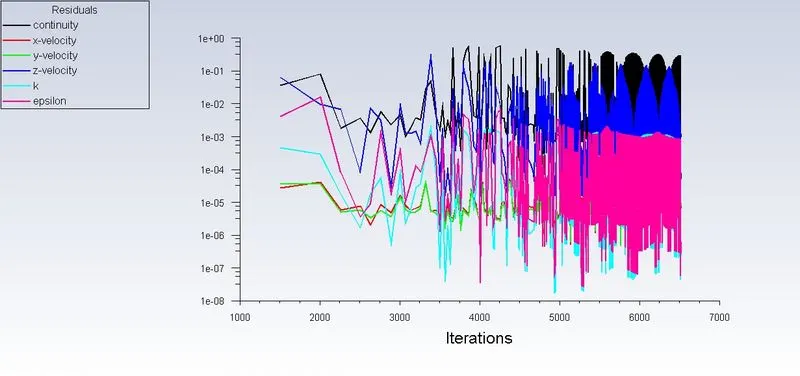
Figure 9, Residual for inlet pressure of 50000 pascal.
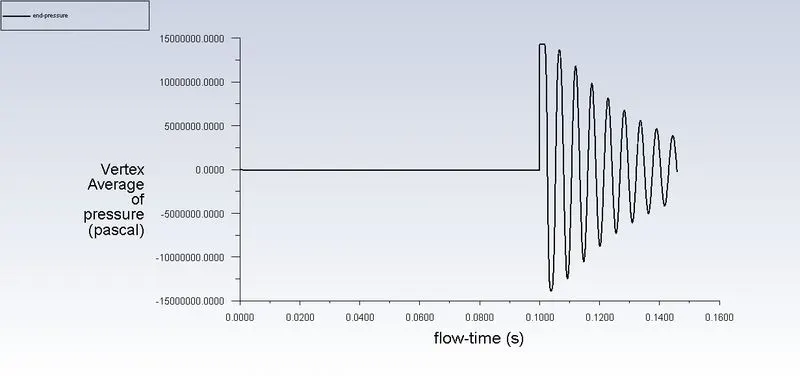
Figure 10, static pressure at the end of pipeline.
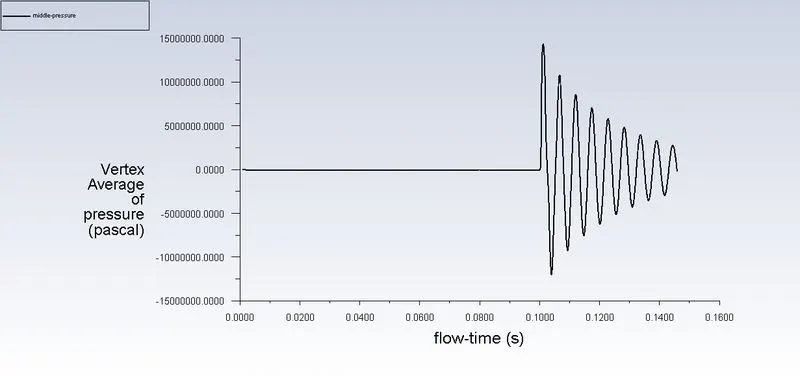
Figure 11, Static pressure at the middle of pipeline
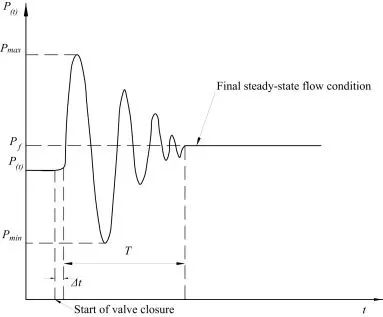
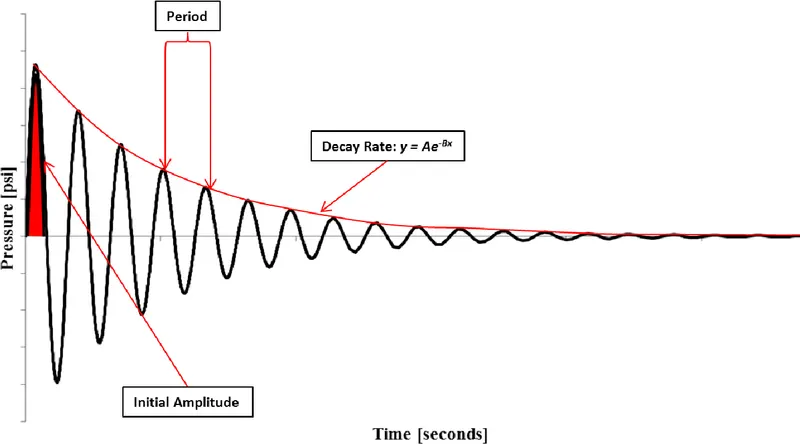
Reference images are taken from research article a water hammer protection method for mine drainage system based on velocity adjustment of hydraulic valve. The images showing the similar spike in pressure and then amplitude continuous to die to steady state. From our simulation we can a similar decay rate of amplitude of pressure surge.
Animation for first case-https://drive.google.com/file/d/1T2gqJBeFXhavaZu0_0eRHpk0dtSeBhEP/view?usp=sharing
Animation for second case- https://drive.google.com/file/d/1o765F5_JffvmvRL417pMaHJaxo5hzsNK/view?usp=sharing
Conclusion :-
CFD tool is thus used to analyse the flow through pipeline in order to locate critical location in pipeline where water hammer is severe. Therefore before installation of protecting devices on pipe, the water hammer and its variation along the pipe is analysed using CFD tool. This will reduce cost and time consumption required to analyse the effect than practical method. In our present case one with input pressure of 101325 pascal, the maximum pressure with which water strike the wall is 20203726 pascal so prevention devises should be design by considering the above pressure. Similarly in case two with inlet pressure of 50000 pascal the maximum pressure is 14391756 pascal. So surge protection system like surge tank, surge vessel and air valve are designed by considering the maximum pressure.